
San Bernardino, California
The following data is available for this address
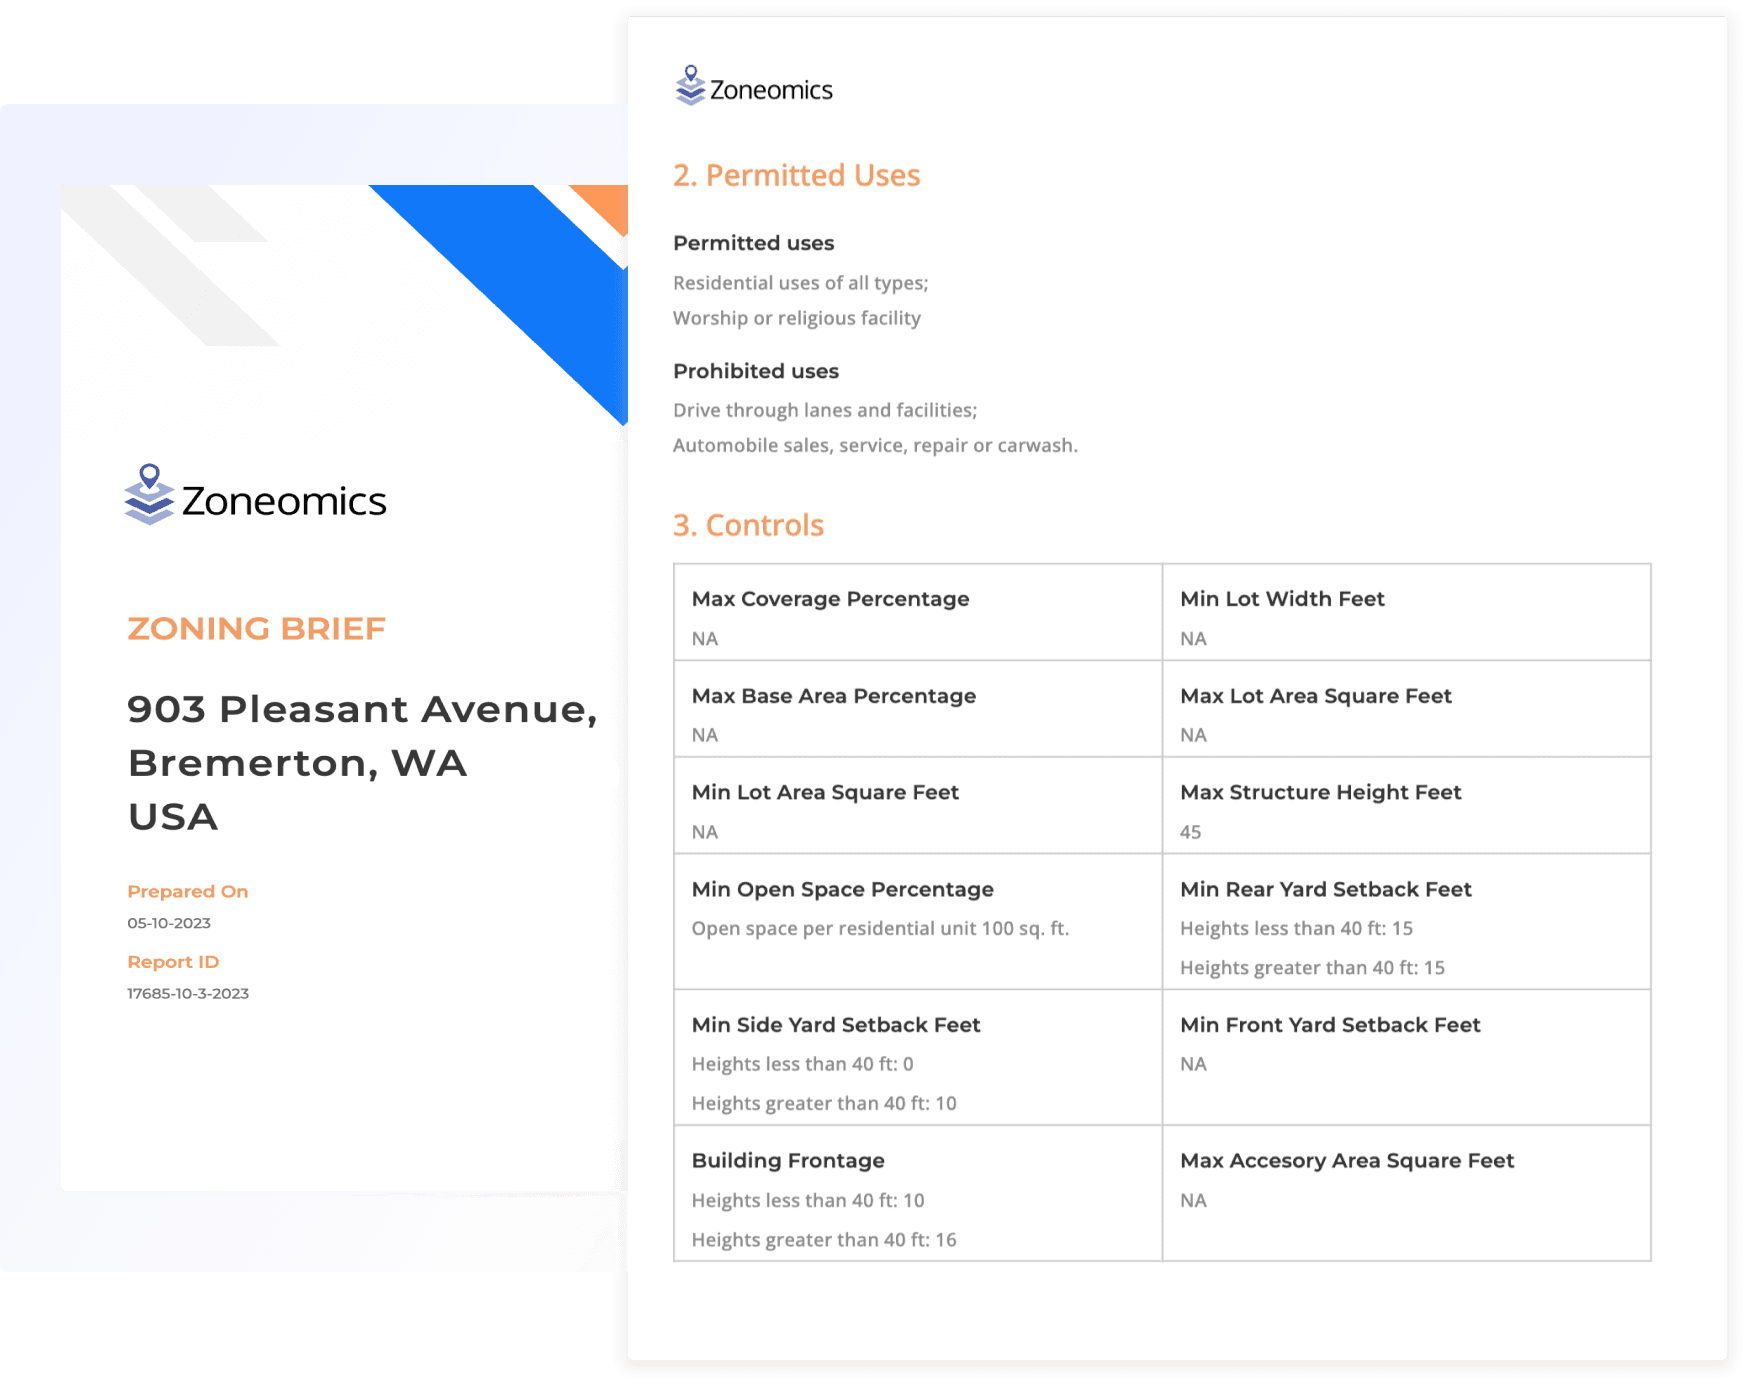
Compliance Review
 Use Compliance Review
- Dimensional Standards Review
Zoning Information
- Zone Code
- Zone Name
- Zone type
- Zone sub type
- Zone guide
- Link
- City name
Building Controls
- Assorted
- Far control
- Lot control
- Density control
- Coverage control
- Pervious control
- Lot width control
- Rear setback control
- Side setback control
- Front setback control
- Building height control
Planning and Zoning for San Bernardino, CA
Largest Zones in San Bernardino, CA
The Zoning Map for the City of San Bernardino in CA divides the city's real estate into zones differentiated according to land use and building regulations.
Get Planning and Zoning records in San Bernardino CA and find the property data, zoning maps, and zoning reports you need. Zoneomics provides the most comprehensive real estate zoning information available through clusters of municipal zoning maps, zoning code and ordinance records, and planning and zoning data.
Explore the zoning map of San Bernardino, CA along with its permitted land uses and development standards
Enter an address in the search bar and get Zoning Reports with:
 Zoning Map Extract
 List of Permitted Land Uses
 Zoning Classification Guide
 Zoning Classification
 Development Controls
 Delivered within 24 hours
 Video Zoning Report Review with Zoning Analyst
Explore all Property Prospects in San Bernardino
Do you have more complex planning and zoning needs?
Visit our subscription pages to find a zoning data and zoning reports package that suits your needs and let our team create a custom account for you.

What is the Land Use Allocation in San Bernardino, California?
The following table illustrates how land is allocated for various uses within San Bernardino, California as defined by city ordinances.
Permitted Use Type | Permitted Use Sub Type | Percentage | Area(sq. m) |
|---|---|---|---|
Parking | 65.52% | 32938.58 | |
| Parking garage or lot | 65.52% | 32938.58 | |
Industrial | 73.41% | 36908.39 | |
| Equipment rental and repair services (excluding automobiles) | 20.87% | 10493.83 | |
| Mining, excavation and resource extraction | 8.54% | 4295.60 | |
| Mills, plants, and other processing facilities | 22.66% | 11391.22 | |
| Storage and warehouses | 62.26% | 31302.67 | |
| Manufacturing | 27.04% | 13592.45 | |
| Contractors office | 20.61% | 10362.96 | |
| General industrial | 13.48% | 6778.56 | |
Residential | 64.88% | 32615.44 | |
| Multi family dwelling mixed use | 10.30% | 5176.03 | |
| Two family dwelling | 4.29% | 2155.88 | |
| Mobile and floating homes | 48.34% | 24303.33 | |
| Accessory dwelling unit | 42.87% | 21551.87 | |
| Multi family dwelling | 43.54% | 21889.95 | |
| Dwellings (unspecified) | 15.19% | 7634.24 | |
| Single family dwelling | 64.43% | 32389.56 | |
| Communal housing | 50.64% | 25457.50 | |
Mechanical | 71.18% | 35783.86 | |
| Utility structures | 71.18% | 35783.86 | |
| Communication towers | 69.69% | 35036.87 | |
Agriculture | 57.41% | 28863.26 | |
| Agricultural and hunting | 57.41% | 28863.26 | |
Other | 97.66% | 49095.56 | |
| Accessory | 69.86% | 35119.42 | |
| Uncategorized | 9.53% | 4792.94 | |
| Temporary uses | 69.87% | 35128.55 | |
| Multiple | 96.83% | 48680.59 | |
Retail | 29.52% | 14841.70 | |
| Professional services | 18.68% | 9388.72 | |
| General retail | 23.79% | 11962.59 | |
| Personal services | 18.95% | 9525.08 | |
| Eating and drinking establishments | 17.50% | 8797.93 | |
| Restricted retail | 18.85% | 9478.17 | |
Community | 94.30% | 47410.11 | |
| Schools and universities | 65.00% | 32680.55 | |
| Medical | 31.94% | 16056.18 | |
| Transportation facilities and infrastructure | 26.11% | 13129.04 | |
| Public, quasi-public, and government | 94.29% | 47403.48 | |
Lodging | 10.57% | 5312.12 | |
| Hotel/motel | 10.57% | 5312.12 | |
Commercial | 25.90% | 13023.30 | |
| Professional office | 18.60% | 9349.45 | |
| Entertainment | 24.41% | 12269.44 | |
| Non-retail sales | 20.48% | 10295.40 | |
| Automobile related uses | 22.94% | 11534.22 | |
| General commercial | 10.98% | 5519.36 | |
| Research and laboratory facilities | 22.71% | 11416.39 |