Peoria County Unincorporated
City Zoning Code
City Zoning Code
APPENDIX D
PEORIA COUNTY STANDARDS FOR STORMWATER DESIGN ANALYSES
The following are the minimum standard, methods and procedures to be used to comply with the stormwater design requirements of Sections 3.12 ("General Erosion and Sediment Control Permits"), 3.13 ("Erosion, Sediment, and Stormwater Control Permits"), and 7.13 ("Erosion, Sediment, and Stormwater Control"). If an applicant determines that different methods are necessary based on site specific conditions, the applicant must request approval from the erosion control administrator to use other methods prior to submittal.
The design methods listed below are readily available in a number of computer programs, including the Soil Conservation Service's TR 20 (SCS) and HEC-1 (U.S. Army Corps of Engineers. Additionally, a simplified methodology which is based on the use of these methods is available in TR 55 (SCS, 1986). TR 55 can be applied using either manual computations or a computerized version.
Rainfall depth and intensity data. Use data for Peoria County (Illinois State Water Survey, BUL-70/89, 1989) as presented in attached Table I and graphically in Figure 1.
Storm event rainfall runoff. Use the SCS Runoff Curve Number Method to determine rainfall runoff depth. See Figure 2-1 and Tables 2-2a through 2-2c (attached) from TR 55. Soil type information is available from the SCS Peoria County Soil Survey, 1992.
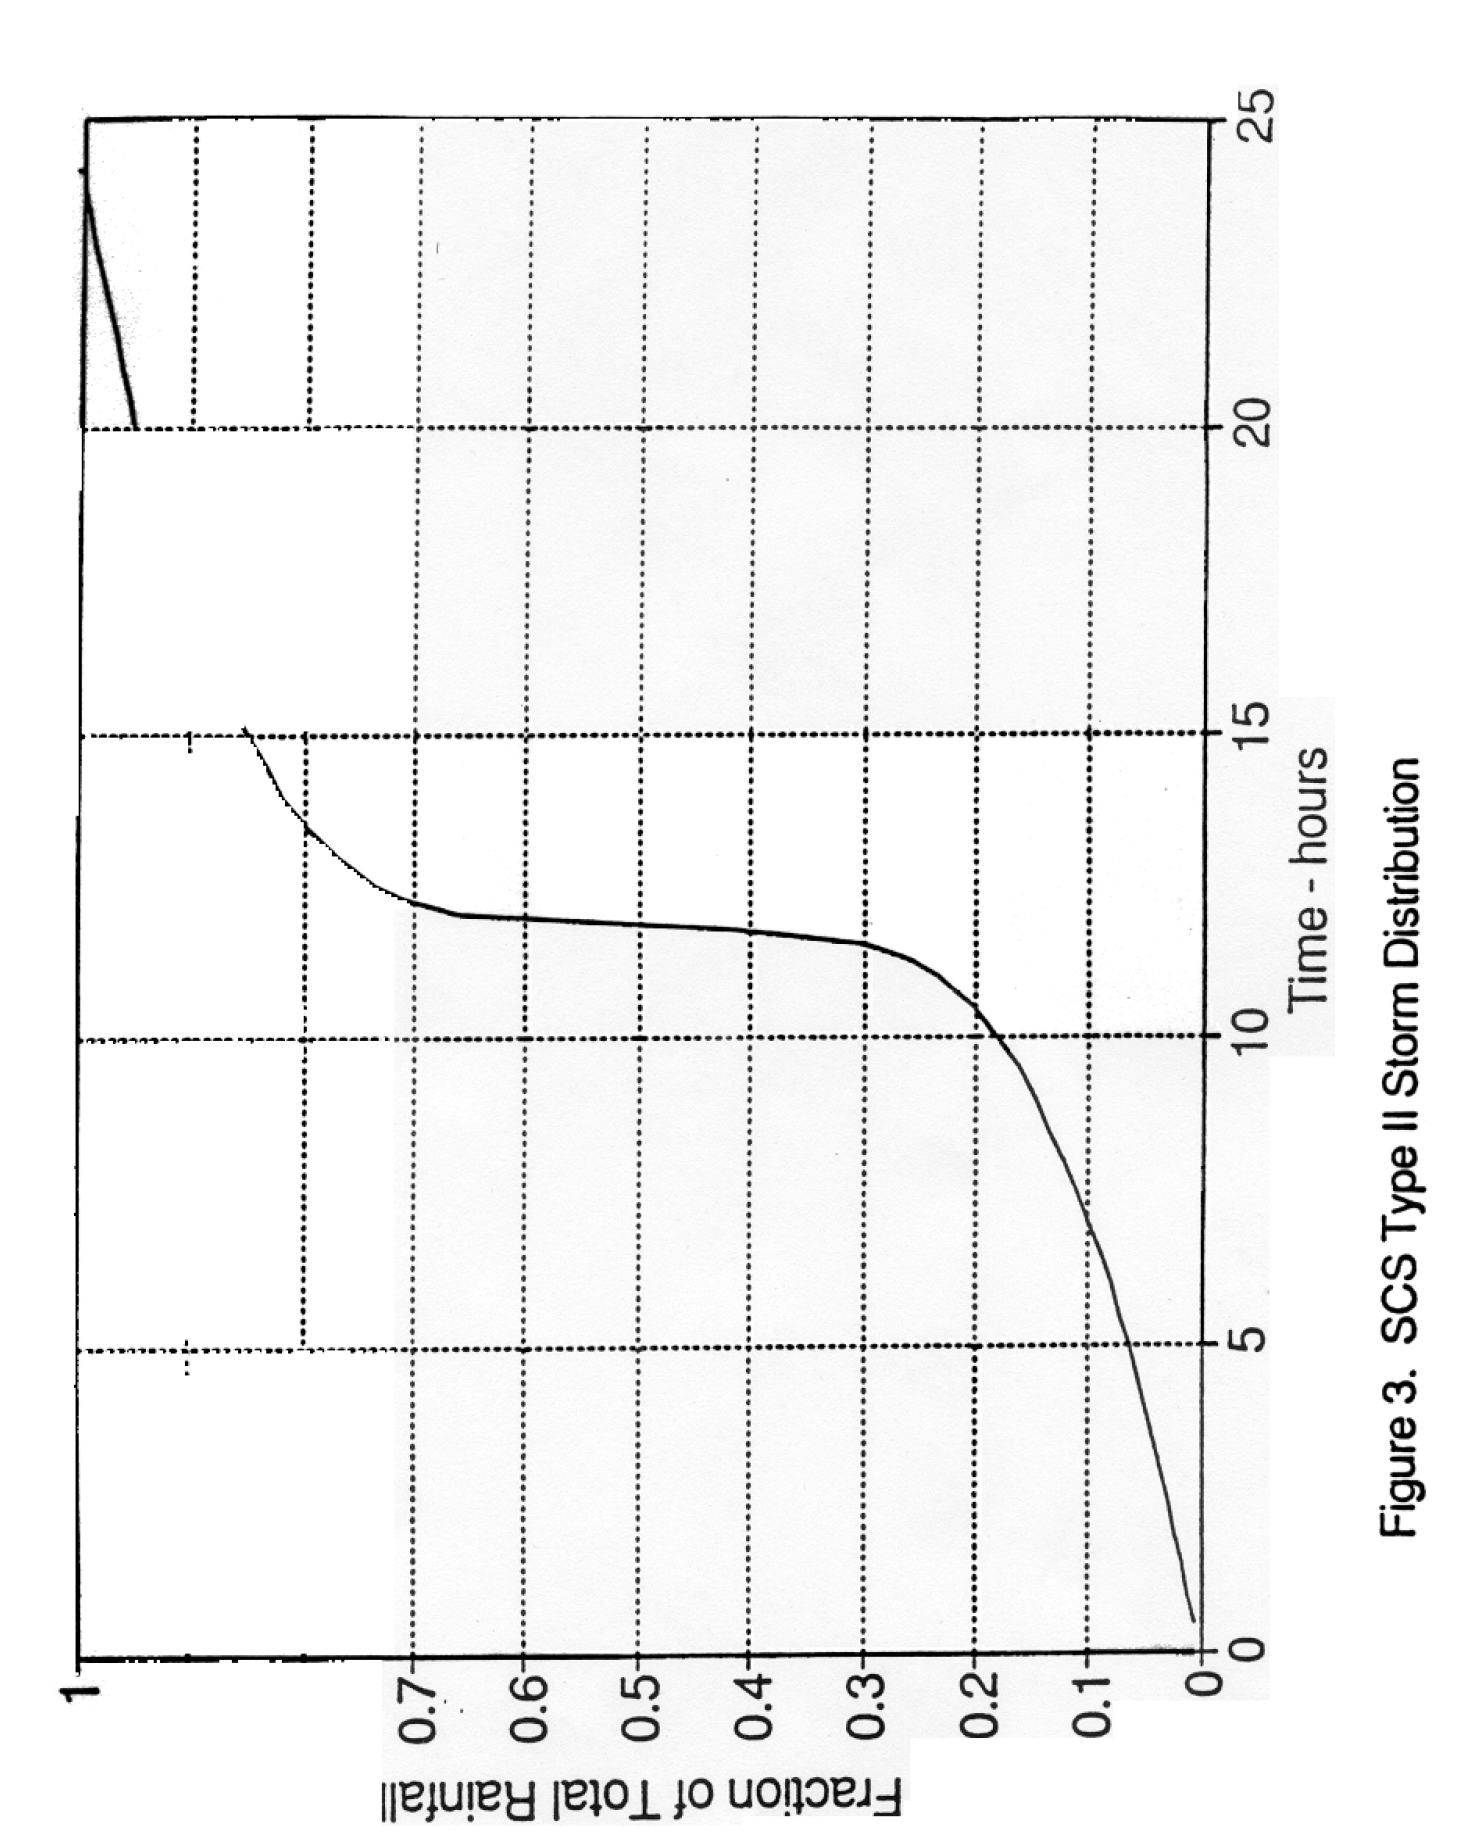
Storm distribution (cumulative rainfall versus time). Use the SCS Type 11 storm distribution. See attached Table 3 and Figure 3.
Runoff hydrograph. Use the SCS dimensionless hydrograph. See SCS (1974) for in- formation regarding this procedure. As a substitute for detailed hydrograph analysis, TR 55 (SCS, 1986) can be used, either manually or computer program.
Storage routing (detention pond analysis). Use the continuity equation, also known as the Modified-Pula and Storage indication methods. As a substitute for detailed storage routing of a hydrograph, TR 55 (SCS, 1986) can be used, either manually or computer program. If TR 55 is used and a detention basin with a two-stage outlet control structure including a rectangular weir and/or orifice outlet is included as a part of the control measures, use the attached detention basin outlet work sheet to determine and present the structure design information.
TABLE 1
RAINFALL DEPTH-DURATION-FREQUENCY DATA FOR PEORIA COUNTY
Rainfall Depth (inches) for Given Frequency
| Duration | 2-yr | 5-yr | 10-yr | 25-yr | 50-yr | 100-yr |
|---|---|---|---|---|---|---|
| 5-min. | 0.36 | 0.45 | 0.53 | 0.64 | 0.73 | 0.83 |
| 10-min. | 0.66 | 0.83 | 0.98 | 1.17 | 1.34 | 1.52 |
| 15-min. | 0.81 | 1.02 | 1.20 | 1.44 | 1.64 | 1.87 |
| 30-min. | 1.12 | 1.39 | 1.64 | 1.97 | 2.25 | 2.56 |
| 1-hr. | 1.42 | 1.77 | 2.09 | 2.50 | 2.86 | 3.25 |
| 2-hr. | 1.78 | 2.22 | 2.62 | 3.14 | 3.59 | 4.08 |
| 3-hr. | 1.93 | 2.41 | 2.85 | 3.41 | 3.89 | 4.43 |
| 6-hr. | 2.26 | 2.82 | 3.33 | 3.99 | 4.56 | 5.19 |
| 12-hr. | 2.62 | 3.27 | 3.87 | 4.63 | 5.29 | 6.02 |
| 18-hr. | 2.75 | 3.46 | 4.09 | 4.90 | 5.59 | 6.37 |
| 24-hr. | 3.02 | 3.76 | 4.45 | 4.32 | 6.08 | 6.92 |
| 48-hr. | 3.38 | 4.19 | 4.86 | 5.78 | 6.62 | 7.51 |
| 72-hr. | 3.70 | 4.55 | 5.26 | 6.15 | 7.25 | 8.16 |
| 5-day | 4.17 | 5.11 | 5.84 | 6.96 | 7.98 | 9.21 |
| 10-day | 5.12 | 6.27 | 7.10 | 8.19 | 9.10 | 10.18 |
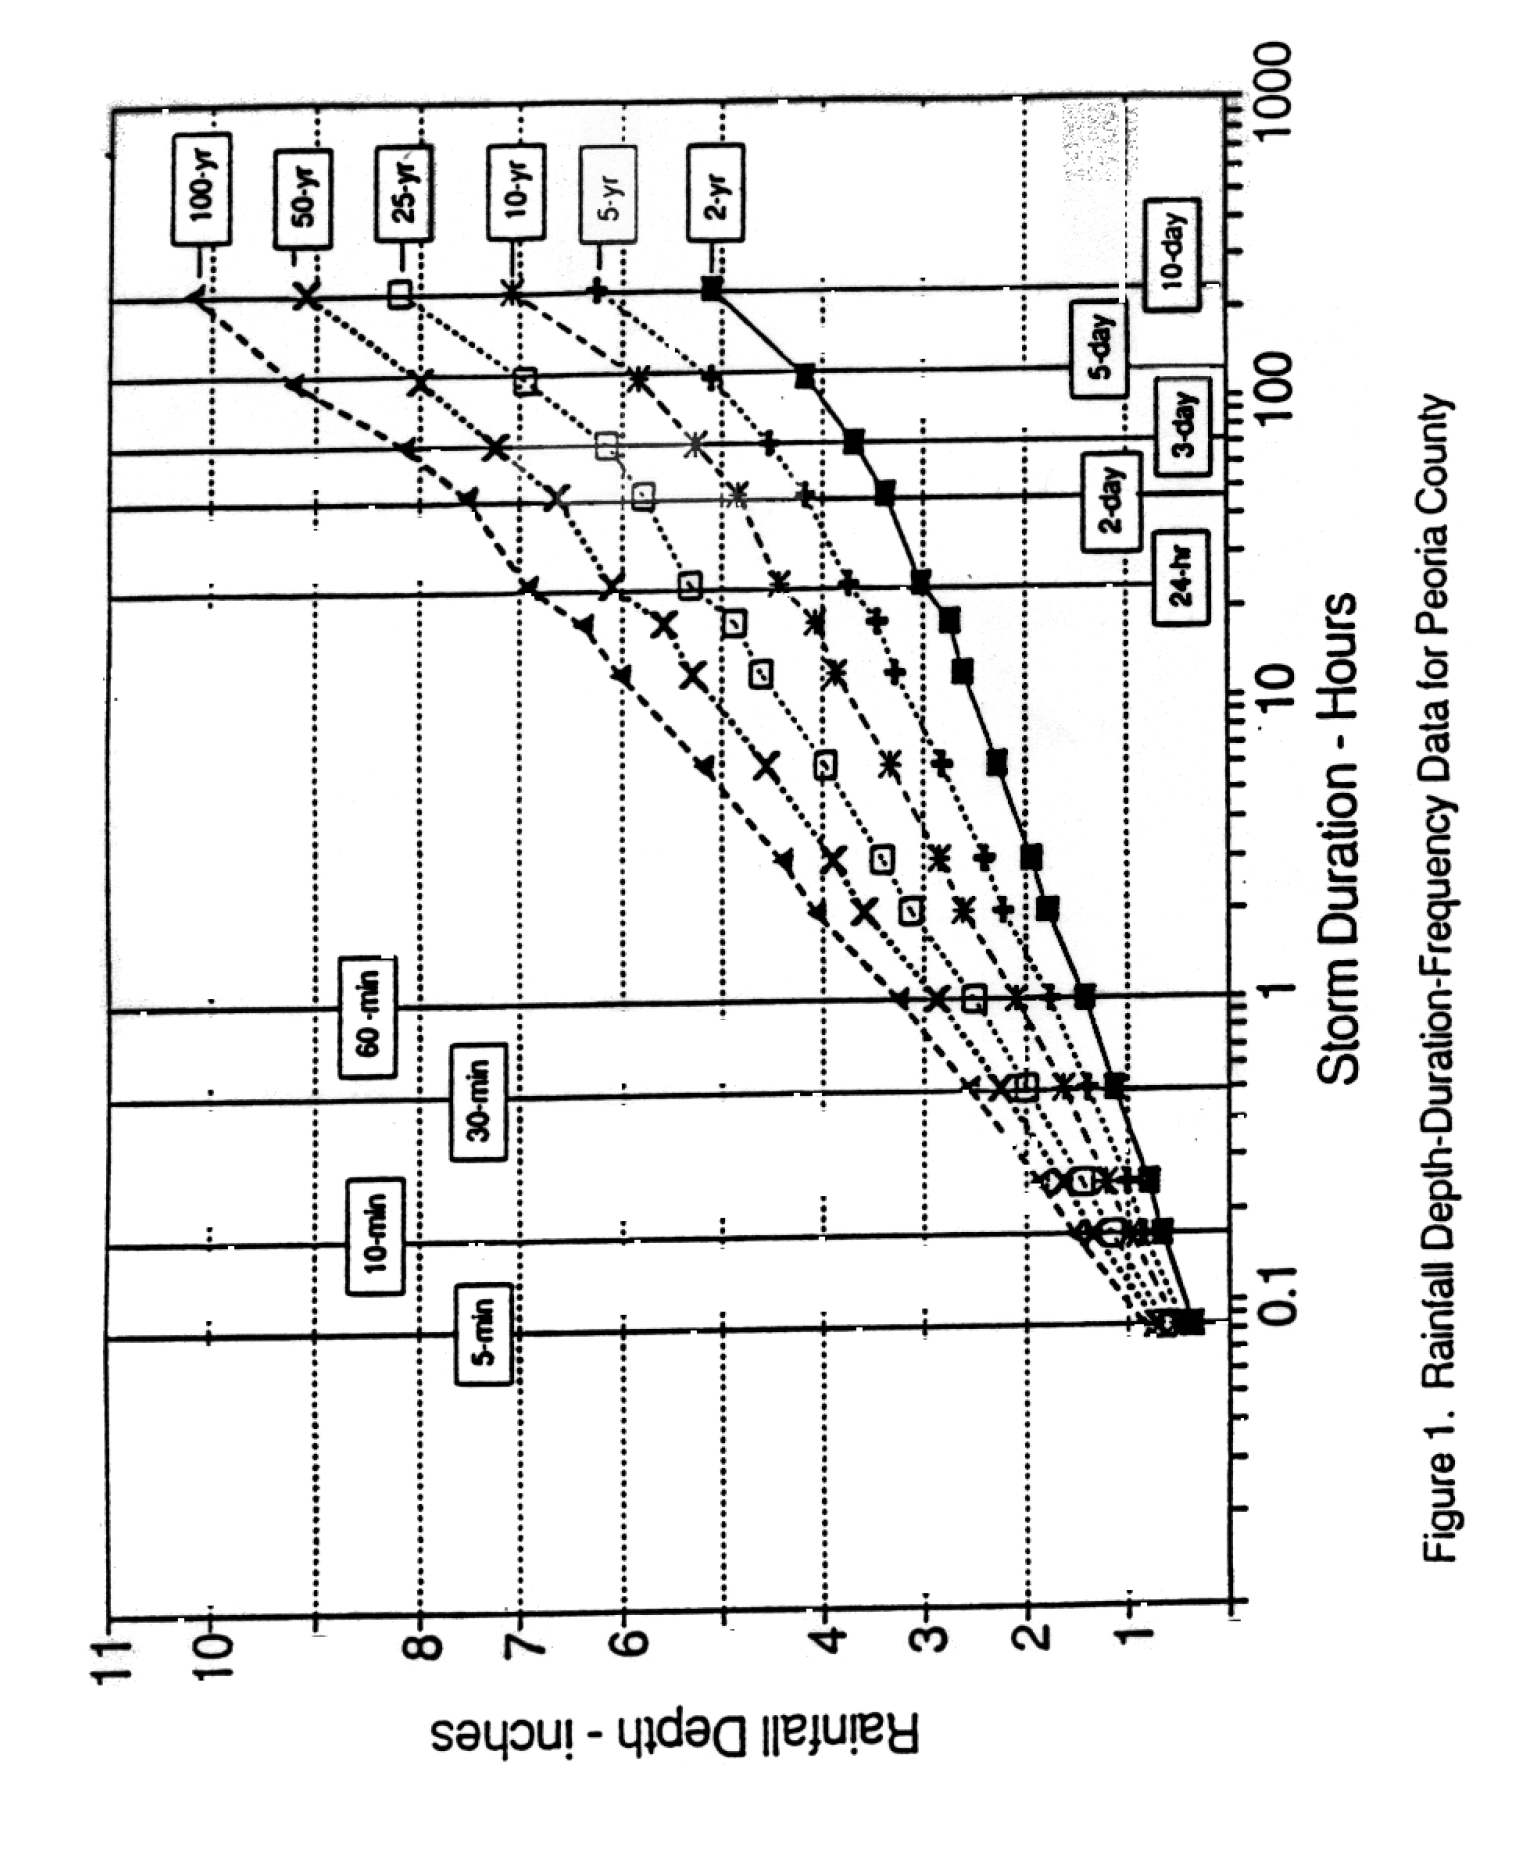
Source: ISWS/BLTL-70/89
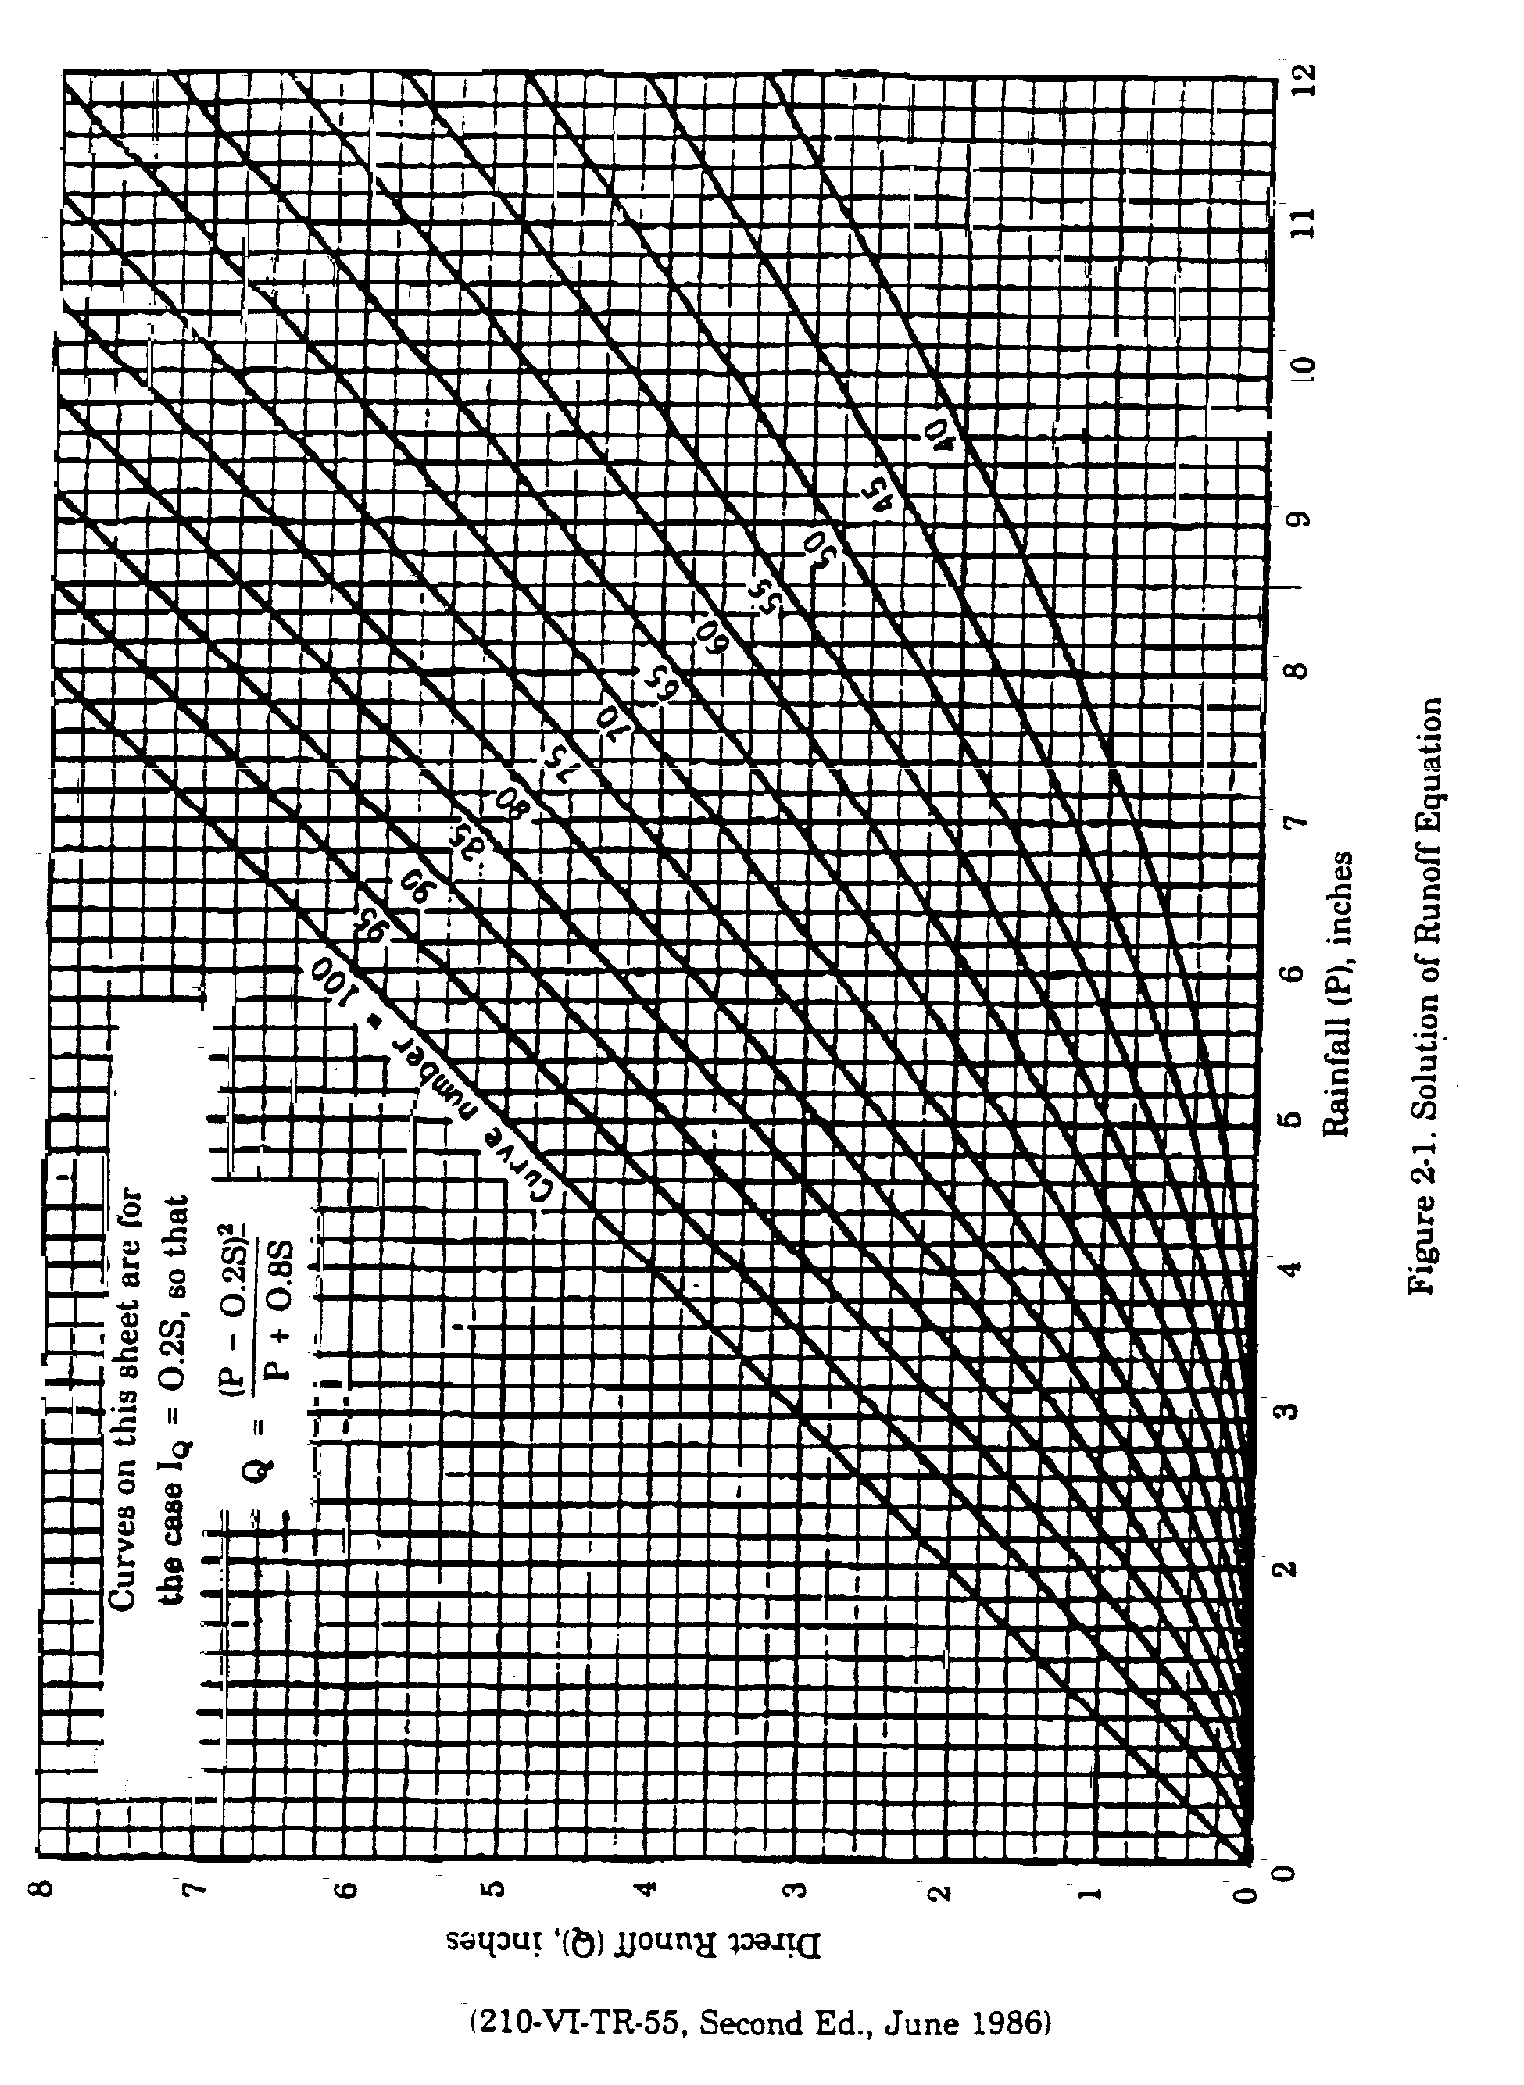
TABLE 2-2A
RUNOFF CURVE NUMBERS FOR URBAN AREAS1
| Cover Description | Curve Numbers for Hydrologic Soil Group | |||||
|---|---|---|---|---|---|---|
| Cover type and hydrologic condition |
Average percent
impervious area 2 | A | B | C | D | |
| Fully Developed Urban Area (vegetation established): | ||||||
| Open space (lawns, parks, golf courses, cemeteries, etc.): | ||||||
| Poor condition (grass cover < 50%) | 68 | 79 | 86 | 89 | ||
| Fair condition (grass cover 50% to 75%) | 49 | 69 | 79 | 84 | ||
| Good condition (grass cover > 75%) | 39 | 61 | 74 | 80 | ||
| Impervious areas: | ||||||
| Paved parking lots, roofs, driveways, etc. (excluding right-of-way) | 98 | 98 | 98 | 98 | ||
| Streets and roads: Paved; curbs and storm sewers (excluding right-of-way) | 98 | 98 | 98 | 98 | ||
| Paved; open ditches (including right-of-way) | 83 | 89 | 92 | 93 | ||
| Gravel (including right-of-way) | 76 | 85 | 89 | 91 | ||
| Dirt (including right-of-way) | 72 | 82 | 87 | 89 | ||
| Urban districts: | ||||||
| Commercial and business | 85 | 89 | 92 | 94 | 95 | |
| Industrial | 72 | 81 | 88 | 91 | 93 | |
| Residential districts by average lot size: | ||||||
| ⅛ acre or less (townhouses) | 65 | 77 | 85 | 90 | 92 | |
| ¼ acre | 38 | 61 | 75 | 83 | 87 | |
| ⅓ acre | 30 | 57 | 72 | 81 | 86 | |
| ½ acre | 25 | 54 | 70 | 80 | 85 | |
| 1 acre | 20 | 51 | 68 | 79 | 84 | |
| 2 acres | 12 | 46 | 65 | 77 | 82 | |
| Developing Urban Areas: | ||||||
| Newly graded areas (pervious areas only, no vegetation) | 77 | 86 | 91 | 94 | ||
|
1
Average runoff condition and 1
a
= 0.2S
2 The average percent impervious area shown was used to develop the composite CN's. Other assumptions are as follows: Impervious areas are directly connected to the drainage system, impervious areas have a CN of 98, and pervious areas are considered equivalent to open space in good hydrologic condition. CN's for other combinations of conditions may be computed using Figure 2-3 or 2-4 in TR 55. Source: SCS TR 55, 1986 | ||||||
TABLE 2-2B
RUNOFF CURVE NUMBERS FOR AGRICULTURAL LANDS1
| Cover Description |
Curve Numbers for
Hydrologic Soil Group | |||||
|---|---|---|---|---|---|---|
| Cover type | Treatment 2 |
Hydrologic
Condition 3 | A | B | C | D |
| Fallow | Bare Soil | — | 77 | 86 | 91 | 94 |
| Crop residue cover (CR) | Poor | 76 | 85 | 90 | 93 | |
| Good | 74 | 83 | 88 | 90 | ||
| Row Crops | Straight row (SR) | Poor | 72 | 81 | 88 | 91 |
| Good | 67 | 78 | 85 | 89 | ||
| SR + CR | Poor | 71 | 80 | 87 | 90 | |
| Good | 64 | 75 | 82 | 85 | ||
| Contoured (C) | Poor | 70 | 79 | 84 | 88 | |
| Good | 65 | 75 | 82 | 86 | ||
| C + CR | Poor | 69 | 78 | 83 | 87 | |
| Good | 64 | 74 | 81 | 85 | ||
| Contoured and terraced (C and T) | Poor | 66 | 74 | 80 | 82 | |
| Good | 62 | 71 | 78 | 81 | ||
| C and T + CR | Poor | 65 | 73 | 79 | 81 | |
| Good | 61 | 70 | 77 | 80 | ||
| Small Grain | SR | Poor | 65 | 76 | 84 | 88 |
| Good | 63 | 75 | 83 | 87 | ||
| SR + CR | Poor | 64 | 75 | 83 | 86 | |
| Good | 60 | 72 | 80 | 84 | ||
| C | Poor | 63 | 74 | 82 | 85 | |
| Good | 61 | 73 | 81 | 84 | ||
| C + CR | Poor | 62 | 73 | 81 | 84 | |
| Good | 60 | 72 | 80 | 83 | ||
| C and T | Poor | 61 | 72 | 79 | 82 | |
| Good | 59 | 70 | 78 | 81 | ||
| C and T + CR | Poor | 60 | 71 | 78 | 81 | |
| Good | 58 | 69 | 77 | 80 | ||
| Close-seeded or broadcast legumes or rotation meadow | SR | Poor | 66 | 77 | 85 | 89 |
| Good | 58 | 72 | 81 | 85 | ||
| C | Poor | 64 | 75 | 83 | 85 | |
| Good | 55 | 69 | 78 | 83 | ||
| C and T | Poor | 63 | 73 | 80 | 83 | |
| Good | 51 | 67 | 76 | 80 | ||
|
1
Average runoff condition and 1
a
= 0.2S.
2 Crop residue cover applies only if residue is on at least 5% of the surface throughout the year. 3 Hydrologic condition is based on combination of factors that affect infiltration and runoff, including (a) density and canopy of vegetative areas, (b) amount of year-round cover, (c) amount of grass or close-seeded legumes in rotations, (d) percent of residue cover on land surface (good ≥ 20%), and (e) degree of surface roughness. Poor: Factors impair infiltration and tend to increase runoff. Good: Factors encourage average and better than average infiltration and tend to decrease runoff. Source: SCS TR 55, 1986. | ||||||
TABLE 2-2C
RUNOFF CURVE NUMBERS FOR AGRICULTURAL LANDS1
| Cover Description |
Curve Numbers for
Hydrologic Soil Group | ||||
|---|---|---|---|---|---|
| Cover type |
Hydrologic
Condition 3 | A | B | C | D |
|
Pasture, grassland, or range—
Continuous forage for grazing 2 | Poor | 68 | 79 | 86 | 89 |
| Fair | 49 | 69 | 79 | 84 | |
| Good | 39 | 61 | 74 | 80 | |
| Meadow—Continuous grass, protected from grazing and generally mowed for hay | Poor | 30 | 58 | 71 | 78 |
| Brush—Brush-weed-grass mixture with brush the major element 3 | Poor | 48 | 67 | 77 | 83 |
| Fair | 35 | 56 | 70 | 77 | |
| Good | 30 4 | 48 | 65 | 73 | |
| Woods—Grass combination (orchard or tree farm) 5 | Poor | 57 | 73 | 82 | 86 |
| Fair | 43 | 65 | 76 | 82 | |
| Good | 32 | 58 | 72 | 79 | |
| Woods 6 | Poor | 45 | 66 | 77 | 83 |
| Fair | 36 | 60 | 73 | 79 | |
| Good | 30 4 | 55 | 70 | 77 | |
| Farmsteads—Buildings, lanes, driveways, and surrounding lots | Poor | 59 | 74 | 82 | 86 |
| 1 Average runoff condition and 1 a = 0.2S. | |||||
|
2
Poor: <50% ground cover or heavily grazed with no mulch.
Fair: 50 to 75% ground cover and not heavily grazed. Good: > 75% ground cover and lightly or only occasionally grazed. | |||||
|
3
Poor: <50% ground cover.
Fair: 50 to 75% ground cover. Good: > 75% ground cover. | |||||
| 4 Actual curve number is less than 30; use CN = 30 for runoff computations. | |||||
| 5 CN's shown were computed for areas with 50% woods and 50% grass (pasture) cover. Other combinations of conditions may be computed from the CN's for woods and pasture. | |||||
|
6
Poor: Forest litter, small trees, and brush are destroyed by heavy grazing or regular
burning
Fair: Woods are grazed but not burned, and some forest litter covers the soil Good: Woods are protected from grazing, and litter and brush adequately cover the soil. | |||||
| Source: SCS TR 55, 1986. | |||||
Computation sheet for 2-Stage Detention Basin Outlet Design
(to be used with TR 55 worksheet 6a or computer printout for storage routing)
| Project Name: _____ | Structure ID: _____ | Date: _____ |
Note: attach TR 55 worksheet 6a or computer printout with basin routing information
FIRST STAGE
Maximum stage for two-year storm (E 2-yr ) = _____ ft
First stage control elevation (E 1 ) = _____ ft
Head on first stage structure (H 2-yr = E 2-yr - E 1 ) _____ ft
Allowable discharge for two-year storm (q 2-yr ) = _____ cfs
For rectangular weir outlet:
Required weir length L 1 = q 2-yr /(3.2* H 2-yr 1.5 ) _____/(3.2* _____ 1.5 ) = _____ ft
For orifice outlet:
Required orifice area A 1 = q 2-yr /(4.98* H 2-yr 0.5 ) = _____/(4.98* _____ 0.5 ) = _____ sq ft
SECOND STAGE
Maximum stage for twenty-five-year storm (E 25-yr ) = _____ ft
Second stage control elevation (E 2 ) = _____ ft
Head on second stage structure (H 25-yr = E 25-yr - E 2 ) _____ ft
Allowable discharge for twenty-five-year storm (q 25-yr ) = _____ cfs
Twenty-five-year storm discharge through first stage:
Weir: q′ = 3.2 * L 1 * (E 25-yr - E 1 ) 1.5 = 3.2* _____ *(_____ - _____) 1.5 = _____ cfs
Orifice: q′ = 4.98 * A 1 * (E 25-yr - E 1 ) 0.5 = 4.98* _____ *(_____ - _____) 0.5 = _____ cfs
Allowable discharge through second stage (q″) q 25-yr - q' = _____ cfs
For rectangular weir outlet:
Required weir length L 2 = q″/(3.2* H 25-yr 1.5 ) = _____/(3.2* _____ 1.5 ) = _____ ft
For orifice outlet:
Required orifice area A 2 = q″/(4.98* H 25-yr 0.5 ) = _____/(4.98* _____ 0.5 ) = _____ sq ft
TABLE 3
SCS TYPE II RAINFALL DISTRIBUTION
|
Time
Hour | Fraction of Total | Fraction of Total Rainfall |
|---|---|---|
| 0.50 | 0.021 | 0.005 |
| 1.00 | 0.042 | 0.011 |
| 1.50 | 0.063 | 0.017 |
| 2.00 | 0.083 | 0.023 |
| 2.50 | 0.104 | 0.029 |
| 3.00 | 0.125 | 0.035 |
| 3.50 | 0.146 | 0.042 |
| 4.00 | 0.167 | 0.049 |
| 4.50 | 0.188 | 0.056 |
| 5.00 | 0.208 | 0.064 |
| 5.50 | 0.229 | 0.072 |
| 6.00 | 0.250 | 0.080 |
| 6.50 | 0.271 | 0.090 |
| 7.00 | 0.292 | 0.100 |
| 7.50 | 0.313 | 0.110 |
| 8.00 | 0.333 | 0.120 |
| 8.50 | 0.354 | 0.134 |
| 9.00 | 0.375 | 0.147 |
| 9.50 | 0.396 | 0.163 |
| 10.00 | 0.417 | 0.181 |
| 10.50 | 0.438 | 0.204 |
| 11.00 | 0.458 | 0.235 |
| 11.25 | 0.468 | 0.260 |
| 11.50 | 0.479 | 0.300 |
| 11.75 | 0.490 | 0.420 |
| 12.00 | 0.500 | 0.663 |
| 12.25 | 0.510 | 0.710 |
| 12.50 | 0.521 | 0.735 |
| 13.00 | 0.542 | 0.772 |
| 13.50 | 0.563 | 0.799 |
| 14.00 | 0.583 | 0.820 |
| 14.50 | 0.604 | 0.835 |
| 15.00 | 0.625 | 0.850 |
| 15.50 | 0.646 | 0.865 |
| 16.00 | 0.667 | 0.880 |
| 16.50 | 0.688 | 0.889 |
| 17.00 | 0.708 | 0.898 |
| 17.50 | 0.729 | 0.907 |
| 18.00 | 0.750 | 0.916 |
| 18.50 | 0.771 | 0.925 |
| 19.00 | 0.792 | 0.934 |
| 19.50 | 0.813 | 0.943 |
| 20.00 | 0.833 | 0.952 |
| 20.50 | 0.854 | 0.958 |
| 21.00 | 0.875 | 0.964 |
| 21.50 | 0.896 | 0.970 |
| 22.00 | 0.917 | 0.976 |
| 22.50 | 0.938 | 0.982 |
| 23.00 | 0.958 | 0.988 |
| 23.50 | 0.979 | 0.994 |
| 24.00 | 1.000 | 1.000 |