Rogers City Zoning Code
ARTICLE 7
DRAINAGE CRITERIA MANUAL
CHAPTER 1. SUBMITTAL REQUIREMENTS
CHAPTER 2. STORMWATER PLANNING
EXECUTIVE SUMMARY
CHAPTER 4. STREETS INLETS STORM SEWERS
See the PDF version of this Chapter.
CHAPTER 5. DETENTION
See the PDF version of this Chapter.
CHAPTER 6. OPEN CHANNEL FLOW
See the PDF version of this Chapter.
CHAPTER 7. BRIDGE AND CULVERT HYDRAULIC DESIGN
See the PDF version of this Chapter.
CHAPTER 8. CONSTRUCTION SITE STORMWATER MANAGEMENT
See the PDF version of this Chapter.
CHAPTER 9. WATER QUALITY
See the PDF version of this Chapter.
CHAPTER 10. CAVE SPRINGS DIRECT RECHARGE AREA WATER QUALITY PROTECTION REQUIREMENTS
See the PDF version of this Chapter.
APPENDIX
See the PDF version of this Chapter.
Purpose of the Chapter
The purpose of this Stormwater Planning chapter is to provide a summary of fundamental principles and guidelines that should be considered when planning an urban stormwater drainage system.
Chapter Summary
Benefits of Stormwater Planning – If drainage planning is incorporated into the initial stages of an urban design, the benefits that result from a well-planned storm drainage system are numerous and include improved functionality of the drainage system, reduced development costs, and improved building sites for residential and commercial development with increased opportunities to make the storm drainage system a development amenity.
Stormwater Planning Principles- Ten principles of stormwater drainage management are identified that provide the foundation of the design criteria discussed in this manual. These principles are based on sound engineering practices in combination with other planning considerations that are separate from drainage issues. These principles are summarized below:
- The primary stormwater planning objective is protection of human health, safety and welfare.
- A watershed approach for stormwater planning should be adopted because water resources are affected by all who conduct activities within a watershed and, therefore, all parties should be involved in the process to care for its water resources.
- Stormwater management planning should be compatible with other planning objectives including transportation, open space, recreation, and others.
- Flood control is primarily an issue of space allocation; if adequate provision is not made for drainage space requirements, stormwater runoff will conflict with other land uses and may result in damage to public and private property.
- Floodplains should be preserved wherever feasible and practical to maintain naturally occurring stormwater storage.
- Streams and riparian corridors should be maintained as they naturally occur to the maximum extent practical because buffer areas promote filtering of pollutants from urban runoff before it enters a stream.
- Every urban area has a minor and a major drainage system, whether or not they are actually planned or designed.
- Impacts of urbanization should be reduced through the use of Best Management Practices (BMPs).
- The stormwater drainage system should be designed for sustainability, with careful consideration given to the need for accessibility and maintenance.
- A stormwater drainage system should be designed beginning with the point of discharge, with careful consideration given to downstream impacts and the effects of off-site flows.
Major Drainage Planning- Major drainageways can consist of open channels or closed conduits. In general, use of open channels is strongly preferred to closed conduits. In cases where major drainageways already exist in a natural condition, they should generally be preserved, except where special measures are necessary. Primary Channels, as defined in Chapter 6 – Open Channel Flow Design of this Manual, will be the foundation of major drainageways. Primary channels must therefore be allotted adequate space for constructing channels to manage planned hydraulic activity and for providing channel maintenance and buffers. When planning new development and redevelopment, the designer must note the drainage patterns on the site and upstream to evaluate the need for implementing a primary channel as a part of the project. Typically, as mentioned earlier, major drainageways already exist in a natural condition. If that is the case on a project then preserving the area near and around the existing major drainageway is required as well as any improvements necessary to compensate for a planned project’s impact to the major drainageway.
Floodplain management and regulation is necessary for a government to exercise its duty to protect the health, safety, and welfare of the public. There are two floodplain management goals: 1) reduce the vulnerability of the residents in the City of Rogers to the danger and damage of floods, and 2) preserve and enhance the natural characteristics of the City’s floodplains. Part of the strategy to manage flood losses involves flood insurance; the City is a participant in the National Flood Insurance Program (NFIP), which is administered by the Federal Emergency Management Agency (FEMA). The planner and engineer should proceed cautiously when planning facilities on lands below the expected elevation of the 100-year flood. Maps that can be referenced to identify flood-prone areas in the City of Rogers include: 1) FEMA National Flood insurance Program Maps, and 2) City Flood Hazard Area maps. Refer to FEMA website (http://www.fema.gov/) and City GIS (http://gis.rogersar.gov/), respectively.
Minor Drainage Planning- The minor drainage system includes features such as street inlets, storm sewers, site drainage, on-site detention and on-site best management practices (BMPs). The objective of the site collection system is to completely collect, control, and convey the required design storm for specific street classifications (see Chapter 4 – Storm Sewer System Design) and protect properties adjacent to streets during runoff from storms up to the 100-year design flow.
The objective of street drainage design is to reasonably minimize inconvenience to the traveling public, provide for safe passage of emergency vehicles during runoff from storms up to a 100-year event, and prevent damage to property and structures due to overflow of runoff from streets onto private property during runoff from storms up to a 100-year event.
Detention for flood control is designed to prevent increases in peak flow from the 1-, 2-, 5-, 10-, 25-, 50- and 100-year storms. Onsite detention shall be located at the low point(s) on the site and discharge to a public right-of-way or drainage easement unless otherwise approved by the City.
Storm water quality BMPs are required on all developments to reduce adverse impacts on downstream water quality and to meet the requirements of the City’s federally-mandated National Pollutant Discharge Elimination System (NPDES) Municipal Separate Storm Sewer (MS4) permit.
Transportation Planning - Developments near major transportation features and facilities, such as highways and railroads, should include a careful evaluation of the effects caused by any storm water conduits or structures related to the transportation facility. Many flooding problems can be created by bottlenecks of conduits under transportation-related structures, particularly by those that are older or inadequate. Conversely, removing such structures may also create downstream flooding problems.
Open Space Planning - Floodplains often serve as excellent locations for community or neighborhood open space, particularly since periodic flooding in these areas makes many types of developments unfeasible. While leaving floodplains open reduces the flood risk to a community, it also serves multiple other purposes, such as enhancement of water quality and habitat, and provides space for the creation of greenway trails and other recreational uses.
In order to encourage developers to not develop all or portions of a floodplain on their project the City has compiled a list of incentives to be considered by the City during rezone or site development applications. The magnitude and combination of how these incentives are used is at the City’s discretion (see Table SWP-1). The list of incentives is as follows:
- The City could take deed of the undeveloped floodplain. This would move the maintenance and tax burdens attributed to the floodplain off the owner/developer and place that responsibility onto the City. Furthermore, areas to be deeded to the City shall still count towards greenspace requirements.
- A reduction in the amount of green space required on the site could be allowed. This reduction in green space would in turn provide more useable space to develop.
- For residential projects, increased density could be provided.
- A reduction in the amount of road improvements required by City ordinance could be allowed.
- Requirements established for water quality standards in Chapter 9 – Water Quality could be met by including the undeveloped floodplain area as a water quality BMP (such as vegetated filter strip) and assign credit based on how much and in what manner the floodplain is preserved.
Permitting - Common permits related to stormwater runoff are summarized and include: Site Development Plan, Preliminary Plat (City), Land Disturbance Permit (City), General Permit for Stormwater Discharges Associated with Construction Activity (DEQ), the Section 404 Permit (USACE), and Conditional Letter of Map Revision (CLOMR) and/or Letter of Map Revision (LOMR) (FEMA) as required.
Development Review Process - All Site Development Plans, Subdivision Plans (Preliminary and Final Plats) and any projects that greatly impact the City of Rogers must go through the Development Working Group (DWG) review process. To become familiar with the development approval process, and to understand the development review schedule, refer to the City of Rogers Department of Community Development’s web page that provides the current review schedule. (See link: https://www.rogersar.gov/1158/Community-Development).
1.0 INTRODUCTION
Planning of the urban storm drainage system is an integral part of urban design. A well-planned urban drainage system is critical for the overall effectiveness of flood control and water quality measures. Furthermore, the drainage system is a central component of a plan that best utilizes a property and considers the natural drainage.
Planning of urban drainage facilities should be based upon integrating natural waterways, artificial channels, storm sewers, and other drainage works into the layout of a desirable, aesthetic, and environmentally-sensitive urban community. It is imperative that runoff and drainage patterns be considered early in the design process for new developments, before site layout begins, rather than attempting to superimpose drainage works on a development after it is laid out, as is frequently done with water supply and sanitary sewer facilities. A well-planned major drainage system can reduce or eliminate the need for costly underground storm sewers, and it can provide improved protection from property damage, injury, and loss of life caused by flooding.
In addition to involving drainage engineering, planning for the management of urban runoff requires a comprehensive understanding of city planning and the many social, technical, and environmental issues associated with each watershed. Therefore, the drainage engineer should serve as one member of the urban design team and should be included in the earliest stages of the urban planning process.
2.0 STORMWATER DRAINAGE PRINCIPLES
Planning and development of stormwater drainage systems must be guided by a set of underlying principles that are based on sound engineering practice in combination with other community objectives. Key principles that serve as the foundation of the design criteria provided in this manual are described below.
3.0 MAJOR DRAINAGE PLANNING
Major drainageways can consist of open channels or closed conduits. In general, use of open channels is strongly preferred to closed conduits. Primary Channels, as defined in Chapter 6 – Open Channel Flow Design of this Manual, will be the foundation of major drainageways. Open channels can include stabilized natural waterways, modified natural channels, or artificial channels with grass or other lining. Closed conduits include structures such as box culverts and large pipes.
In cases where major drainageways already exist in a natural condition, they should generally be preserved, except where any engineered improvements, such as grade control, erosion protection, or restoration, are needed. The practice of lining, straightening, narrowing, and filling major natural waterways is strongly discouraged, whether the channel is perennial (wet) or ephemeral (dry except for storm runoff). In contrast, the practice of preserving natural waterways is highly encouraged because it generally provides benefits in terms of preserving natural floodplain storage, reduction of channel erosion, water quality enhancement, preservation of habitat, and opportunities for parks, greenway trails, and other recreational uses.
Important planning-level considerations for initial major drainage planning, open channels, and floodplain regulation are discussed in Section 3.1 through Section 3.3, respectively. Detailed design criteria are not provided in this chapter but are provided, where applicable, in other chapters as noted in the text.
4.0 MINOR DRAINAGE PLANNING
In addition to addressing major drainages, effective drainage planning also requires thorough attention to the initial or minor drainage system. The minor drainage system includes features such as street inlets, storm sewers, site drainage, on-site detention and on-site best management practices (BMPs). This section provides planning-level considerations for the minor drainage system and also provides references to chapters in this Manual that have detailed design criteria for specific minor drainage features.
5.0 TRANSPORTATION PLANNING
Developments near major transportation features and facilities, such as highways and railroads, should include a careful evaluation of the effects caused by any storm water conduits or structures related to the transportation facility. Many flooding problems can be created by bottlenecks of conduits under transportation-related structures, particularly by those that are older or inadequate. For example, culverts at highway or railroad embankments can cause drainage hazards such as excessive flooding upstream of the culvert or, alternatively, can cause excessive flow velocity and erosion downstream of the culvert.
Many storm drainage problems can be avoided through cooperation and coordination between the developer or transportation agency and the local governing authority over the drainage system. Drainage conditions at transportation facilities should be investigated early in the planning process to determine what limitations exist or what costs might be required to address the situation. Furthermore, it must be shown that any improvements to an existing drainage system won’t create downstream flooding. This situation could occur when replacing historically inadequate crossings with larger crossings, where the original crossing effectively detained upstream runoff and after the improvements the runoff is now allowed to travel downstream more quickly. Proposals for new developments or improvements by transportation agencies should be closely coordinated with the City to identify drainage issues, potential problems, and requirements and incorporation of watershed planning objectives.
6.0 OPEN SPACE PLANNING
Floodplains often serve as excellent locations for community or neighborhood open space, particularly since periodic flooding in these areas makes many types of developments unfeasible. While leaving floodplains open reduces the flood risk to a community, it also serves multiple other purposes, such as enhancement of water quality and habitat, and provides space for the creation of greenway trails and other recreational uses.
The area adjacent to floodplains may be appropriate for a broader riparian and buffer corridor, larger scale recreational uses, or parks. The designer of new developments should consider these options for floodplains and consult the City for any watershed plans that address land use along floodplains or Master Trail plans.
7.0 REQUIRED PERMITS
Planning for any new development must consider the need for city, county, state, and federal permits early in the planning process. This is particularly important when the development will involve construction along a major drainageway. Common permits related to stormwater runoff are listed below:
- Site Development Plan, Preliminary Plat – A preliminary plan set designed to meet the requirements of the City of Rogers development ordinances. An approved Preliminary Plat is required prior to obtaining a Land Disturbance Permit (see below).
- Land Disturbance Permit – The City requires any project/site that involves a SDP approval or a Preliminary Plat to obtain a Land Disturbance Permit prior to commencement of earthwork at a project site or before more than 1 acre is disturbed. A Land Disturbance Permit will be issued by the City of Rogers only after approval of the SDP or Preliminary Plat.
- General Permit for stormwater discharges associated with construction activity – The Arkansas Department of Energy & Environment Division of Environmental Quality (DEQ) requires a permit to allow discharges of stormwater from construction sites in cases where those discharges enter surface waters of the State or a municipal separate storm sewer system (MS4) leading to surface waters of the State subject to the conditions set forth in the permit. The general permit that became effective on July 1, 2024 replaces the permit issued in 2019. The reader is encouraged to either contact DEQ or review the permit requirements on the DEQ website (http://www.adeq.state.ar.us/). Careful review of the general permit is necessary to understand which stormwater discharges are allowed under the coverage of the general permit and which are not.
- Section 404 Permit - Section 404 of the Clean Water Act requires approval from the U.S. Army Corps of Engineers (USACE) prior to discharging dredged or fill material into the “Waters of the U.S.” Waters of the U.S. include essentially all surface waters, such as all navigable waters and their tributaries, all interstate waters and their tributaries, all wetlands adjacent to these waters, and all impoundments of these waters. Any waterway with a permanent flow of water is generally considered a Water of the U.S. Some intermittent waterways also may be considered Waters of the U.S.
Wetlands are areas characterized by growth of wetland vegetation (e.g., bulrushes, cattails, rushes, sedges, willows, etc.) where the soil is saturated during a portion of the growing season or the surface is flooded during part of most years. Wetlands generally include swamps, marshes, bogs, and similar areas.
Typical activities within Waters of the U.S. and adjacent wetlands that require Section 404 permits are:
- Site development fill for residential, commercial, or recreational construction
- Construction of in-channel structures
- Placement of riprap
- Construction of roads
- Construction of dams
- Any grading within the channel of Waters of the U.S.
When activities of this type are proposed, the developer should contact the USACE to determine if a Section 404 Permit will be required and to identify major issues involved in obtaining the permit. The City of Rogers is located in the Little Rock District of the USACE.
Because Rogers is located in Benton County, any work considered to be covered under one of the several Nationwide Permits authorized by the USACE still requires the submittal of an “APPLICATION FOR DEPARTMENT OF THE ARMY PERMIT – 33 CFR 325”. Additional requirements needed to complete this permit include, but are not limited to, the following:
- Historic Preservation – evidence must be provided that a project is not going to adversely impact protected historic landmarks. The Arkansas Historic Preservation Program shall be contacted in regards to providing guidance and evidence as to whether a proposed project will or will not adversely impact protected historic landmarks.
- Endangered Species Protection – evidence must be provided that a project is not going to adversely impact protected threatened and endangered species. The US Fish and Wildlife, Arkansas Field Office shall be contacted in regards to providing guidance and evidence as to whether a proposed project will or will not adversely impact threatened or endangered species.
Floodplain Use Permit (if required) – Development requirements and restrictions in Special Flood Hazard Areas in the City of Rogers are described in Chapter 22 of the Code of Ordinances for the City of Rogers. If development is to occur within a FEMA regulatory floodplain, a floodplain use permit must be obtained from the City. In addition, if necessary, additional floodplain requirements, such as a Conditional Letter of Map Revision (CLOMR) or Letter of Map Revision (LOMR) must be obtained through FEMA or a “No Rise Certification” (for floodways) must be obtained through the City.
8.0 DEVELOPMENT REVIEW PROCESS
All Site Development Plans, Subdivision Plans (Preliminary and Final Plats) and any projects that greatly impact the City of Rogers must go through the Development Working Group (DWG) review process. To become familiar with the development approval process in the City of Rogers, and to understand the development review schedule, refer to the City of Rogers Community Development Department’s web page which provides the current review schedule. (See link: https://www.rogersar.gov/1158/Community-Development).
9.0 REFERENCES
American Society of Civil Engineers and Water Environment Federation. 1992. Design and Construction of Urban Stormwater Management Systems. ASCE Manual and Reports of Engineering Practice No. 77 and WEF Manual of Practice FD-20. Alexandria,VA: Water Environment Federation.
City of Rogers, Arkansas, 2009. Code of Ordinances. http://library.municode.com/index.aspx?clientId=14712&stateId=4&stateName=Arkansas
City of Rogers, Arkansas, 2009. Ordinance No. 08-33. An Ordinance Amending the Code of Ordinances, City of Rogers, Arkansas Concerning Grading, Erosion Control, Stormwater Pollution Prevention, and Tree Preservation.
FEMA 2009. FEMA Map Service Center website: http://msc.fema.gov/webapp/wcs/stores/servlet /FemaWelcomeView?storeId=10001&catalogId=10001&langId=-1.
Leopold, L.B. 1994. A View of the River. Cambridge, MA: Harvard University Press.
Urban Drainage and Flood Control District. 2001. Urban Storm Drainage Criteria Manual, Volume 1. Denver, CO: Urban Drainage and Flood Control District.
Urbonas, B. 1980. Drainageway Erosion in Semi-arid Urbanizing Areas. Flood Hazard News 10:1-2, 8.
Watershed Conservation Resource Center. 2009. Sediment and Nutrient Evaluation of Blossom Way Branch. Rogers, AR: Watershed Conservation Resource Center
Water Environment Federation and American Society of Civil Engineers. 1998. Urban Runoff Quality Management. WEF Manual of Practice No. 23 and ASCE Manual and Report on Engineering Practice No. 87. Alexandria, VA: Water Environment Federation.
1. OVERVIEW
This section of the Manual on the determination of storm water runoff was developed using several references including: Urban Storm Drainage Criteria Manual developed by Urban Drainage and Flood Control District in Denver, Colorado; National Engineering Handbook, Section 4 (NEH-4), 1985; NRCS Technical Paper No. 40, 1961; and NRCS Technical Release No. 55, 1986. Detailed information for all references used in this section can be found at the end of this chapter.
2. RATIONAL METHOD
For urban watersheds that are not complex and are generally 30 acres or less in size, it is acceptable that the design storm runoff be analyzed by the Rational Method. If properly understood and applied, the Rational Method can produce satisfactory results for the design of urban storm sewers and small on-site detention facilities.
3. SCS Curve Number Method
The Soil Conservation Service Technical Release – 55 Synthetic Hydrograph Method (SCS method) is a synthetic hydrograph method developed specifically for use in urbanized and urbanizing areas. This method is useful in analyzing watersheds involving several subareas with complex runoff patterns. The method is most useful in analyzing changes in runoff volume due to development and in the evaluation and design of runoff control measures. The SCS method as described herein shall be used in all cases where the watershed being developed is characterized by complex runoff patterns and site conditions and/or is larger than 30 acres and less than 2000 acres. Complex runoff patterns and site conditions are characterized as areas with continually transitioning surface types, a collection of different flow types, numerous obstructions interfering with the runoff’s direction and flow type, etc. When a watershed is observed to contain two or more distinct interacting sub-basins consistent with the conditions as dictated above then the watershed is considered complex. This method is similar to the Rational Method in that runoff is directly related to rainfall amounts through use of runoff curve numbers (CNs). The SCS method is explained in greater detail in the National Engineering Handbook, Section 4 (NEH-4), “Hydrology” (SCS 1985).
4.0 REFERENCES
Bedient, Philip B. and Wayne C. Huber. 2002. Hydrology and Floodplain Analysis, Third Edition. Upper Saddle River, NJ ; Prentice Hall
Debo, T.N. and A.J. Reese. 2002. Municipal Storm water Management, Second Edition. Washington, D.C.; Lewis Publishers.
Engman, E.T. 1986. Roughness coefficients for routing surface runoff. Journal of Irrigation and Drainage Engineering 112 (1): 39-53.
Federal Aviation Administration, Department of Transportation. 1970. Airport Drainage. AC No. 150/5320-5B.
Hodge, Scott A. and Gary D. Tasker. 1995. Magnitude and Frequency of Floods in Arkansas. USGS – Water-Resource Investigations Report 95-4224. Little Rock, AR: U.S. Geological Survey (in cooperation with Arkansas State Highway and Transportation Department).
Overton, D.E. and M.E. Meadows. 1976. Storm water modeling. Academic Press. New York, NY. p. 58-88.
United States Army Corps of Engineers (USACE). 2000. Hydrologic Modeling System, HEC-HMS, Technical Reference Manual. Davis, CA: USACE Hydrologic Engineering Center.
United States Department of Agriculture Natural Resource Conservation Service (USDA NRCS). 1961. Rainfall Frequency Atlas of the United States for Duration from 30 Minutes to 24 Hours and Return Periods from 1 to 100 Years. Technical Paper No. 40, Washington, D.C.: USDA.
United States Department of Agriculture Natural Resource Conservation Service (USDA NRCS). 1986. Urban Hydrology for Small Watersheds. Technical Release No. 55, Washington, D.C.: USDA.
United States Department of Agriculture Soil Conservation Service (USDA SCS). 1966. Section 4, Hydrology, National Engineering Handbook. Washington, D.C.: USDA.
United States Department of Agriculture Soil Conservation Service (USDA SCS). 1986. TR-20 Computer Program for Project Formulation Hydrology. Technical Release No. 20, revised by the Hydrology Unit and Technology Development Support Staff, SCS, February 1992 (originally developed 1964). Washington, D.C.: USDA.
Urban Drainage and Flood Control District. 2001 (Revised 2006). Urban Storm Drainage – Criteria Manual (Volume 1). Denver, CO: UDFCD
2. APPLICABILITY
The stormwater detention requirements outlined in this chapter apply to all new developments and redevelopments.
For sites that are smaller than 1 acre, or for sites that are being redeveloped, the City may allow the property owner to pay a fee in-lieu-of implementing the detention measures described in this chapter. The fee-in-lieu option is discussed further in Section 3.1.
3. STORMWATER DETENTION DESIGN OBJECTIVES
The primary objectives of the City’s stormwater detention requirements are described below:
- Post-project peak flow rates must not exceed pre-project conditions - Onsite detention facilities must be designed so that peak flow rates for post-project conditions are limited to pre-project levels. To maintain peak flow rates at pre-development levels, a multi-frequency outlet design approach is required. The designer must demonstrate that the 1-, 2-, 5- 10-, 25-, 50- and 100-year post-development peak flow rates are limited to the corresponding pre-development flow rates. Surface flows must also be limited to 1 cfs when entering the right-of-way for the design storm unless approved by the City Engineer. If the detention facility is also being used to provide water quality treatment, then the calculated WQCV for the facility (see Chapter 9 – Water Quality) must be added to the 100-year storage volume of the facility.
- Detain and discharge the post-development 100-year runoff – The onsite runoff from the 100-year event must be detained for a period of at least 24 hours following the peak. Wet retention ponds must detain the 100-year event’s runoff for period of at least 12 hours following the peak. All stormwater facilities must be discharged within 72 hours after the peak of the rain event.
- Low-flow orifice - Detention basin designs must include a low-flow orifice designed to discharge at the 1-year peak flow rate. The low-flow orifice must be a minimum of 2 inches in diameter to reduce the potential for plugging.
- Spillways must be designed to convey 100-year runoff - Overflow spillways for detention facilities must permit the passage of the runoff from the 100-year event, based on fully urbanized conditions for the entire tributary watershed with no upstream detention. A freeboard of 1 foot must be provided for the 100-year event design flows. If downstream safety considerations warrant, it may be necessary to size a spillway for greater than a 100-year event.
These criteria for peak flow attenuation apply for onsite facilities unless other rates are recommended in a City-approved master plan. As a result of these requirements, three conditions must be examined for determination of attenuation requirements for onsite facilities:
- Pre-project conditions
- Post-project conditions
- Fully urbanized conditions for the entire tributary watershed with no upstream detention.
8. REFERENCES
American Society of Civil Engineers and the Water Environment Federation (ASCE and WEF). 1992. Design and Construction of Urban Storm water Management Systems. New York: American Society of Civil Engineers and the Water Environment Federation.
Brater, E.F. and King, H.W. 1976. Handbook of Hydraulics for the Solution of Hydraulic Engineering Problems. New York: McGraw-Hill.
Debo, T. N. and A.J. Reese. 2003. Municipal Storm Water Management. Second Edition. New York: Lewis Publishers.
Federal Aviation Administration (FAA). 1966. Airport Drainage. Washington, DC: Federal Aviation Administration.
Guo, J.C.Y. 1999a. Detention Storage Volume for Small Urban Catchments. Journal of Water Resources Planning and Management, 125(6): 380-384.
Guo, J.C.Y. 1999b. Storm Water System Design. Denver, CO: University of Colorado at Denver.
Hwang, N.H.C. and R.J. Houghtalen. 1996. Fundamentals of Hydraulic Engineering Systems. Third Edition. New Jersey: Prentice Hall.
2. OPEN CHANNEL DESIGN PRINCIPLES
This section is intended to provide the designer with information necessary to perform open channel hydraulic analysis related to channel geometry, channel lining, and flow characteristics. This section includes preliminary design criteria and identifies considerations in selection of channel type.
3. OPEN-CHANNEL DESIGN CRITERIA
The purpose of this section is to provide design criteria for open channels, including grass-lined channels, composite channels, concrete-lined channels, riprap-lined channels, bioengineered channels, and natural channels. Open-channel hydraulic principles summarized in Section 2.0 can be applied using these design criteria to determine channel geometry and hydraulics.
4. REFERENCES
American Society of Civil Engineers (ASCE). 1975. Sedimentation Engineering. American Society of Civil Engineers Manuals and Reports on Engineering Practice No. 54. New York: ASCE.
American Society of Civil Engineers and Water Environment Federation (ASCE and WEF). 1992. Design and Construction of Urban Stormwater Management Systems. American Society of Civil Engineers Manuals and Reports of Engineering Practice No. 77 and Water Environment Federation Manual of Practice FD-20. New York: American Society of Civil Engineers.
Barnes, H.H. Jr. 1967. Roughness Characteristics of Natural Channels. Geological Survey Water-Supply Paper 1849. Washington, D.C.: U.S. Government Printing Office.
Bedient, Philip B. and Wayne C. Huber. 2002. Hydrology and Floodplain Analysis, Third Edition. Upper Saddle River, NJ ; Prentice Hall
Biedenharn, D.S., C.M. Elliot, and C.C. Watson. 1997. The WES Stream Investigation and Streambank Stabilization Handbook. Vicksburg, MS: U.S. Army Corps of Engineers, Waterways Experiment Station.
Bohan, J.P. 1970 Erosion and Riprap Requirements at Culverts and Storm Drain Outlets. WES Research Report H-70-2. Vicksburg, MS: U.S. Army Corps of Engineers, Waterways Experiment Station.
Calhoun, C.C., J.R. Compton, and W.E. Strohm. 1971. Performance of Plastic Filter Cloth as Replacement for Granular Filter Materials, Highway Research Record No. 373, pp. 74–85. Washington, D.C.: Highway Research Board.
Chow, V.T. 1959. Open-Channel Hydraulics. New York: McGraw-Hill Book Company.
Daugherty, R.L. and J.B. Franzini. 1977. Fluid Mechanics with Engineering Applications. New York: McGraw Hill.
Denver Regional Council of Governments (DRCOG). 1983 Urban Runoff Quality in the Denver Region. Denver, CO: Denver Regional Council of Governments.
Fletcher, B.P. and J.L. Grace. 1972. Practical Guidance for Estimating and Controlling Erosion at Culvert Outlets, WES Miscellaneous Paper H-72-5. Vicksburg, MS: U.S. Army Corps of Engineers, Waterways Experiment Station.
Fortier, S. and F.C. Scobey. 1926. Permissible Canal Velocities. Transactions of the American Society of Civil Engineers, Volume 89, pp. 940-956.
Guo, J. 1999. Roll Waves in High Gradient Channels. Journal of Water International 24(1)65-69.
Hipschman, R.A. 1970. Erosion Protection for the Outlet of Small and Medium Culverts. Master Thesis, Civil Engineering Department, South Dakota State University.
King, H.W. and E.F. Brater. 1963. Handbook of Hydraulics for the Solution of Hydrostatic and Fluid-Flow Problems. New York: McGraw-Hill.
Lane, E.W. 1952. Progress Report on Results of Studies on Design of Stable Channels. Hyd-352. Denver, CO: Department of Interior, Bureau of Reclamation.
Lane, E.W. 1953. Progress Report on Studies on the Design of Stable Channels by the Bureau of Reclamation. Proceedings of the American Society of Civil Engineers. Volume 79. Separate No. 280, pp. 1-31. 1953.
Lane, E.W. 1955a. Design of Stable Channels. Transactions of the American Society of Civil Engineers, Volume 120, pp. 1234–1260.
Lane, E.W. 1955b. The Importance of Fluvial Morphology in Hydraulic Engineering. Proceedings of the American Society of Civil Engineers.
Leopold, L.B. 1994. A View of the River. Cambridge, MA: Harvard University Press.
Leopold, L.B. and T. Maddock Jr. 1953. The Hydraulic Geometry of Stream Channels and Some Physiographic Implications. Washington, DC: U.S. Geological Survey.
Maricopa County. 2000. Drainage Design Manual for Maricopa County. Phoenix, AZ: Maricopa County, Arizona.
Murphy, T.E. 1971. Control of Scour at Hydraulic Structures, WES Miscellaneous Paper H–71–5. Vicksburg, MS: U.S. Army Corps of Engineers, Waterways Experiment Station.
Posey, C.J. 1960. Flood Erosion Protection for Highway Fills. Bulletin No. 13. Ames, IA: Iowa Highway Research Board.
Rhoads, B.L. 1995. Stream Power: A Unifying Theme for Urban Fluvial Geomorphology. In Stormwater runoff and Receiving Systems, E.E. Herricks, ed. Boca Raton, FL: CRC Press.
Riley, A.L. 1998. Restoring Streams in Cities: A Guide for Planners, Policymakers, and Citizens. Washington, D.C.: Island Press. Washington.
Rosgen, D. 1996. Applied River Morphology. Pagosa Springs, CO: Wildland Hydrology.
Schiechtl, H. 1980. Bioengineering for Land Reclamation and Conservation. Edmonton, Alberta: University of Alberta Press.
Simons, D.B. 1957. Theory and Design of Stable Channels in Alluvial Materials. Ph.D. dissertation, Colorado State University. Fort Collins, CO.
Simons, D.B. and F. Senturk. 1992. Sediment Transport Technology. Littleton, CO: Water Publications.
Smith, C. D. 1975. Cobble Lined Structures. Canadian Journal of Civil Engineering, Volume 2.
Smith, C.D. 1974. Hydraulic Structures. Saskatoon, SK: University of Saskatchewan Printing Services.
Stevens, M.A., D.B. Simons, and F.J. Watts. 1971. Riprapped Basins for Culvert Outfalls. Highway Research Record No. 373. Washington, D.C.: Highway Research Service.
Stevens, M.A., D.B. Simons, and G.L. Lewis. 1976. Safety Factors for Riprap Protection. Journal of the Hydraulics Division 102 (5) 637–655.
Urban Drainage and Flood Control District (District). 1982. Communications between Dr. Michael A. Stevens and District staff.
———. 1984. Guidelines for Development and Maintenance of Natural Vegetation. Denver, CO: Urban Drainage and Flood Control District.
———. 1986. Comparison of Measured Sedimentation With Predicted Sediment Loads. Technical Memorandum in response to District Agreement No. 85–02.078 from WRC Engineering, Inc., to the Urban Drainage and Flood Control District. Denver, CO: Urban Drainage and Flood Control District.
U.S. Army Corps of Engineers (USACE). 1970. Hydraulics Design of Flood Control Channels. USACE Design Manual EM 1110–2–1601. U.S. Army Corps of Engineers.
———. 1991. HEC-2, Water Surface Profiles, User's Manual. Davis, CA: Army Corps of Engineers Hydrologic Engineering Center.
———. 1995. HEC-RAS, River Analysis System, User's Manual. Davis, CA: Army Corps of Engineers Hydrologic Engineering Center.
U.S. Bureau of Reclamation (USBR). 1984. Computing Degradation and Local Scour. Washington, DC: Bureau of Reclamation.
U.S. Environmental Protection Agency (USEPA). 1983. Results of the Nationwide Urban Runoff Program: Final Report. Washington D.C.: U.S. Environmental Protection Agency.
U.S. Federal Interagency Stream Restoration Working Group (USFISRWG). 1998. Stream Corridor Restoration: Principles, Processes, and Practices. Washington, DC: U.S. Federal Interagency Stream Restoration Working Group.
Vallentine, H. R. and B.A. Cornish. 1962. Culverts with Outlet Scour Control. University of New South Report No. 62. Sydney, Australia: Wales, Water Research Laboratory.
Watson, C.C., D.S. Biedenharn, and S.H. Scott. 1999. Channel Rehabilitation: Process, Design, and Implementation. Washington, D.C.: Environmental Protection Agency.
Yang, C.T. 1996. Sediment Transport: Theory and Practice. New York: The McGraw-Hill.
Executive summary
1. CULVERTS INTRODUCTION AND OVERVIEW
The function of a culvert is to convey surface water under a roadway, railroad, trail, or other embankment. In addition to the hydraulic function, the culvert must carry construction, highway, railroad, or other traffic and earth loads. Therefore, culvert design involves both hydraulic and structural design considerations. The hydraulic aspects of culvert design are set forth in this chapter.
Culverts are available in a variety of sizes, shapes, and materials. These factors, along with several others, affect their capacity and overall performance. Sizes and shapes may vary from small circular corrugated metal pipes to large concrete box sections that are sometimes used in lieu of bridges.
A careful approach to culvert design is essential, both in new land development and retrofit situations, because culverts often significantly influence upstream and downstream flood risks, floodplain management and public safety. Culverts can be designed to provide beneficial upstream and downstream conditions and to simultaneously avoid creating a negative visual impact.
The information and references necessary to design culverts according to the procedure given in this chapter can be found in FHWA’s Hydraulic Design Series, No. 5 (HDS-5 2005 - http://isddc.dot.gov/.../FHWA), Hydraulic Design of Highway Culverts.
2. CULVERT HYDRAULICS
This section describes key hydraulic principles that are pertinent to the design of culverts. Application of these principles is presented in Section 3.0 of this chapter.
3. CULVERT SIZING AND DESIGN
HDS-5 (FHWA 2005 - http://isddc.dot.gov/.../FHWA) provides valuable guidance for the design and selection of drainage culverts. This particular circular explains inlet and outlet control and the procedure for designing culverts. Culvert design is iterative and consists of the following steps:
1. Determine the flow rate of water the culvert must carry.
2. Select a culvert shape, type, and size with a particular inlet end treatment.
3. Determine a headwater depth from the relevant charts for both inlet and outlet control for the design discharge, the grade and length of culvert, and the depth of water at the outlet (tailwater).
4. Compare the largest depth of headwater (as determined from either inlet or outlet control) to the design criteria. If the design criteria are not met, continue trying other culvert configurations until one or more configurations are found to satisfy the design parameters.
5. Estimate the culvert outlet velocity and determine if there is a need for any special features such as energy dissipators or armoring of the downstream channel.
These steps are described in Sections 3.1 through 3.5 of this chapter.
4. CULVERT INLETS
The capacity of culverts to convey water is limited by the capacity of the inlet. This is frequently overlooked by designers. Culverts and open channels are often carefully designed with full consideration given to slope, cross section, and hydraulic roughness, but without regard to the inlet limitations. Culvert designs based on uniform flow equations rarely can convey their design capacity due to limitations imposed by the inlet.
The design of a culvert, including the inlet and the outlet, requires a balance between hydraulic efficiency, purpose, and topography at the proposed culvert site. Where there is sufficient allowable headwater depth, the choice of inlets may not be critical, but where headwater depth is limited, erosion is a problem, or sedimentation is likely, a more efficient inlet may be required to obtain the necessary discharge capacity for the culvert.
Although the primary purpose of a culvert is to convey flows, a culvert may also be used to restrict flow, such as in cases where a controlled amount of water is discharged while the area upstream from the culvert is used for detention storage to reduce the peak discharge rate. In this case, an inlet with limited capacity may be the appropriate choice.
The inlet types described in this chapter may be selected to fulfill either of the above requirements depending on the topography or conditions imposed by the designer. The entrance coefficient, Ke, as defined for Equation CB-5, is a measure of the hydraulic efficiency at the inlet, with lower valves indicating greater efficiency. Inlet coefficients are given in Table CB-4.
5. INLET PROTECTION
Inlets on culverts, especially on culverts to be installed in live streams, should be evaluated relative to debris control and buoyancy. The following section discusses this further.
6. OUTLET PROTECTION
Scour at culvert outlets is a common occurrence and must be accounted for. The natural channel flow is usually confined to a lesser width and greater depth as it passes through a culvert barrel. Increased flow velocity typically results with potentially erosive capabilities as it exits the barrel. Turbulence and erosive eddies form as the flow expands to conform to the natural channel. However, the velocity and depth of flow at the culvert outlet and the velocity distribution upon reentering the natural channel are not the only factors that need consideration. Other factors to consider with respect to scour potential include the characteristics of the channel bed and bank material, velocity, and depth of flow in the channel at the culvert outlet, and the amount of sediment and other debris conveyed in the flow. Due to the variation in expected flows and the difficulty in evaluating the variables described above, scour prediction is an inexact science.
8. BRIDGES INTRODUCTION AND OVERVIEW
Bridges are important roadway hydraulic structures that are vulnerable to failure from flood related causes. In order to minimize the risk of failure, the hydraulic requirements of stream crossings must be recognized and considered in all phases of roadway development, construction and maintenance.
There are extensive manuals on bridges that are available and should be used in bridge hydraulic studies and river stability analysis. Some of the best include:
- Hydraulics of Bridge Waterways Hydraulic Design Series No. 1 (FHWA 1978). This is a good basic reference.
- Highway in the River Environment (Richardson 1988 draft with appendices and 1974). This is particularly good for hydraulics, geomorphology, scour, and degradation.
- Hydraulic Analysis Location and Design of Bridges Volume 7 (AASHTO 1987). This is a good overview document.
- Technical Advisory on Scour at Bridges (FHWA 1988). This presents information similar to references 2, 3, and 4 above, but in a workbook format, and perhaps oversimplified.
Bridges are required across nearly all open urban channels sooner or later and, therefore, sizing the bridge openings is of paramount importance. Open channels with improperly designed bridges will either have excessive scour or deposition or not be able to carry the design flow.
All structural calculations shall be in compliance with the AASHTO LRFD Bridge Design Specifications (current edition) and stamped by a structural engineer licensed in the State of Arkansas. Trail bridges shall be designed according to the LRFD Guide Specifications for Design of Pedestrian Bridges (current edition) and stamped by a structural engineer licensed in the State of Arkansas. The construction specifications shall be ARDOT’s specifications modified appropriately to reflect Rogers as the owner rather than ARDOT.
9. DESIGN EXAMPLE
The following example problem illustrates the culvert design procedures using the RDM-Culvert spreadsheet application.
10. REFERENCES
American Association of State Highway and Transportation Officials (AASHTO), Highway Subcommittee on Bridges and Structures. 2007. LRFD Bridge Design Specifications, 4th Ed. Washington, DC: AASHTO
American Association of State Highway and Transportation Officials (AASHTO) Task Force for Roadside Safety, Highway Subcommittee on Design. 1996. Roadside Design Guide. Washington, DC: AASHTO.
———. 1987. Hydraulic Analysis. Location and Design of Bridges. Washington, DC: AASHTO.
American Concrete Pipe Association. 2000. Concrete Pipe Design Manual. Irving, TX: American Concrete Pipe Association.
Arkansas State Highway and Transportation Department (AHTD). 1982. Drainage Manual. Little Rock, AR: AHTD
———. 2000. Standard Drawing PCC-1, Concrete Pipe Culvert Fill Heights and Bedding. Little Rock, AR: Arkansas State Highway and Transportation Department.
Chow, V.T. 1959. Open Channel Hydraulics. New York: McGraw-Hill Book Company, Inc.
Ginsberg, A. 1987. HY8 Culvert Analysis Microcomputer Program Applications Guide. Washington, DC: U.S. Department of Transportation, Federal Highway Administration.
King, H.W. and E.F. Brater 1976. Handbook of Hydraulics. New York: McGraw-Hill Book Company.
New Jersey Department of Transportation (NJDOT). 2008. Soil Erosion and Sediment Control Standards. Trenton, New Jersey: NJDOT
Rhode Island Department of Environmental Management. 1989. Soil Erosion and Sediment Control Handbook. Providence, RI: RI DEM
Richardson, E.V. 1974. Highways in the River Environment. Washington, DC: U. S. Department of Transportation, Federal Highway Administration.
Scourstop.com. 2008. ScourStop. 1 Sep. 2009 .
Urban Drainage and Flood Control District. 2001. Urban Storm Drainage Criteria Manual. Denver, CO: Urban Drainage and Flood Control District.
U.S. Army Corp of Engineers (USACE). 1952. Hydrologic and Hydraulic Analysis, Computation of Backwater Curves in River Channels. Engineering Manual. Washington, DC: Department of the Army.
U.S. Bureau of Reclamation. 1960. Design of Small Dams. Denver, CO: Bureau of Reclamation.
U.S. Federal Highway Administration (FHWA). 1960. Hydraulics of Bridge Waterways. Hydraulic Design Series No.1. Washington, DC: FHWA.
———. 1965. Hydraulic Charts for the Selection of Highway Culverts. Hydraulic Engineering Circular No. 5. Washington, DC: U.S. Department of Transportation, Federal Highway Administration.
———. 1971. Debris Control Structures. Hydraulic Engineering Circular No. 9. Washington, DC: U.S. Department of Transportation, Federal Highway Administration.
———. 1972b. Hydraulic Design of Improved Inlets for Culverts. Hydraulic Engineering Circular No. 13. Washington, DC: U.S. Department of Transportation, Federal Highway Administration.
———. 1978. Hydraulics of Bridge Waterways. Hydraulic Design Series No. 1. Washington, DC: Department of Transportation.
———. 1983. Hydraulic Design of Energy Dissipators for Culverts and Channels. Hydraulic Engineering Circular No.14. Washington, DC: U.S. Department of Transportation, Federal Highway Administration.
———. 1985. Hydraulic Design of Highway Culverts. Hydraulic Design Series No. 5. Washington, DC: U.S. Department of Transportation, Federal Highway Administration.
———. 1988. Highways in the River Environment. Washington, DC: U. S. Department of Transportation, Federal Highway Administration.
———. 1996. Federal Lands Highway Project Development and Design Manual. 1996 Metric Revision. FHWA-DF-88-003. Washington, DC: U.S. Department of Transportation, Federal Highway Administration.
———. 2000. Hydraulic Design of Energy Dissipators for Culverts and Channels. Hydraulic Engineering Circular No. 14M. Washington, DC: U.S. Department of Transportation, Federal Highway Administration.
Virginia Department of Transportation (VDOT). 2002. Drainage Manual. Richmond, Virginia: VDOT
1.0 INTRODUCTION
This section of the Manual on construction best management practices was developed using several references including: Urban Storm Drainage Criteria Manual developed by Urban Drainage and Flood Control District in Denver, Colorado; Stormwater Management Manual for Western Washington developed by Washington State Department of Ecology Water Quality Program; and California Stormwater BMP Handbook developed by California Stormwater Quality Association.
3.0 Best Management practices for construction sites
Best Management Practices (BMPs) are used to reduce pollutants in stormwater discharges from construction sites and to assure compliance with the terms and conditions of the Construction General Permit.
The impacts to water quality resulting from construction management facilities can be managed by controls on equipment and material storage.
Erosion controls limit the amount and rate of erosion occurring on disturbed areas. They are surface treatments and source controls that stabilize the soil exposed by excavation or grading.
Sediment controls capture soil that has been eroded before it leaves the construction site. They allow soil particles that have been suspended in runoff to be filtered through a porous media or to be deposited by slowing the flow and allowing the natural process of sedimentation to occur.
The planning for the installation of temporary or permanent erosion and sediment controls needs to begin in advance of all major soil disturbance activities on the construction site. Minimizing the area being disturbed at any given time is one of the most effective erosion control measures. This principle needs to be kept in mind whenever developing a SWPPP. All areas of exposed soil will require a control measure to be defined that is dependent on the duration of exposure.
The erosion potential associated with a construction site is reduced when stabilization techniques are employed. Existing vegetation shall be preserved where attainable. Stabilization measures shall be initiated as soon as practicable in portions of the site where construction activities have temporarily or permanently ceased.
Maximizing onsite infiltration will reduce the runoff that will require treatment prior to leaving the site. Sediment basins, detention ponds, grass swales, and sediment traps are BMPs that will encourage onsite infiltration. Infiltration should not be promoted in areas next to building foundations or in soils that are not appropriate.
The erosion and sediment control measures will also be effective in controlling wind erosion. The surface stabilization measures identified for control of precipitation-induced erosion act also to prevent soils from becoming windborne. Although these guidelines were developed to control erosion by rainfall and snowmelt, they are consistent with design principles for wind erosion and will be effective for this purpose. Refer to DEQ Regulation 18: Arkansas Air Pollution Code at www.adeq.state.ar.us
BMP Fact Sheets have been provided for each of the following construction management practices, erosion controls, and sediment controls. They are to be used as guidelines to select the controls needed for each phase of the construction project based on the different demands.
Construction management practices include the BMPs listed in Table CS-1.
4.0 WATERWAY PROTECTION
At times construction activities must occur within or immediately adjacent to a waterway (drainageway, creek, stream, river, lake, reservoir or wetland). Whenever this occurs, bottom sediment and the soil will be disturbed and sediment movement will occur. The goal is to minimize the movement of sediments resulting from construction activities. This is accomplished by the use of erosion and sediment control practices described in this Manual.
5.0 UNDERGROUND UTILITY CONSTRUCTION – PLANNING AND IMPLEMENTATION
The construction of underground utility lines will be subject to the following criteria:
- Utility agencies shall be responsible for compliance with the requirements of this article.
- The City of Rogers has the right to limit the amount of trench excavated in advance of utility laying. In general, such trenching shall not exceed 400 feet.
- Where consistent with safety and space considerations, excavated material is to be placed on the uphill side of trenches.
- Trench dewatering devices must discharge in a manner that will not adversely affect flowing streams, wetlands, drainage systems, or off-site property. Dewatering that discharges water in a manner that may enter into waters of the State require a Construction General Permit from the Arkansas Department of Energy & Environment Division of Environmental Quality.
- Provide storm sewer inlet protection whenever soil erosion from the excavated material has the potential for entering the storm drainage system.
- Prior to digging or construction of a trench that the fire department shall be notified by email, telephone or internet submission. Further, it is required that all trenches comply with the Occupational and Safety Act of 1980.
Utility agencies shall develop and implement Best Management Practices (BMPs) to prevent the release of sediment and discharge of pollutants from utility construction sites. Disturbed areas shall be minimized and managed. Construction site entrances shall be managed to prevent sediment tracking. Excessive sediment tracked onto public streets shall be removed immediately. The City of Rogers may adopt and impose additional BMPs on utility construction activity.
Prior to entering a construction site or subdivision development, utility agencies shall have obtained from the owner a copy of any SWPPP for the project. Any disturbance to BMPs resulting from utility construction shall be repaired immediately by the utility company in compliance with the SWPPP.
It is the responsibility of the utility agency to obtain necessary permits for the construction of utility lines within Waters of the United States.
6.0 REMOVAL OF TEMPORARY MEASURES
All temporary erosion and sediment control measures shall be removed and properly disposed of within thirty (30) days after final stabilization is achieved, after the temporary measures are no longer needed, or as authorized by the City of Rogers. It may be necessary to maintain some of the control measures for an extended period of time, until the upstream areas have been fully stabilized and vegetation has sufficiently matured to provide specified cover.
Trapped sediment and disturbed soil areas resulting from the removal of temporary measures must be returned to final plan grade and permanently stabilized to prevent further soil erosion.
The qualified professional preparing the SWPPP shall submit a schedule of removal dates for the temporary control measures. The schedule should be consistent with key construction phases such as street paving, final stabilization of disturbed areas, or installation of structural stormwater controls.
Permanent post-construction BMPs that were used as sediment controls during construction shall be refurbished to a fully operational form per the design plans and SWPPP. The final site work will not be accepted by the City of Rogers until these permanent post-construction BMPs are in a final and acceptable form.
7.0 MAINTENANCE
All temporary and permanent erosion and sediment controls shall be inspected, maintained, and repaired by the owner during the construction phase to assure continued performance of their intended function. Refer to the individual BMP fact sheets for maintenance guidelines.
The qualified professional preparing the SWPPP shall submit a schedule of planned maintenance activities for the temporary and permanent erosion and sediment control measures.
2. APPLICABILITY
The water quality requirements outlined in this chapter apply to all new developments and redevelopments that add 0.1 acre of impervious area to their site.
For sites that are smaller than 0.5 acre, or for sites that are being redeveloped, the City may allow the property owner to pay a fee in-lieu-of implementing water quality control measures described in this chapter. The fee-in-lieu option is discussed further in Section 3.3.
3. WATER QUALITY DESIGN OBJECTIVES
The primary objectives of the City’s stormwater quality requirements are to:
- Protect drinking water supplies.
- Protect public health and safety related to water resources.
- Maximize the quality of water resources to enhance the quality of life.
- Enable recreational opportunities where feasible and beneficial.
- Meet federal National Pollutant Discharge Elimination System (NPDES) program requirements.
To achieve these objectives, the City requires that new developments incorporate specific design features to improve the quality of stormwater runoff. Specifically, new development must implement one or more of the water quality design principles summarized in Section 3.1 as a means to achieve the specific WQCV design requirement(s) for the site, as discussed in Section 3.2.
4. STRUCTURAL BEST MANAGEMENT PRACTICES
Structural BMPs described in this section include vegetated filter strips/grass buffers, grass swales, extended dry detention basins, extended wet detention basins, constructed wetland basins, permeable pavers, porous landscape detention, and proprietary packaged stormwater treatment systems. A brief description of each BMP is provided followed by design procedures and criteria and maintenance considerations. BMPs that capture and treat the WQCV are listed first (Extended Dry Detention Basin, Extended Wet Detention Basin, Constructed Wetland Basin, Porous Landscape Detention, and Permeable Pavers). These are followed by BMPs that do not store the WQCV but that help to reduce the DCIA (Permeable Pavers, Vegetated Filter Strip/Grass Buffer, and Grass Swale) and which can be used to reduce the required WQCV for a site as described in Appendix A.
Experience with many of the BMPs in Rogers is limited as of 2010 (when this manual was initially published). As experience with BMP design, construction, monitoring, and maintenance builds, the criteria listed below may change.
5. LOW IMPACT DEVELOPMENT
Low Impact Development (LID) is an overall development approach that is designed to mimic a site's predevelopment hydrology. The major components of LID include:
- Conservation and protection of site features such as streams, wetlands, and valuable habitat areas and avoidance of potential problem areas such as steep slopes.
- Minimization of site impacts by minimizing clearing and grading, preserving soils with high infiltration capacities (Hydrologic Soil Group A and B soils), limiting lot disturbance, incorporating soil amendments, disconnecting impervious surfaces, and reducing impervious surfaces.
- Maintaining the natural time of concentration to the extent practicable through using open drainages, incorporating green spaces, flattening slopes, dispersing drainage, lengthening flow paths, using vegetative swales, maintaining natural flow paths, maximizing stream setbacks, and maximizing sheet flow.
- Implementing LID integrated management practices (IMPs) that address runoff at its source by using design techniques that infiltrate, filter, store, evaporate, and detain runoff close to its source. Instead of conveying and treating stormwater in facilities located at the bottom of drainage areas, LID relies on practices such as open drainage swales, bioretention cells (similar to porous landscape detention), rain gardens, rain barrels, rooftop storage, depression storage, soil amendments, infiltration swales and other similar features. A typical LID site will have multiple dispersed IMPs, rather than a single BMP at the low corner of a development.
- Implementing pollution prevention practices that focus on maintenance practices and proper use, handling and storage of materials such as pesticides, fertilizers, household hazardous waste, etc.
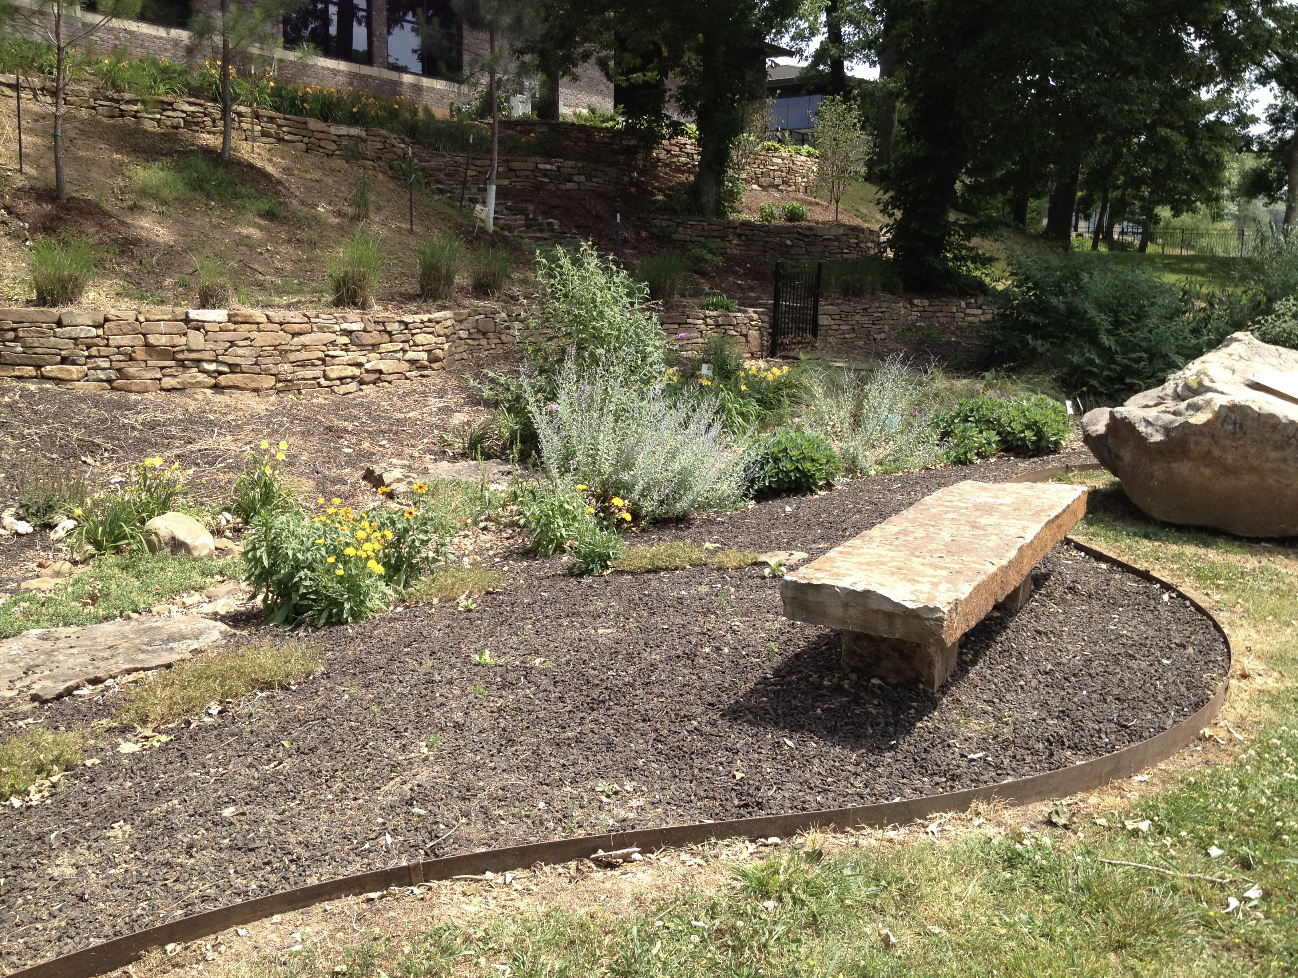
Photograph WQ-12 – Example of a Rain Garden.
This rain garden is a low impact development technique that serves as a landscape amenity while also helping to reduce runoff volumes and pollutant loading.
Many of the components of the LID approach have been previously discussed in this chapter. The difference with LID is the overall site design process that incorporates all of the steps described above, resulting in a multi-faceted site design approach.
Because many LID features are natural in appearance and may rely on natural site features (e.g., preservation of soils with high infiltration capacities), it is imperative that the soil structure in these areas not be modified or compacted during construction, thereby reducing the natural infiltration capacity of the soil. This will require careful restriction on the routing of construction equipment, verification that infiltration capacities have been maintained, and possibly the addition of soil amendments.
Another critical requirement for a successful LID site is assuring that regular and proper maintenance is conducted. If the dispersed LID components are not regularly maintained by a qualified landscape professional, the LID site will likely not function as intended. Maintenance costs must be borne by the property owner or POA and maintenance easements must be provided to allow for proper access.
When designing a LID site, it is important to ensure that the landscape practices (such as rain gardens) are attractive and perceived by the property owner as adding value to the property. If these LID practices are viewed as assets, the primary motivation for their long-term maintenance is that of property owners protecting their vested economic interests.
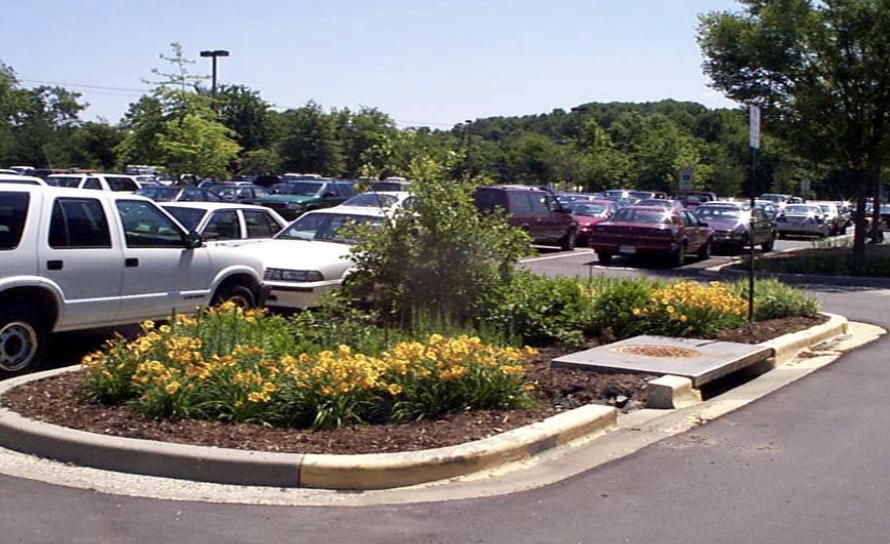
Photograph WQ-13 – Example of a Porous Detention Island.
This porous detention island is designed to reduce runoff rates and volumes and pollutant loading.
Additional design guidance may be incorporated into this Manual in the future regarding LID. In the interim, the Low Impact Development Center website (www.lowimpactdevelopment.org/) provides a good reference for more detailed design guidance, design drawings, and specifications. For example, specifications for engineered soils can be downloaded from the LID website for bioretention cells and swales. LID site designs must be approved by the Department of Planning and Transportation and must be discussed early in the site planning process.
6.0 STORMWATER POLLUTION PREVENTION, GRADING, AND EROSION CONTROL
The purpose and objectives of this section are as follows:
- To maintain and improve the quality of water impacted by the storm drainage system within the City;
- To prevent the discharge of contaminated stormwater runoff and illicit discharges from industrial, commercial, residential, and construction sites into the storm drainage system within the City;
- To promote public awareness of the hazards involved in the improper discharge of trash, yard waste, lawn chemicals, pet waste, wastewater, oil, petroleum products, cleaning products, paint products, hazardous waste, sediment, and other pollutants into the storm drainage system;
- To encourage recycling of used motor oil and safe disposal of other hazardous consumer products;
- To facilitate compliance with state and federal standards and permits by owners of construction sites within the City; and
- To enable the City to comply with all federal and state laws and regulations applicable to the National Pollutant Discharge Elimination System (NPDES) permitting requirements for stormwater discharges.
7. REFERENCES
American Society of Civil Engineers and Water Environment Federation. 1992. Design and Construction of Urban Stormwater Management Systems. ASCE Manual and Report on Engineering Practice No. 77 and WEF Manual of Practice FD-20. Alexandria,VA: Water Environment Federation.
Arkansas State Operating Permit Number ARR040041.
Debo, T. and A. Reese. 2002. Municipal Stormwater Management. 2nd Edition. Boca Raton, FL: Lewis Publishers.
Horner, R.R., J.J. Skupien, E.H. Livingston, and H.E. Shaver. 1994. Fundamentals of Urban Runoff Management: Technical and Intuitional Issues. Washington, DC: Terrene Institute, in cooperation with the U.S. Environmental Protection Agency.
Low Impact Development (LID) Center Website (www.lowimpactdevelopment.org/). (Also see www.lid-stormwater.net/, which can be accessed through this website.)
Schueler, T. and H. Holland. 2000. The Practice of Watershed Protection. Ellicott City, MD: The Center for Watershed Protection.
Urban Drainage and Flood Control District. 1999. Urban Storm Drainage Criteria Manual, Volume 3. Denver, CO: Urban Drainage and Flood Control District.
Water Environment Federation and American Society of Civil Engineers. 1998. Urban Runoff Quality Management. WEF Manual of Practice No. 23 and ASCE Manual and Report on Engineering Practice No. 87. Alexandria, VA: Water Environment Federation.
Appendix A – Adjustment to the Water Quality Capture Volume
The required Water Quality Capture Volume (WQCV) for a site can be reduced if measures are implemented to reduce the Directly Connected Impervious Area (DCIA) at the site. A DCIA is an impermeable area that drains directly to the improved storm drainage system without an opportunity to infiltrate into the ground. Minimizing DCIA is a land development design approach that reduces paved areas and directs storm water runoff to landscaped areas, grass buffer strips, and grass-lined swales. The purpose is to slow down the rate of runoff, reduce runoff volumes, attenuate peak flows, and facilitate the infiltration and filtering of storm water. Minimizing DCIA can also reduce pollutant loads to the storm water treatment system because of increased infiltration of runoff near the point where the runoff begins.
To reduce the amount of DCIA, slopes on a site should be designed to direct storm water runoff as sheet flow away from buildings, roads, and parking lots toward grass-covered or other pervious areas prior to reaching the storm water conveyance systems or other BMPs. In areas with high permeability soils (Hydrologic Soil Groups A and B), surface runoff may be successfully infiltrated, whereas areas with less permeable soils may require underdrain systems to reduce surface runoff. Sites with average slopes that exceed 5 percent may not be well suited to implementing some aspects of these BMPs because of the reduced potential for infiltration. Steep sites can be addressed by using terracing or retaining walls.
Minimizing DCIA can be implemented in varying degrees. UDFCD (1999) characterizes two general levels associated with minimizing DCIA as follows:
- Level 1 DCIA – Level 1 DCIA involves minimizing DCIA at the individual site development level. This approach generally involves directing runoff from impervious surfaces to flow over grass-covered areas (e.g., filter strips or swales) and providing sufficient travel time to encourage the removal of suspended solids before runoff leaves the site and enters the City storm water collection system. To gain credit for using Level 1 DCIA, all impervious surfaces must be designed to drain over grass buffer strips or swales before reaching a storm water conveyance system.
- Level 2 DCIA - A more advanced approach for minimizing DCIA involves minimizing DCIA at the subdivision level (in addition to the individual site development level of Level 1). In addition to the measures taken in Level 1, Level 2 involves replacing solid street curb and gutter systems with no curb or slotted curbing and low-velocity grass-lined swales and pervious street shoulders. Conveyance systems and storm sewer inlets are still necessary to collect runoff at downstream intersections and crossings where storm water flow rates exceed the capacity of the swales. Small culverts will be needed at street crossings and at individual driveways unless inlets are provided to convey the flow to a storm sewer. Implementing Level 2 DCIA involves a public street design differing from public improvement standards and will therefore require early planning with City staff and subdivision variances in accordance with subdivision regulations.
Based on the extent of measures used to minimize DCIA (i.e., Level 1 versus Level 2), Figure A-1 can be used to convert the actual impervious area of a site (horizontal scale) to an effective impervious area (vertical scale) for use in calculating the WQCV. The effective impervious area adjustment for Level 1 and Level 2 DCIA is incorporated into the WQCV Worksheet in the BMP spreadsheet.
Figure A-1
Imperviousness Adjustments for Levels 1 and 2 of Minimizing DCIA
(Source: Urban Storm Drainage Criteria Manual, Volume 3, Best Management Practices, UDFCD, 1999)
Appendix B – Fee In-Lieu-of Calculation Methodology
The City may allow the property owner to pay a fee in-lieu-of implementing water quality control measures. The fee paid in-lieu-of water quality protection measures is acceptable only if the development site disturbs less than one half (0.5) an acre and the site has not been specifically identified by the City as having a significant potential to adversely impact the quality of stormwater runoff. Sites that have an existing regional water quality control facility with adequate capacity, as determined by the City, are exempt of having to pay a fee-in-lieu of water quality protection. Proceeds from fees collected from this option will be used by the City to fund regional stormwater facilities or other measures that will benefit the quality of stormwater in the community.
The following method is used to calculate the fee paid in-lieu-of implementing stormwater BMPs:
Base fee - A base fee is calculated from the impervious surface area.
The base fee is $0.50 per square foot of Impervious Surface Area.
Base fee reductions – The amount of impervious surface area used to calculate the base fee for a site can be reduced if BMPs are implemented to reduce the amount of Directly Connected Impervious Area (DCIA) at the site. The reduction to the impervious area is dependent on the extent of BMPs implemented. Refer to Appendix A, Figure A-1 to determine the adjustment to the impervious area based on the type of BMPs employed (i.e., Level 1 DCIA versus Level 2 DCIA). Multiply the impervious area adjustment by the Impervious Area. The reduced Impervious Area is used to calculate the fee to be paid in-lieu-of implementing water quality BMPs.
Example: The impervious percentage of a 2-acre commercial site is 50%. If Level 2 DCIA measures are employed at the site, using Figure A-1 (see Appendix A), the effective impervious area is 38%. The adjustment factor is 0.38/0.5 = 0.76. Multiplying the total impervious area of the site (2 acres x 43560 sq. ft/acre x 50% impervious area = 43560 sq. ft.) by the adjustment factor (0.76) yields an effective impervious area of 33106 sq. ft., which equates to an ISU for the site of 33.1. Therefore, the adjusted fee for the in-lieu-of payment is $16,553 (based on a rate of $0.50 per square foot of Impervious Surface Area).
1.0 INTRODUCTION
Cave Springs Cave is located in the northwest Arkansas community of Cave Springs, near the intersection of Arkansas Highways 264 and 112 in southern Benton County. Cave Springs Cave provides habitat for the largest known population of Ozark Cavefish (Amblyopsis rosae), a federally listed threatened species. In addition to providing habitat for federally protected species, water quality in the cave is an indicator of regional water quality in the shallow aquifer. In 2014, The Nature Conservancy and Ozark Underground Laboratory (OUL) performed an extensive literature review of cave hydrology, biology and water quality1. Based on this study, primary water quality goals for the Cave Springs Recharge Area are to limit discharges of oxygen-depleting contaminants, turbidity/fine sediments, nutrients, and metals to the groundwater system through the use of best management practices (BMPs).
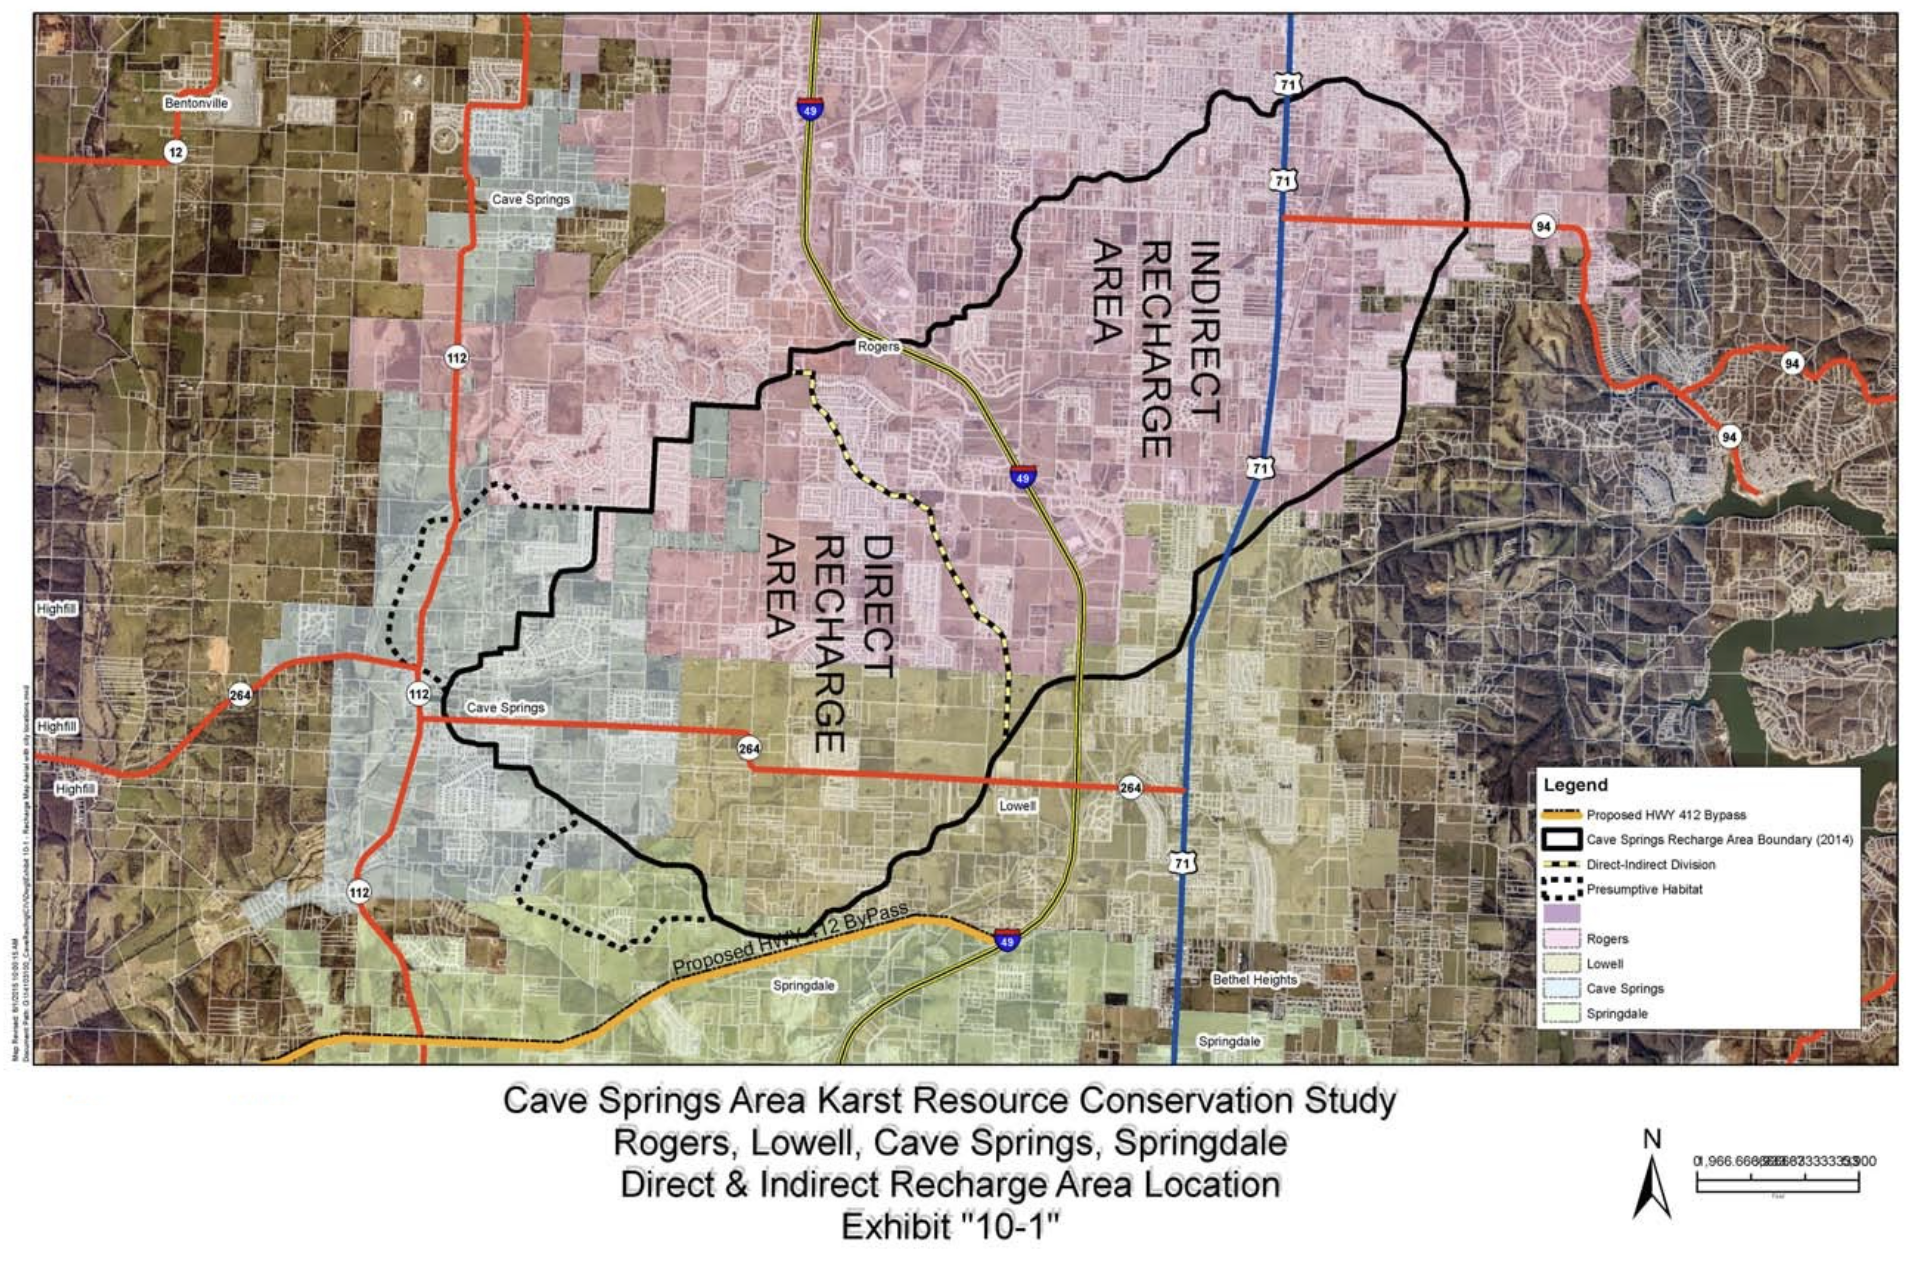
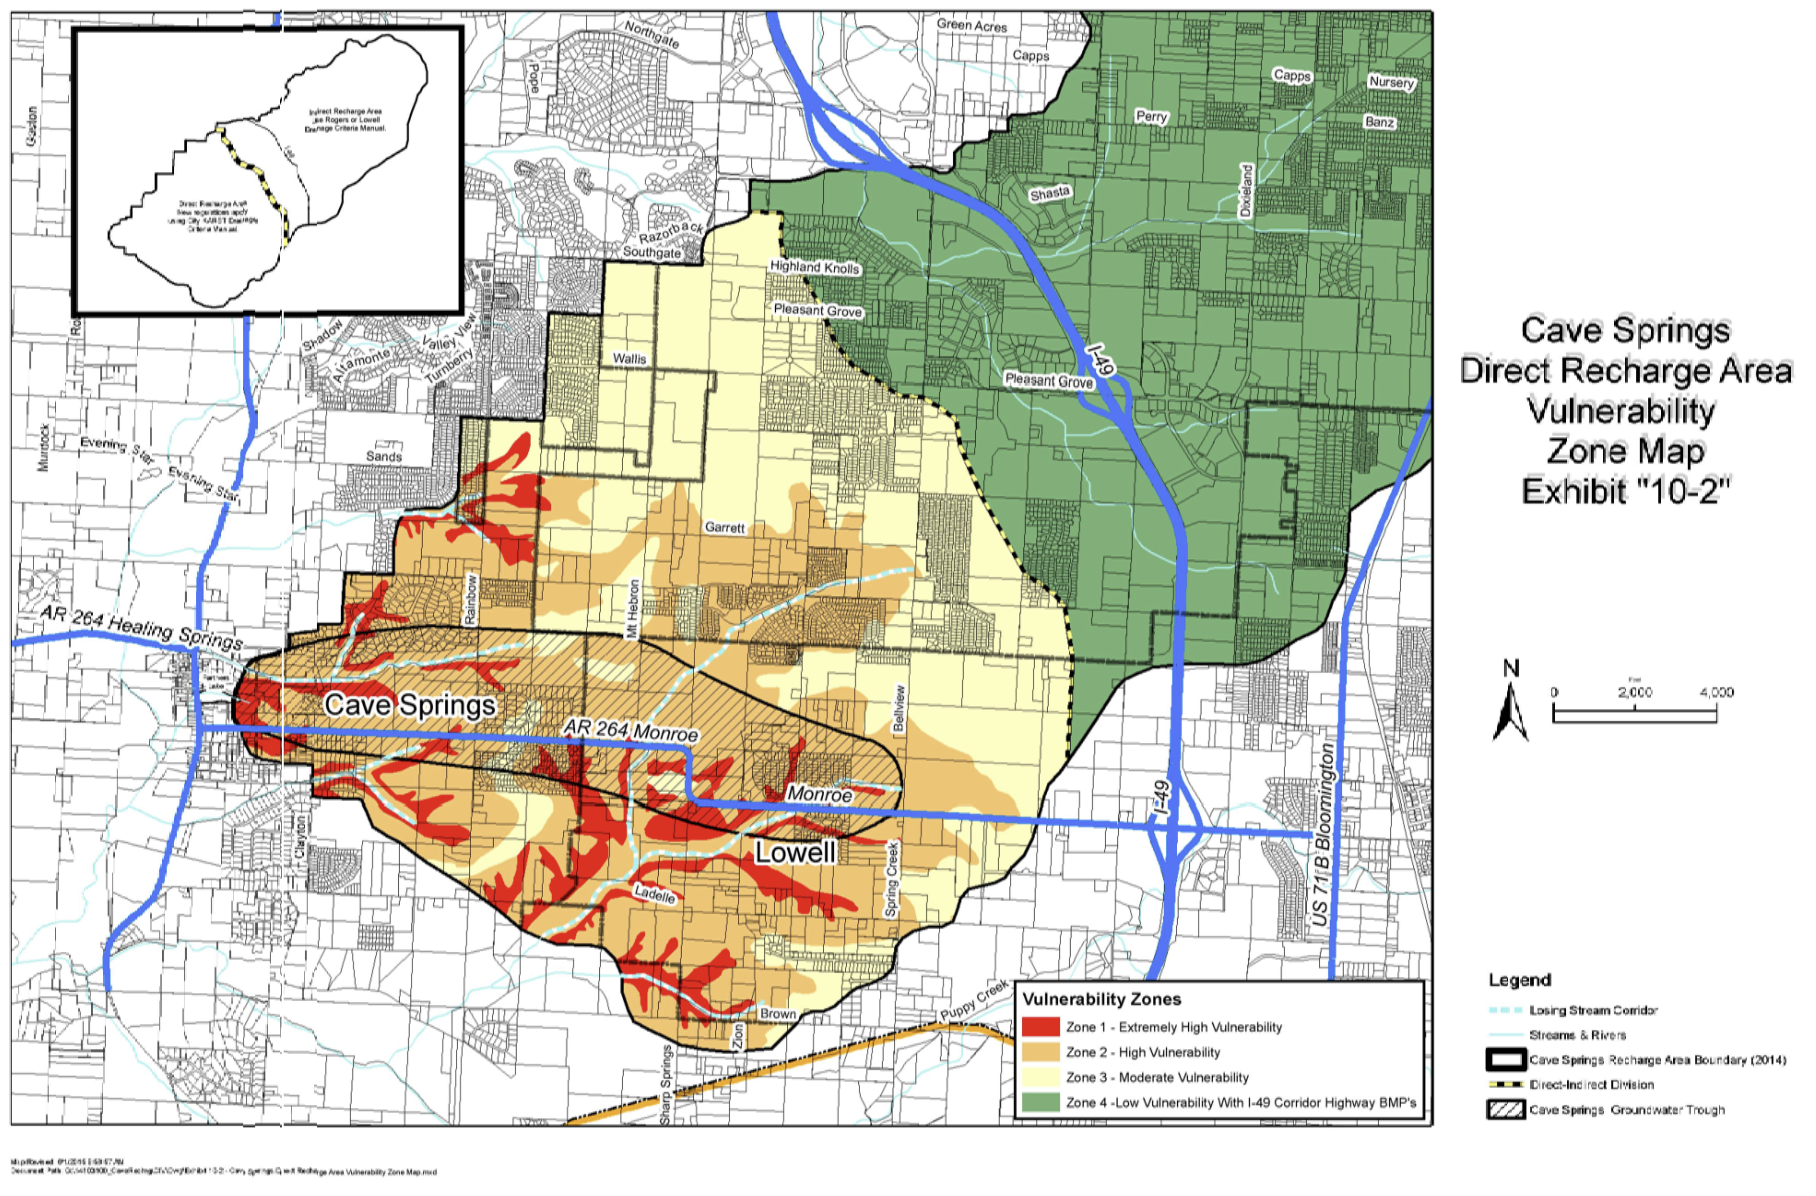
The purpose of this chapter is to provide criteria and guidance for BMPs to protect the unique karst resources of the Cave Springs Recharge Area while allowing for future growth and development. The Cave Springs Recharge Area encompasses lands that are included in the municipalities of Cave Springs, Rogers, Lowell, and Springdale and has a total recharge area of 12,515 acres (19.5 square miles). Exhibit 10-1 shows the Cave Springs Recharge Area, which is comprised of two major areas:
The Direct Recharge Area includes 5,702 acres (8.9 square miles) and provides most of the recharge water for the Cave Springs cave system. This is an area where soils allow for relatively rapid recharge, and there is a direct hydrologic connection between infiltrating runoff and the karst system. The northeastern boundary of the Direct Recharge Area lies roughly parallel to, and west of, Interstate 49 (I- 49).
The Indirect Recharge Area encompasses 6,813 acres (10.6 square miles) and lies to the northeast of the Direct Recharge Area. Groundwater tracing has shown that very little of the water from losing streams in this area reaches the Cave Springs cave system. However, the dye tracing indicates that there is some groundwater movement from the Indirect Recharge Area into the Direct Recharge Area and ultimately to Cave Springs cave. I-49 lies entirely within the Indirect Recharge Area.
Exhibit 10-2 shows losing stream segments, soils mapping, major roads and other features within the Recharge Area. Based on analysis of groundwater elevations and tracing data, a “trough” in the groundwater potentiometric surface is located from Cave Springs to the east. This trough is located roughly parallel to Highway 264 and is shown on Exhibit 10-2. This groundwater trough represents a preferential pathway whereby contaminants can enter the Cave Springs groundwater system. Mapping of the Direct and Indirect Recharge Areas is based on previous studies dating back to the 1970’s and hydrogeologic studies in 2014 presented in the Groundwater Tracing and Recharge Area Delineation Summary Report (OUL 2015).
This chapter has been developed to provide criteria and guidance for compliance with the Cave Springs Area Karst Resource Conservation Regulations (CSK Regulations). This is not a stand-alone chapter and must be used in conjunction with Chapters 1 – 9 of the Drainage Criteria Manual. Chapter 9 - Water Quality provides criteria for many BMPs including swales, buffers, ponds, etc. that can be used to comply with the CSK Regulations with modifications and enhancements as noted in this chapter.
2.0 SCOPE AND APPLICABILITY
The CSK Regulations and the criteria and guidance in this chapter were developed through a stakeholder process involving representatives from the Cities of Cave Springs, Rogers, Lowell, and Springdale; the United States Fish and Wildlife Service (USFWS); The Nature Conservancy; Northwest Arkansas Regional Planning Commission (NWARPC); the Arkansas Department of Transportation (ARDOT); University of Arkansas; landowners; representatives from the construction and development industry; and others. This chapter and the CSK Regulations apply to the Direct Recharge Area. For the Indirect Recharge Area, the criteria in Chapter 9 – Water Quality apply. ARDOT has already developed plans for BMPs for the I-49 corridor that will be protective of the water quality of the karst system, and this area is not addressed in this chapter.
The CSK Regulations and criteria in this chapter are in addition to other water quality regulations in local codes and ordinances related to stormwater, wastewater, underground storage, etc. The applicant must also comply with Arkansas Department Energy & Environment Division of Environmental Quality (DEQ) permitting requirements and Northwest Arkansas Municipal Separate Storm Sewer System (MS4) requirements, as applicable. Federal regulations including Section 404 and Section 401 may apply on some sites, as well as Federal Emergency Management Agency (FEMA) and local floodplain regulations. To the extent that there are conflicting requirements between various regulations, the more restrictive/protective shall apply. These requirements do not apply to existing development or development projects that have submitted preliminary plats for governmental regulatory review, prior to the effective date of the CSK Regulations as described in Section3.1.3.
3.0 WATER QUALITY PROTECTION ZONES
A tiered, or zoned, approach has been developed for the Cave Springs Recharge Area using risk-based vulnerability factors. Four risk-based zones are defined based on vulnerability criteria that include the following:
- Location in Direct or Indirect Recharge Area.
- Nature of existing and proposed land use.
- Ability of soils overlying high-permeability and karst layers to treat stormwater.
- Proximity to losing streams and other areas with soils that rapidly recharge the karst system.
- Potentiometric head map including Cave Springs Groundwater Trough. This is an area with high recharge potential to the groundwater system.
Requirements for site characterization, buffers, and best management practices (BMPs) vary by zones.
4.0 LAND DISTURBANCE PERMIT REQUIREMENTS
A Land Disturbance Permit Application, Report, and permit are required for all development projects in the Direct Recharge Area (Zones 1, 2, and 3) under the Cave Springs Area Karst Resource Conservation Regulations. Land Disturbance Permits related to the Cave Springs Indirect Recharge Area (Zone 4) will need to adhere to the regulations in the previous chapters of this manual, including MS4 and State of Arkansas requirements.
The review officer for the Land Disturbance Permit Application shall be the Director of the Department of Community Development or his or her designee unless the proposed development activity requires review by the Planning Commission and/or City Council, in which case the Land Disturbance Permit may be reviewed concurrently with other development applications as is determined appropriate and efficient by the Director of the Department of Community Development or his or her designee.
The Land Disturbance Permit shall be granted as a physical permit to keep on site at a visible and accessible location so long as the permit is active. The Land Disturbance Permit shall include any conditions of approval.
The decision of the Director of the Department of Community Development or his or her designee or Planning Commission may be appealed to the City Council.
The Land Disturbance Permit Application and Report should provide the following information at a minimum:
- Description of proposed development project including land use, proximity to sensitive features, potential contaminant sources (both surface and subsurface) associated with development (construction and post-construction), proposed plan to disconnect impervious surfaces (as recommended by Drainage Criteria Manual, etc.).
- A boundary map or diagram separately depicting the boundaries, if any, of the Cave Springs groundwater trough, the boundaries of Zone 1, Zone 2, and Zone 3 vulnerability areas, and depicting the boundary of losing streams as defined on the Cave Springs direct recharge area vulnerability zone map.
- Mapping should identify karst areas, stream buffers, floodplains, and other vulnerable areas. Filtration practices shall be implemented in conjunction with conventional BMPs to provide a high level of treatment for runoff discharging to these sensitive areas.
- Preliminary grading, erosion control, and drainage plans shall be provided. The grading and erosion control plans shall utilize soil stabilization measures and practices to minimize the impacts of the proposed disturbance including a time frame for installation of erosion control measures.
- Preliminary wastewater plans must be provided.
- Revegetation plans showing quantity and type of plant material to be used for revegetation, time frame for revegetation and proposed soil stabilization measures shall be provided.
- A slope study map that indicates the areas of less than three percent grade and areas of three percent or greater grade in the inner buffer and outer buffer areas shall be provided.
- Identification of other sensitive features and risk factors including steep slopes (greater than15%); erosive soils; areas with poor vegetative cover and areas of existing erosion; floodplains; unstable stream reaches; storage areas for hazardous materials, fertilizers, pesticides, etc.; wetlands and waterbodies; sanitary wastewater collection/storage/treatment/pumping facilities; and other potential subsurface sources.
- Delineation of inner and outer buffers in accordance with buffer widths described by zone herein. In general, each zone will have a restrictive inner buffer where development activities will be strictly limited and an outer buffer that is determined based on site-specific characteristics. The outer buffer may be reduced in some circumstances based upon the use of BMPs that replace functions of the buffer. In these cases, encroachments into the outer buffer may be allowed as long as there are BMPs that would offset or mitigate impacts.
- Identification of BMPs for stormwater (construction and post-construction), wastewater, industrial source controls, and runoff management practices. In cases where encroachments into the outer buffer are proposed, the applicant shall provide documentation of mitigating factors for buffer width reductions using the Cave Springs Outer Buffer Width Adjustment Worksheet (provided in this chapter).
- For activities that involve the fill of wetland areas, evidence of acceptance of the plan by the U.S. Army Corp of Engineers shall be provided.
- Documentation of funding mechanism for maintenance of buffer areas and BMPs and Maintenance Plan describing the nature, frequency and entity responsible for maintenance activities.
An Arkansas-registered Professional Engineer must prepare the Land Disturbance Permit Application and Report, and the final version of the report and supporting drawings must be signed and stamped by an Arkansas-registered Professional Engineer.
The reviewing entity shall use the review criteria in this section for review of Land Disturbance Permits for site development in the direct recharge area. Land Disturbance Permits shall meet all the applicable review criteria. In all cases where an application for a Land Disturbance Permit meets the applicable review criteria, an acceptable disturbance plan is required as a condition of issuance of the Land Disturbance Permit. The review criteria is outlined as follows:
- The disturbance plan shall comply with standards, criteria and best management practices of Chapter 9 – Water Quality.
- The minimum requirements for a Land Disturbance Permit Application and Report set forth in this chapter must be met. Any on-going maintenance in the disturbance plan shall be in a legal form that is enforceable by the City of Roger, Arkansas against the property owner or legal entity and shall include provisions for recovery of costs for enforcement against the property owners of record.
- The Land Disturbance Permit is for a development activity that is permitted in the vulnerability zone. The following uses are prohibited within vulnerability zones 1 and 2:
- Excavation greater than 8-feet in depth;
- Basements;
- Airport or ground transportation terminal facilities;
- Heliports;
- Major utilities, including but not limited to waste collection, transfer, recycling, and disposal facilities, flood control or drainage facilities, and other minor utilities;
- Building materials and services;
- Heavy equipment and vehicle maintenance and repair services;
- Heavy equipment and vehicle sales and rentals;
- Gas stations;
- Research and development services;
- Vehicle washing;
- Vehicle storage;
- Food processing;
- Linen supply or laundry services;
- Salvage yards;
- Septic tank services;
- Incineration, land fill, mining and processing, and zoos;
- Other uses not listed above but present a contamination hazard for the karst recharge area.
- The proposed disturbance shall avoid any grading or disturbance in the inner buffer area and outer buffer area (if applicable) except those permitted activities and uses as defined in this chapter which cannot be practically avoided if the following additional criteria are met:
- The area of disturbance is minimized;
- Adequate mitigation and best management practices are proposed in the disturbance plan; and,
- Site restoration and revegetation is proposed.
An applicant for a Land Disturbance Permit may apply for a variance from compliance with the review criteria set fourth in this chapter pursuant the review procedures and review criteria established as follows:
- Applications shall follow the same review procedures and shall provide the same minimum information as required for Land Disturbance Permits. In addition, the application for a variance shall identify those review criteria from which a variance is sought and shall include a narrative and other appropriate descriptive material to describe why the requested variance or variances meet the review criteria set forth. The application shall include any information or soil studies demonstrating that the actual soil types on the subject property are different than the soil types indicated in the vulnerability zones described herein.
- The review authority shall be the Planning Commission. Decisions of the Planning Commission may be appealed to the City Council.
- The review authority shall use the following review criteria as the basis for a decision on an application for a variance:
- In all cases, conditions or mitigation may be imposed upon a variance to minimize the adverse impacts of the requested variance on the goals and objectives of the CSK regulations or to ensure compliance with approved disturbance plans; and,
- At least one of the following criteria must be met:
- The variance is needed to relieve hardship caused by the strict and literal interpretation of the Land Disturbance Permit review criteria which hardship is unique to the subject property due to unique characteristics, configuration, access, site conditions, or location of the subject property; or,
- The relief from the strict and literal interpretation and enforcement of a specified regulation, criteria, or best management practice is necessary to achieve compatibility and uniformity of treatment among sites in the vicinity or to attain the objectives of these CSK regulations without the grant of special privilege to the subject property; or,
- The relief from the strict or literal interpretation and enforcement of a specified regulation, criteria or best management practice is minimized to the extent practical and the goals and objectives of the CSK regulations are otherwise met; or,
- Soil studies are submitted that provide evidence the actual soils on the subject property are better than the soil types indicated in the vulnerability zone district designation and that the actual soil types allow for variance from the strict or literal interpretation and enforcement of a specified regulation, criteria or best management practice while still meeting the goals and objectives of these CSK regulations.
- The review authority shall make the following written findings before granting a variance:
- That the granting of the variance will not constitute a grant of special privilege inconsistent with the limitations on other properties classified in the same vulnerability zone;
- That the granting of the variance will not be detrimental to the public health, safety or welfare or materially injurious to properties or improvements in the vicinity;
- That the variance is warranted for one or more of the following reasons:
- The strict, literal interpretation and enforcement of the specified regulation would result in practical difficulty or unnecessary physical hardship inconsistent with the objectives of the development code;
- There are several exceptional or extraordinary circumstances or conditions applicable to the site of the variance that do not apply generally to other properties in the same zone; or,
- The strict, literal interpretation and enforcement of the specified regulation would deprive the applicant of privileges enjoyed by the owners of other properties in the same zone district.
- A variance granted by the review authority may contain limitations as to time or disposition or use of the subject property in order to ensure that the stated purpose of the variance request is realized.
- The variance approval expires two years after approval if the Land Disturbance Permit is not commenced, provided that the review authority may approve a longer time period for the variance approval, including a permanent variance approval, as determined appropriate due to the circumstances and nature of the variance application.
The procedures to appeal a decision of the Planning Commission pursuant of these CSK regulations is set forth herein. Only a final decision of Planning Commission may be appealed. Recommendations to a decision making authority are not subject to appeal.
- An appeal may be submitted by an applicant for a Land Disturbance Permit or by any other party with standing. The appellant must provide a written request for appeal of a decision of the Planning Commission to the City Clerk within 14 days after the date of the decision. The City Council shall conduct a public hearing within 65 days of receipt of a written request for appeal. Written notice of the public hearing date, time and location shall be mailed to the appellant via first class U.S. mail at least 10 days prior to the public hearing, unless the appellant agrees to a shorter time frame and a different notification method.
- The City Council shall review appeals of decisions of the Director of the Department of Community Development or his or her designee after conducting a public hearing. The City Council shall render the final decision on an appeal.
- The City Council shall use the applicable review criteria for a Land Disturbance Permit. The City Council shall review decisions de novo.
- The City Council shall, in writing, confirm, modify, or reverse the decision within 35 days of holding the public hearing on the appeal. Any decision by the City Council that results in action modifying or reversing the decision of a city body or officer shall describe the specific reasons for the modification or reversal. Action of the City Council shall become final immediately. Failure of the City Council to act within the 35 days of holding the public hearing on the appeal shall be deemed action confirming the decision unless the applicant consents to an additional time extension.
- A decision of the City Council is final. An aggrieved person may appeal a decision of the City Council to the district court or to another Arkansas state court or federal court of competent jurisdiction.
The enforcement of these CSK regulations may necessitate the following actions:
- In addition to any other criminal penalties that may be prescribed by state law, any development activity which fails to obtain a permit required by these CSK regulations shall be deemed a violation of these CSK regulations.
- In addition to any other criminal penalties that may be prescribed by state law, any development activity which fails to obtain abide by the terms and conditions of a Land Disturbance Permit issued pursuant to these CSK regulations shall be deemed a violation of these CSK regulations.
- In addition to any other criminal penalties that may be prescribed by state law, every person violating any provision of these CSK regulations shall be deemed to have committed a violation for each and every day or portion of a day during which any violation is committed, continued, or permitted and shall be subject to the penalties contained in Rogers City Code section 1-5.
- In addition to any other criminal penalties that may be prescribed by state law, and in addition to other fines and penalties established herein for violations of this CSK regulation, the City of Rogers, Arkansas may seek an injunction requiring complete restoration of any area disturbed in violation of these CSK regulations, or payment in lieu of restoration, and may issue stop work orders, withhold any further permits for site development and cease the processing of any site development applications related to the property, project, or owner that violates the provisions of these CSK regulations.
5.0 BUFFER REQUIREMENTS
Maintaining adequate distance between sources of potential contaminants and receiving waters/recharge areas is a fundamental and effective BMP for managing stormwater runoff and minimizing adverse water quality effects. Buffers are used as components of water quality protection strategies in many other karst and non-karst areas in the U.S. and are an important part of the strategy for the Cave Springs Direct Recharge Area. All buffer widths referenced in this chapter and the CSK Regulations are measured from the stream centerline or center of sensitive feature/area. For stream buffers, the buffer width is on both sides of the stream centerline (for example, a 100-foot buffer would actually have a total width of 200 feet, 100 feet on each side of the stream centerline). For “point” features, the buffer width is the radius projected from the center of the feature. Buffer requirements apply only to Zones 1, 2, and 3.
The Cave Springs Outer Buffer Width Adjustment Worksheet provides buffer widths and adjustment factors. The inner buffer width is fixed, but the outer buffer width can be reduced based on site-specific factors and BMPs. The worksheet form and an example are provided below.
6.0 STORMWATER BMP REQUIREMENTS
BMPs are required in all zones for protection of water quality during both construction and post- construction phases of development and for above ground and below ground potential contaminant sources. This section describes BMP requirements by zone for stormwater (construction and post- construction), wastewater, and others including construction dewatering and industrial discharges.
7.0. WASTEWATER BMP REQUIREMENTS
ACRONYMS
AASHTO American Association of State Highway and Transportation Officials
ARDOT Arkansas Department of Transportation
ASCE American Society of Civil Engineers
ASTM American Society for Testing and Materials
ASWCC Arkansas Soil and Water Conservation Commission
BMP Best Management Practice
CMP Corrugated Metal Pipe
CN Curve Number
CPP Corrugated Polyethylene Pipe
CWB Constructed Wetland Basin
DCIA Directly Connected Impervious Area
DEQ Arkansas Department of Energy & Environment Division of Environmental Quality
EDB Extended Dry Detention Basin
EOR Engineer of Record
EWDB Extended Wet Detention Basin
GB Grass Buffer
GS Grass Swale
IMP Integrated Management Practice
LID Low Impact Development
MBP Modular Block Porous Pavement
MEP Maximum Extent Practicable
MS4 Municipal Separate Storm Sewer System
NPDES National Pollutant Discharge Elimination System
POA Property Owners Association
PLD Porous Landscape Detention
PVC Polyvinylchloride
RCB Reinforced Concrete Box
RCHEP Reinforced Concrete Horizontal Elliptical Pipe
RCP Reinforced Concrete Pipe
SCS Soil Conservation Service
SLCCP Smooth Lined Corrugated Polyethylene Pipe
SLCMP Smooth Lined Corrugated Metal Pipe
STS Storm Sewer
TMDL Total Maximum Daily Load
TRM Turf Reinforcement Mat
UDC Unified Development Code
UDFCD Urban Drainage and Flood Control District
USACE United States Army Corps of Engineers
USDCM Urban Storm Drainage Criteria Manual
USFWS United States Fish and Wildlife Service
USEPA United States Environmental Protection Agency
WEF Water Environment Federation
WCRS Watershed Conservation Resource Center
WQCV Water Quality Capture Volume
DEFINITIONS
Basin: A hydrologic unit consisting of a part of the surface of the earth covered by a drainage system consisting of a surface stream or body of impounded surface water plus all tributaries.
Best Management Practices (BMPs): A wide range of structural treatment processes, pollution prevention practices, schedules of activities, prohibitions on practices, and other management practices. Nonstructural BMPs, such as preventative maintenance and preserving natural vegetation, are mainly definitions of operational or managerial techniques. Structural BMPs include physical processes ranging from diversion structures to silt fences to retention ponds.
Clean Water Act: Legislation that provides statutory authority for the National Pollutant Discharge Elimination System (NPDES) program; Public law 92-500; 33 U.S.C. 1251 et seq. Also known as the Federal Water Pollution Control Act.
Culvert: A short, closed (covered) conduit or pipe that passes stormwater runoff under an embankment, usually a roadway.
Design Storm: A rainfall event of specific depth, duration, intensity, and return frequency (e.g., the 1-year storm) that is used to calculate runoff volume and peak discharge rate.
Detention: The storage and slow release of stormwater from an excavated pond, enclosed depression, or tank. Detention is used for pollutant removal, stormwater storage, and peak flow attenuation. Both wet (permanent pool) and dry (completely drained between runoff events) detention methods can be applied.
Drainage Facility: Systems including but not limited to watercourses, constructed channels, natural channels, storm drains, culverts, and detention/retention facilities that are used for conveyance and/or storage of stormwater runoff. See also Stormwater Facility.
Erosion: When land is diminished or worn away due to wind, water, or glacial ice. Often the eroded debris (silt or sediment) becomes a pollutant via stormwater runoff. Erosion occurs naturally, but can be intensified by land clearing activities that remove established vegetation such as farming, development, road building, and timber harvesting.
Grading: Stripping, excavating, filling and/or stockpiling soil to shape land area for development or other purposes.
Grass Buffer: Uniformly graded and densely vegetated area of turf grass. This BMP requires sheet flow to promote filtration, infiltration, and settling to reduce runoff pollutants.
Grass Swale: Vegetated drainageway with low-pitched side slopes that collects and slowly conveys runoff. Design of longitudinal slope and cross-section size forces the flow to be slow and shallow, thereby facilitating sedimentation and promoting infiltration while limiting erosion.
Hydrologic Soil Group: Soils are classified by the Natural Resource Conservation Service into four Hydrologic Soil Groups based on the soil's runoff potential. The four Hydrologic Soils Groups are A, B, C and D. Where A's generally have the smallest runoff potential and Ds the greatest.
Hydrology: The science addressing the properties, distribution, and circulation of water across the landscape, through the ground, and in the atmosphere.
Inlet: An entrance into a ditch, storm culvert, or other conveyance.
Jointing and Bedding Aggregate: ASTM C-33 sand or another aggregate material for the use of in-fill between paver blocks as well as a leveling course for the blocks as specified by the paver blocks’ manufacturer’s specs.
National Pollutant Discharge Elimination System (NPDES): The national program under Section 402 of the Clean Water Act for regulation of discharges of pollutants from point sources to waters of the United States. Discharges are illegal unless authorized by an NPDES permit.
Nonstructural BMPs: Stormwater runoff treatment techniques that use natural measures to reduce pollution levels and do not require extensive construction efforts and/or promote pollutant reduction by eliminating the pollutant source.
Outfall: The point where wastewater or drainage discharges from a sewer pipe, ditch, or other conveyance to a receiving body of water.
Peak Flow: The maximum instantaneous discharge of a stream or river at a given location. It usually occurs at or near the time of maximum stage.
Peak Runoff Rate: The highest actual or predicted flow rate (measured in cubic feet per second) for runoff from a site for a given frequency event.
Receiving Waters: Natural or manmade water systems into which materials are discharged.
Retention Pond: A BMP consisting of a permanent pool of water designed to treat runoff by detaining water long enough for settling, filtering, and biological uptake. Retention (aka wet) ponds may also be designed to have an aesthetic and/or recreational value. These BMPs have a permanent pool of water that is replaced with stormwater, in part or in total, during storm runoff events. In addition, a temporary extended detention volume is provided above this permanent pool to capture storm runoff and enhance sedimentation. It requires a perennial supply of water to maintain the pool. Retention ponds are more common in larger catchments.
Runoff: Water from rain, melted snow, or irrigation that flows over the land surface.
Runoff Coefficient: A value ranging from 0.0 to 1.0 representing the fraction of precipitation volume that becomes runoff. The runoff coefficient, C, is used in the Rational Formula to calculate a peak flow rate (cfs) by multiplying the runoff coefficient by the rainfall intensity, I (inches/hour), and the tributary drainage area, A (acres). Q = CIA.
Sediment: Soil, sand, and materials washed from land into water, usually after rain. Sediment can destroy fish-nesting areas, clog animal habitats, and cloud water so that sunlight does not reach aquatic plants.
Slope: Angle of land measured in horizontal distance necessary for the land to fall or rise one foot, expressed by horizontal distance in feet to one vertical foot. Slope may also be expressed as a percent or decimal as the quotient of vertical elevation change divided by the horizontal distance over which the change occurs.
Stormwater Facilities: Systems including but not limited to watercourses, constructed channels, natural channels, storm drains, culverts, and detention/retention facilities that are used for conveyance and/or storage of stormwater runoff. See also Drainage Facility.
Stormwater Management: Functions associated with planning, designing, constructing, maintaining, financing, and regulating the facilities (both constructed and natural) that collect, store, control, and/or convey stormwater.
Stormwater: Precipitation that accumulates in natural and/or constructed storage and stormwater systems during and immediately following a storm event.
Structural BMPs: Devices that are constructed to provide temporary storage and/or treatment of stormwater runoff. Examples of structural BMPs used on construction sites include sediment basins, silt fence, and inlet protection.
Surface Water: Water that remains on the surface of the ground, including rivers, lakes, reservoirs, streams, wetlands, impoundments, seas, estuaries, etc.
Suspended Sediment: Soil particles that remain in suspension in water for a considerable period of time without contact with the solid fluid boundary at or near the bottom. They are maintained in suspension by the upward components of turbulent currents.
Traffic Areas: Any area used by vehicular traffic (cars, trucks, buses, etc.) to travel to destinations or gain access to such destinations; essentially any area where vehicular traffic could likely be anticipated to operate. Including but not limited to: paved and unpaved streets; residential, commercial, and industrial driveways; parking lots; etc.
Waters of the State: “Waters of the state” means all streams, lakes, marshes, ponds, watercourses, waterways, wells, springs, irrigation systems, drainage systems, and all other bodies or accumulations of water, surface and underground, natural or artificial, public or private, which are contained within, flow through, or border upon this state or any portion of the state.
Watershed: That geographical area that drains to a specified point on a watercourse, usually a confluence of streams or rivers (also known as drainage area, catchment, or river basin).
Wetlands: Areas that are inundated or saturated by surface or groundwater at a frequency and duration sufficient to support, and that under normal circumstances do support, a prevalence of vegetation typically adapted for life in saturated soil conditions. Wetlands generally include swamps, marshes, bogs, and similar areas. Classification of an area as a wetland depends on hydrology, soils and vegetation. The USACE has jurisdiction for determining areas that are or are not jurisdictional wetlands.
Purpose of the Chapter
The purpose of this Submittal Requirements chapter is to provide a means to standardize the plans and drainage reports for proposed improvements submitted to the City for review.
2.0 Drainage Report
The following items shall be included in the Drainage Report that accompanies each proposed improvement plan set submitted to the City.
- Project title and date.
- Project location – include the street address and a vicinity map.
- Project description – a brief description of the site drainage for the proposed project, including structural best management practices for water quality management.
- Description of best management practices, including location, surface footprint area, depth and material of section layers, and connection to the downstream stormwater system, as applicable. Project owner’s name, address and telephone number.
- Site area – to the nearest 0.1 acre.
- Site drainage – a brief description of the site drainage for the proposed project.
- Area drainage problems – provide a description of any know on-site, downstream or upstream drainage/flooding problems. Drainage problems may include, but not be limited to, infrastructure adjacent to or downstream/upstream from the site not adequately sized to handle runoff, stormwater facilities experiencing erosion and needing remediation, and known sources of flooding. If the development is found to exacerbate or contribute to existing known drainage issues or create additional issues upstream or downstream of the site, off-site improvements to adjacent drainage facilities may be required.
- Upstream and downstream drainage – pre- and post-developed drainage area maps as well as inlet area maps with the time of concentration flow paths and proposed and existing topography shown as appropriate.
- Summary of runoff – provide a table with the 1, 2, 5, 10, 25, 50 and 100-year storm flows for existing and proposed conditions (with and without detention if shown) and the proposed difference in flows.
- Calculations – provide copies of all calculations performed, including:
- Runoff flow calculations for the 1,2, 5, 10, 25, 50 and 100-year storm events (existing and proposed conditions),
- Coefficients or runoff curve numbers,
- Inlet calculations,
- Pipe or culvert calculations,
- Open-channel calculations including any flumes,
- Hydraulic grade line calculations,
- Water Quality Capture Volume (WQCV) calculations,
- Detention calculations including
- Basin sizing calculations
- Outlet structure design with release rates computations for the 1, 2, 5, 10, 25, 50 and 100-year storm events,
- Best management practices’ storage calculations or stage-storage capacity of the WQCV within onsite stormwater best management practices, as applicable.
- Operations and Maintenance manual, as applicable.
- Operations and Maintenance checklist and agreement letter signed by the project owner indicating perpetual maintenance, as applicable.
- Recommendations/Summary – description of any assumptions made in the calculations, drainage improvements to be made to the site or downstream/upstream of the site, and the expected effects of the project.
- Certification – all drainage reports shall be signed, sealed and dated by an engineer registered in the State of Arkansas and shall include the following certification:
I ___________________, Registered Professional Engineer No.___________ in the State of Arkansas, hereby certify that the drainage designs and specifications contained in this Report have been prepared by me, or under my responsible supervision, in accordance with the regulations of the City of Rogers, Arkansas, the Professional Engineers Registration Act of the State of Arkansas, and reflect the application of generally accepted standards of engineering practice. I further certify that the improvements outlined in this Report will not have any adverse effects to life or downstream properties. I understand that review of these plans is limited to general compliance with the City codes and regulations and does not warrant the engineer’s design or imply any liability to the City of Rogers for the designs contained herein.
_________________________________________
Signed and Sealed by Professional Engineer
- Should a development alongside a primary channel require a hydraulic and hydrologic analysis to model the impacts of the development on the overall watershed and the channel itself, a peer review of the model analysis from a qualified Professional Engineer may be required before final approval is granted from the City. The reviewer will be chosen by the City and a flat rate fee of five thousand dollars ($5,000.00) will be required to be paid to the City of Rogers to cover the cost of the peer review. The payment of the peer review fee will be received and filed with the Department of Community Development prior to Final Plat for a subdivision or issuance of the Certificate of Occupancy for a Site Development. Computer modeling software utilized must be found on the most up to date list of FEMA approved Hydrologic & Hydraulic Numerical Models Meeting the Minimum Requirement of National Flood Insurance Program.
3.0 As-built Drawings and Certifications
Final as-built plans and a certification letter shall be submitted to the City’s Planning Office upon completion of all work for the drainage improvements. The certification letter shall be signed and sealed by the engineer of record affirming that all improvements have been constructed as shown in the as-built plans which shall conform to the approved construction plans except for modifications approved through the City. All improvements must be in place and as-built plans, certifications, one-year maintenance bond for 100% of the cost of drainage improvements and easements provided to the City Planner prior to Final Plat for a subdivision or issuance of the Certificate of Occupancy for a Site Development. Drainage improvements that are incomplete or fail an inspection must be completed and pass a reinspection and may not be bonded as a performance bond. As-built plans shall be based on surveyed data of the constructed improvements. As-builts will be submitted on:
- An AutoCAD .dwg file formatted to AutoCAD 2013 or earlier
- One PDF copy of as-built plans and drainage report
- Shapefile information per the Engineering Manual
1.1 Benefits of Stormwater Planning
If drainage planning is incorporated after other decisions have been made related to the layout of a new project, costly drainage and urban space allocation problems may result that are difficult to correct. In contrast, if drainage planning is incorporated into the initial stages of an urban design, the benefits that result from a well-planned storm drainage system are numerous and include the following:
Improved functionality of drainage system
- Minimized increases in peak flow rates, diversions, improper discharges, and other actions that can potentially harm neighboring properties
- Minimized constrictions to flow conveyance and storage
- Improved water quality
- Protection and enhancement of environmentally sensitive areas
- Improved public health, safety and welfare
Reduced development costs
- Reduced storm drainage system construction and maintenance costs
- Reduced excavation, fill, and grading costs
- Reduced street construction and maintenance costs
- Reduced costs for open space and parks
Improved building sites and land use
- Improved building sites for residential and commercial development
- Improved aesthetics of overall development and increased opportunities to make the storm drainage system a development amenity
- Increased recreational opportunities
1.2 Master Planning
Watershed plans identify requirements for flood control, detention, and water quality management throughout a watershed. As watershed plans are completed and made available to the public, developments can be designed in accordance with the plans, which provide a basis for the proper location and sizing of inlets, pipes, detention basins, and Best Management Practices (BMPs) that are necessary to effectively control downstream flooding and meet water quality requirements. These factors will have a direct bearing on the layout of a new development.
During the master planning phase, major decisions are made related to drainage that address factors such as design velocities, locations of structures, open space allocation for drainages, and integration of drainage features with recreational uses. Potential alternate uses for stormwater facilities, such as parks or open space, are identified for open channels, detention facilities, and water quality facilities. In addition, the master planning phase involves making decisions whether to use downstream or upstream detention storage, and the use of either off-stream or in-channel ponds or reservoirs. It is noted that off-channel detention is preferred and on-line detention requires approval by the City staff during the conceptual phase of the development process.
1.3 Categories of Stormwater Planning
Major Drainage System - The major drainage system frequently consists of open channels, as either stabilized natural waterways, modified natural channels, or artificial channels with grass or other lining; alternatively, the major drainage system may also include closed conduits such as box culverts or large pipes. When well-planned, the major system can reduce or eliminate the need for underground storm sewers, and can protect an urban area from extensive property damage, injury, and loss of life from flooding.
The major drainage system exists in a community regardless of whether it has been planned and regardless of where development is located. The planning process can best serve the community by ensuring that natural drainageways are maintained along major drainage routes. Floodplain delineation and zoning are tools that should be used freely to designate major drainageways. Small waterways and valleys lend themselves to floodplain regulations in the same manner as larger creeks.
Minor Drainage System - The minor drainage system, or initial system, consists of grass and paved swales, streets and gutters, storm sewers, and smaller open channels. If properly planned and designed, the minor drainage system can eliminate many "complaint" calls to the city. A well planned minor drainage system provides convenient drainage, reduces costs of streets and storm sewers, and has a direct effect on the orderliness of an urban area during runoff events.
Planning of urban drainage features should proceed on a well-organized basis with a defined set of drainage policies that have the backing of suitable ordinances. The policies presented in this Manual provide a basis upon which additional localized and specific policies can be built.
2.1 Stormwater Planning Objectives
The primary objective of stormwater drainage design is the protection of public health, safety, and welfare. Stormwater systems should be designed to minimize the potential for health risks associated with stormwater systems and runoff and should minimize the risk of damage to both public and private property, including minimizing the risk of structure inundation. Streets and the minor drainage system should be designed for the safe and efficient movement of traffic to the maximum extent practicable. Consideration should also be given to the public health and welfare benefits that result from the protection of water quality and other environmental characteristics of a watershed.
2.2 Watershed Approach for Stormwater Planning
The water resources of a watershed are affected by all who conduct activities within it and, therefore, all should be a part of the process to care for its water resources. Stormwater drainage is independent of government boundaries and, hence, stormwater system planning and implementation should include coordination with all affected agencies, communities, and neighborhoods within the watershed, regardless of government boundaries. The watershed approach to stormwater drainage and management has been embraced by the U.S. Environmental Protection Agency (USEPA) and many other agencies and communities across the country.
2.3 Compatibility with Other Planning Objectives
In addition to protecting public health, safety and welfare, the stormwater drainage system must consider other urban planning objectives. Stormwater system planning and design for any new development must be compatible with watershed master plans and objectives and be coordinated with plans for land use, open space, transportation, and other community objectives. Watershed master plans must consistently address both stormwater quantity and quality issues in the context of the local and regional drainage basins.
2.4 Space Allocation for Flood Control
Flood control is primarily an issue of space allocation. The amount of stormwater runoff present at any time in an urban watershed cannot be compressed or diminished. Open and enclosed storm systems serve both conveyance and storage functions. If adequate provision is not made for drainage space requirements, stormwater runoff may conflict with other land uses and result in damage to public and private property and the impairment or disruption of other urban systems. In urban watersheds that have been developed without adequate stormwater planning, there is generally inadequate space available to construct detention storage facilities to reduce peak flows significantly along major waterways. Creation of adequate space to construct such storage facilities frequently requires the removal of valuable existing buildings or other facilities and is often not economically or socially feasible.
2.5 Floodplain Preservation
Floodplains should be preserved wherever feasible and practical to maintain naturally occurring stormwater storage. Floodplains serve as natural outfall areas for urban drainage, riparian corridors, and habitat for diverse ecological systems. Encroachment into floodplains should be avoided and should occur only after careful planning and engineering have been conducted so that the effects are fully recognized and minimized. Preservation of urban floodplains provides value to communities through flood hazard reduction, water quality enhancement, stream protection, preservation of plant and animal habitat, creation of open spaces and linear parks, and provision of recreational opportunities. When determining the width of a floodplain to preserve, consideration should be given to the intended use of the floodplain and the dynamic nature of stream channels.
As discussed in the Chapter Summary, the City has compiled a list of incentives to be considered during rezone or site development applications to encourage developers to not develop all or portions of a floodplain on their project. A list of these incentives along with additional detail describing suggested criteria to be used during negotiations is provided in Table SWP-1. The magnitude and combination of how these incentives are used is at the City’s discretion. The City recommends that the owner/developer meet with City staff to determine the total incentives that will be allowed.
2.6 Stream and Riparian Corridor Preservation
Streams and riparian corridors should be maintained as they naturally occur to the maximum extent practical. Providing buffers between valuable riparian corridors and urban development promotes filtering of pollutants from urban runoff before it enters a stream. Each site’s development plan should include careful consideration to preserve and enhance natural features, including riparian corridors, to the maximum extent practicable. Consideration should be given to environmentally sensitive stream stabilization in areas where urbanization, altered hydrology, or soil characteristics result in unstable natural channel conditions. In certain cases, urban hydrologic conditions will require structural stabilization of streams to avoid degradation. These improvements should be completed in an aesthetic and environmentally sensitive manner.
In December 2009 the Watershed Conservation Resource Center (WCRC) submitted its final report on “Sediment and Nutrient Evaluation of Blossom Way Branch” to the City of Rogers. This report and study consisted of “1) Conducting a land use analysis of Blossom Way Watershed; 2) Developing streambank erosion prediction curves for the Osage Creek basin and evaluating streambank erosion occurring on Blossom Way tributary; and 3) Assessing watershed conditions for sediment and nutrients.” (WCRC 2009). A copy of the final report and related materials can be viewed at the City’s Engineering and Planning office. Additionally, the City has incorporated the information obtained and prepared from this study into the City’s GIS (http://gis.rogersar.gov). The information displayed on the GIS shows BEHI and NBS Ratings which are indications of how badly and likely the streambank in certain locations within the stream will erode.
The intent of discussing and providing information about this study is to make designers aware that information does exist about the condition of local streambanks within the City. Designers should review the information and maps provided in WCRC’s report whenever they have a project in the vicinity of a stream that was studied in this report. It is the responsibility of the design engineer to make sure that their project and its discharge amounts and discharge locations do no additional harm to streambanks in vicinity of the project.
2.7 Major and Minor Drainage Systems
Every urban area has a minor and a major drainage system, whether or not they are actually planned or designed. Generally, the minor and major drainage systems have distinctly different design criteria based on public health, safety and welfare, and economic considerations. The minor drainage system is typically designed to accommodate moderate flooding. For minor drainage systems, local street flooding resulting from extreme, less frequent rainfall events may be permissible for short periods, provided that public health, safety, and welfare are protected, and structures are protected from inundation. The major system will generally have a higher design standard to minimize the impacts of flooding from more severe, less frequent floods. This approach is used because of the greater potential threat to public health, safety, and welfare that generally exists along major waterways.
2.8 BMPs to Mitigate Impacts
Impacts of urbanization should be reduced through the use of Best Management Practices (BMPs). In general, urbanization tends to increase downstream peak flows, runoff volumes, and runoff velocities, which can cause the capacity of inadequately designed downstream systems to be exceeded and can disrupt natural waterways. The impacts of new urbanization must be reduced through the use of structural and non-structural BMPs that typically include stormwater detention to limit peak flow rates to predevelopment rates. Detention facilities may be constructed either on-site or as regional facilities. Regional facilities developed by the City will be constructed and evaluated as the need arises. It will be up to the City to determine the need and location of any regional detention they see as a cost effective and useful tool for controlling stormwater runoff in nuisance/flooding prone areas of the city. Other BMPs include hydraulically disconnecting impervious areas to the extent practicable to achieve maximum contact between runoff and vegetation, thereby maximizing infiltration and filtering of pollutants. While it is generally not practical to maintain predevelopment runoff volumes, accepted stormwater BMPs should be used to the maximum extent practicable to minimize runoff volume. For redevelopment projects, consideration should be given to retrofitting the existing stormwater controls as necessary, given the size of the redevelopment project and its location within the watershed.
2.9 Sustainability and Maintenance
The stormwater drainage system should be designed for sustainability, with careful consideration given to the need for accessibility and maintenance to sustain adequate function, whether the facilities will be publicly or privately maintained. The major drainage system is more likely to be maintained by a public entity, whereas the minor system is more often maintained by a private entity. Parts of the major system that serve specific functions for private entities, should be maintained by those private entities. Failure to provide proper maintenance reduces both the hydraulic capacity and the pollutant removal efficiency of the drainage system. Planning and design of drainage facilities should include consideration of the funding necessary to provide proper maintenance.
2.10 Consideration of Downstream Impacts
A stormwater drainage system should be designed beginning with the point of discharge, with careful consideration given to downstream impacts and the effects of off-site flows. The location and method of discharge from a development site must be carefully determined to avoid causing harm to properties located either downstream or adjacent to the site. The engineer should evaluate the conveyance system downstream of each point of discharge from a new development to ensure that it has sufficient capacity for design discharges without adverse backwater or downstream impacts such as flooding, stream bank erosion, and sediment deposition. If the development is found to exacerbate or contribute to existing known drainage issues or create additional issues upstream or downstream of the site, off-site improvements to adjacent drainage facilities may be required. In addition, great care must also be taken to determine the method of receiving, conveying, and discharging stormwater runoff that originates from off-site.
3.1 Initial Major Drainage Planning
When planning a new development, a variety of drainage concepts should be evaluated prior to determination of the location of streets and lot layout. Decisions made at this point in the development process have the greatest impact regarding the cost and performance of the drainage facilities.
Developments should be designed around the existing natural drainage patterns and topography to achieve the most efficient drainage system. The designer should begin by determining the location and width of existing waterways and floodplains. A preliminary estimate of the design flow rate is necessary to approximate the capacity and size of a channel or conduit (See Chapter 3 - Determination of Stormwater Runoff).
Streets and lots should be laid out in a manner that preserves the existing drainage system to the greatest extent practical. Constructed channels should only be used when it is not practical or feasible to use existing waterways. Proposals to modify major natural waterways should be submitted to the City for approval prior to detailed design. In such cases, it must be shown why it is not feasible to preserve the natural major drainageway.
3.2 Open Channels
The use of open channels for major drainageways can provide significant advantages, compared with closed conduits, in terms of cost, capacity, potential for recreational uses, aesthetics, environmental protection/enhancement, and detention storage. Disadvantages of open channels compared with closed conduits include increased space and right-of-way requirements and additional maintenance needs associated with channel instability.
Open channels in new developments typically fall in one of the following categories:
Existing natural channels
- Existing natural channels that are stable and are expected to remain stable and are being preserved in a natural state.
- Existing natural channels that are unstable or are not expected to remain stable because of changes in the watershed and are being stabilized with bioengineering methods to maintain the natural character of the channel.
Existing or proposed semi-improved channels
- Existing or proposed semi-improved channels where some modifications are made, such as grading, but the channel appears to be natural and is lined with vegetation such as grass and trees.
Existing or proposed improved channels
- Existing or proposed improved channels with a natural lining, such as a trapezoidal grass channel that is mowed on a regular basis. An improved channel may include a small, concrete low-flow channel to reduce erosion and allow the grade to be maintained.
- Existing or proposed improved channels where a hard lining such as concrete, rock or other hard armor material makes up a significant part of the channel. Examples include rectangular or trapezoidal channels lined with riprap or concrete.
The volume of storm runoff, peak discharge rate, and frequency of bank-full discharges from an urban area are often larger than under historic, undeveloped conditions, depending on the nature of the development (Leopold 1994; Urbonas 1980; ASCE and WEF 1992; WEF and ASCE 1998). When natural channels begin to carry storm runoff from a newly urbanized area, the changed runoff regime may result in new and increased erosional tendencies.
Careful hydraulic analysis of natural channels must be made to assess and address these potential impacts. Some modification of the channel is frequently required to create a more stabilized condition to withstand changes to surface runoff created by urbanization. Channel modifications should not be undertaken unless they are found to be absolutely necessary. The objective is to avoid excessive and extensive channel disturbance and the subsequent negative impacts on erosion, sediment deposition, and water quality.
Factors to consider when choosing between using the existing channel or making improvements to the channel include:
- Required channel capacity for flood control compared with the existing channel capacity
- Space availability within the development
- Recent and expected changes in upstream runoff from the contributing watershed
- Physical characteristics of the natural channel such as slope, soil characteristics, and vegetative condition
Measures to stabilize a natural channel frequently include construction of grade controls or drop structures at regular intervals to decrease the longitudinal slope of the thalweg (channel invert), thereby controlling erosion. Bank and bottom stabilization measures may also be necessary.
If site conditions are conducive, channels should be left in a condition that resembles the natural state to the extent feasible, provided it can be demonstrated that the channel is stable during the 25-year event. It is preferred that natural channels be preserved or stabilized through bioengineering methods. If bioengineering methods are not feasible, improved grass channels are generally preferred to channels with a hard lining, except where armoring is necessary because of the physical or hydrologic characteristics of the site. Benefits of a stabilized natural channel can include:
- Lower flow velocities
- Longer concentration times and lower downstream peak flows
- Channel and adjacent floodplain storage that tends to decrease peak flows
- Protection of riparian and aquatic habitat
- Greenbelt and recreational area that adds significant social benefits
Specific design criteria along major drainageways are provided in Chapter 6 – Open Channel Flow Design.
3.3 Floodplain Management and Regulation
Floodplain management and regulation is necessary for a government to exercise its duty to protect the health, safety, and welfare of the public. The concept of the existence of a natural floodway fringe for the storage and passage of floodwaters is fundamental to the assumption of regulatory powers in a definable flood zone. Floodplain regulation must define the boundary of the natural floodway fringe and must delineate easement occupancy that will be consistent with public interests.
4.1 Site Drainage
The initial collection system within a development may include curbs, gutters, inlets, swales, pipes, flumes, channels, open waterways, detention, and water quality BMPs. The collection system is critical to the protection of adjacent streets and properties from flooding. The objective of the site collection system is to completely collect, control, and convey the required design storm for specific street classifications (see Chapter 4 – Storm Sewer System Design) and protect properties adjacent to streets during runoff from storms up to the 100-year design flow.
Discharges from the site must connect directly to the existing drainage system where possible, as opposed to discharging to the street. Provision must be made to protect streets and sidewalks from flooding. Discharges to the street should not exceed the street design criteria and discharges across a sidewalk must protect the sidewalk from inundation up to the 2-year flow.
4.2 Streets, Inlets and Storm Sewers
Streets serve as part of the initial collection system in an overall drainage system. The objective of street drainage design is to reasonably minimize inconvenience to the traveling public, provide for safe passage of emergency vehicles during runoff from storms up to a 100-year event, and prevent the overflow of runoff from streets onto private property (unless in an easement) during runoff from storms up to a 100-year event. Well-planned street location and preliminary design can greatly reduce street drainage improvement construction costs.
Inlets must be properly selected and designed to minimize the possibility of clogging and to limit spread based on the street classification. Typical inlet types include curb opening inlets, open-side drop inlets and grated inlets. (See Chapter 4 - Storm Sewer System Design, for detailed design criteria.) Site storm sewer pipes and box culverts must be designed to convey flow from the design storm frequency associated with site specific infrastructure as described in Chapter 4 – Storm Sewer System Design and Chapter 7 – Culvert and Bridge Hydraulic Design.
4.3 Site Detention
Any development that increases runoff must address runoff through construction of onsite detention or other compensatory measure approved by the City. Detention for flood control is designed to prevent increases in peak flow from the 1-, 2-, 5-, 10-, 25-, 50- and 100-year storms. Onsite detention should be located at the low point(s) on the site and shall discharge to a public right-of-way or drainage easement.
Detention basins should be planned to match existing topography to minimize cut and fill, land disturbance, and environmental impacts. Aesthetics should also be considered during design so that the facility complements surrounding land uses. In all cases, opportunities should be sought to create amenities with detention basins by utilizing permanent pools, gentle slopes, landscaping, and trees and incorporating multi-purpose uses, such as recreation. Design criteria for detention basins are provided in Chapter 5 - Detention Design.
In-line detention that collects offsite runoff should be avoided, particularly when the volume of runoff from offsite is greater than the volume from onsite. Larger offsite areas draining through a detention basin cause increased requirements for volume and control structure size, resulting in higher basin construction costs. In addition, in-line detention basins along major drainageways may require a U.S. Army Corps of Engineers (USACE) Section 404 Permit. Therefore, it is preferred to have off-line detention with the waterway preserved in a more natural state. The use of in-line detention as a means to control stormwater runoff requires City approval prior to implementation.
As an alternative to constructing onsite detention, a payment in lieu of constructing detention may be acceptable by the City, but only if an existing regional detention facility with adequate capacity, as determined by the City, exists downstream from the proposed development or as determined by the City. The funds collected from fee-in-lieu payments will be used by the City for regional stormwater facilities or other measures that will benefit the stormwater management in the community.
Permanent pool detention basins are encouraged because they provide added benefits with respect to water quality, aesthetics and habitat. When designed and constructed properly, permanent pool detention basins can be an amenity to both the development and the community. Detailed design criteria for permanent pool detention areas are provided in Chapter 5 - Detention Design.
Detention basins sited on or near the upstream portion of a site to reduce offsite peak runoff may be considered as an option to compensate for increased peak runoff from the site in cases where the low point of the site is not conducive to detention facilities. It must be shown that the total peak runoff rates for the design storms at locations downstream of the site are no greater than pre-development conditions. Careful attention must be given to the timing of peak runoff; a conservative design may be appropriate to assure that peak flow rates are not increased because of inaccurate modeling of the peak timing.
4.4 On-Site Best Management Practices
Stormwater quality and quantity (rate and volume) are closely related and should be planned and designed concurrently. Stormwater quality BMPs are required on new developments to reduce adverse impacts on downstream water quality and to meet the requirements of the City’s federally-mandated National Pollutant Discharge Elimination System (NPDES) Municipal Separate Storm Sewer (MS4) permit. Planning for a new development should include determination of the BMPs to be used, which commonly include extended or wet detention basins, disconnecting impervious areas, and utilizing grass buffer strips, swales, and channels.
BMPs should also include open channel designs that both filter runoff and maintain long-term stability, thereby reducing pollutants and sediment. Detailed design criteria for several common water quality BMPs are provided in Chapter 9 - Water Quality. Design criteria for open channels that provide stable channel linings and reduce the amount of impervious area are provided in Chapter 6 - Open Channel Flow Design.
8.1 Subdivisions
Submittal requirements for subdivision development in the City of Rogers are specified in Chapter 14 of the Code of Ordinances for the City. Early planning for a new subdivision should include meeting with the Department of Community Development to develop an acceptable stormwater management plan that will be less likely to experience problems in the review process and will result in a more efficient and optimum storm water design. Major conceptual storm water issues can be identified to help with development of a design that can maximize flood control and water quality protection and minimize project costs and future conflicts and construction difficulties.
Major design features that should be identified first are the preservation of major drainageways, the location and configuration of detention basins and water quality controls, and the location and configuration of streets and lots. Any watershed plans affecting the development should be identified so that compliance approach can be incorporated early in the design process. The developer should obtain a copy of the Preliminary Plat checklist from the Department of Community Development , to begin preparation of acceptable stormwater drainage plans and plat layout.
8.2 Site Development Plans
Submittal requirements for a Site Development Plan (SDP) in the City of Rogers are specified in the Unified Development Code for the City. In accordance with the ordinance, storm drainage design for an SDP must meet the minimum drainage requirements as defined by city ordinance. Drainage improvements must be indicated on the plans and a drainage report must accompany the plans. An engineer's certified calculations must be provided for all improvements. Improvements must be completed and certified by the engineer of record prior to the issuance of a certificate of occupancy.
Developments within a floodplain or floodway must provide floodplain data certified by an engineer or architect and must meet all FEMA requirements for new construction in floodplains or floodways.
Purpose of Chapter
The intent of this chapter of the Manual is to provide reasonably dependable and consistent methods of approximating the characteristics of runoff in urban and nonurban areas within the City of Rogers, Arkansas. This chapter will guide the designer in how to choose the proper method for calculating runoff, based on the conditions present at a site as well as the necessary information/calculations the City requires for their review prior to development of the site.
City Allowable Methods for Calculating Runoff
The City allows the use of three different methods for calculating urban runoff: (1) The Rational Method, (2) the Soil Conservation Service Technical Release – 55 Synthetic Hydrograph Method (SCS method), and (3) Computer models such as HEC-HMS, TR-20, or equivalent. It is the responsibility of the design engineer to properly choose which method(s) to implement for drainage design of a site and then to properly execute that design methodology.
Engineering Design Prerequisite
This chapter of the Manual should be utilized in conjunction with other universally accepted articles and engineering references and studies. NRCS Technical Release 55 is referenced extensively throughout this chapter as it is an excellent resource for urban hydrology design and methodology. It is important for the individual using this section of the manual to already have a firm understanding of the information provided in this document prior to implementing the recommendations outlined in this Manual.
Summary of Critical Design Criteria
The summary below outlines some of the most critical design criteria essential to design engineers for calculating stormwater runoff according to City of Rogers requirements. The information below contains exact numerical criteria as well as general guidelines that must be adhered to during the design process. This section is meant to be a summary of critical design criteria for this section; however, the engineer is responsible for all information in this chapter. It should be noted that any design engineer who is not familiar with Rogers’ drainage manual and its accepted design techniques and methodology should review the entirety of this chapter.
Watershed Size Applicability for Peak Runoff Calculations
Watershed Size (acres) | Applicable Drainage Method |
|---|---|
0 to 30 | Rational Method |
30 to 2000 | SCS Method |
2000 + | Computer models (such as HEC-HMS, TR-20, or equivalent) |
Rational Method
- Refer to Section 2.0 for more detailed information/explanation
- Rational Method Formula: Q = ki*C*I*A
- Refer to Table RO-2, Table RO-3, and Table RO-4 for more detailed information
Runoff Coefficient, C, for Specific Rogers Zoning
Rogers Zoning | Description | Runoff Coefficient, C |
|---|---|---|
T2 | Agricultural | 0.40 |
T3.1 | Residential Estate | 0.45 |
T3.1 | Residential Single Family | 0.55 |
T3.2; T4.1 | Residential Affordable Housing | 0.60 |
T3.2; T4.1 | Residential Duplex and Patio Home | 0.65 |
T4.2; T5.1 | Residential MultiFamily | 0.75 |
T3.2; T4.1 | Neighborhood Residential | 0.60 |
T4.2 | Manufactured Home Community | 0.70 |
T4.2 | Residential Office | 0.80 |
T5.1 | Office | 0.90 |
T5.1; T5.2; T6.1 | Highway Commercial | 0.90 |
T4.2; T5.1 | Neighborhood Commercial | 0.80 |
HC | Open Display Commercial | 0.90 |
HC | Warehouse Office | 0.90 |
I-1 | Light Industrial | 0.90 |
I-2 | Heavy Industrial | 0.95 |
Church | 0.80 | |
School | 0.80 | |
Park | 0.40 | |
Cemetery | 0.40 |
Runoff Coefficient, C, for Composite Land/Surface Areas
Character of Surface | Description | Runoff Coefficient, C |
|---|---|---|
UNDEVELOPED AREAS | Historic Flow Analysis, Greenbelts, Agricultural, Natural Vegetation | |
Clay Soil | ||
Flat, 2% slopes . . . . . . . . . . . . . . . . . . . . | 0.30 | |
Average, 2 - 7% slopes . . . . . . . . . . . . . . | 0.40 | |
Steep, 7% slopes . . . . . . . . . . . . . . . . . . | 0.50 | |
Sandy Soil | ||
Flat, 2% slopes . . . . . . . . . . . . . . . . . . . . | 0.12 | |
Average, 2 - 7% slopes . . . . . . . . . . . . . . | 0.20 | |
Steep, 7% slopes . . . . . . . . . . . . . . . . . . | 0.30 | |
STREETS | Paved . . . . . . . . . . . . . . . . . . . . . . . . . . . . . . . . | 0.98 |
Gravel . . . . . . . . . . . . . . . . . . . . . . . . . . . . . . . | 0.60 | |
DRIVES & WALKS | 0.98 | |
ROOFS | 0.98 | |
LAWNS | Clay Soil | |
Flat, 2% slopes . . . . . . . . . . . . . . . . . . . . | 0.18 | |
Average, 2 - 7% slopes . . . . . . . . . . . . . . | 0.22 | |
Steep, 7% slopes . . . . . . . . . . . . . . . . . . | 0.35 | |
Sandy Soil | ||
Flat, 2% slopes . . . . . . . . . . . . . . . . . . . . | 0.10 | |
Average, 2 - 7% slopes . . . . . . . . . . . . . . | 0.15 | |
Steep, 7% slopes . . . . . . . . . . . . . . . . . . | 0.20 |
Frequency Factor Multiplier, ki
Recurrence Interval (years) | Adjustment Multiplier ( ki ) |
|---|---|
1 to 10 | 1.0 |
25 | 1.1 |
50 | 1.2 |
100 | 1.25 |
Use the included Weighted C spreadsheet for all composite analysis.
Rainfall Intensity
- Refer to Section 2.6 for more detailed information/explanation
- Refer to Table RO-5 for Rainfall Intensity-Duration-Frequency (IDF) Chart
Time of Concentration, tc
- Refer to Section 2.8 for more detailed information/explanation
- Minimum tc = 5-minutes for an urban watershed and 10-minutes for a non-urban watershed
- Time of Concentration equation: tc= to + ts + tt
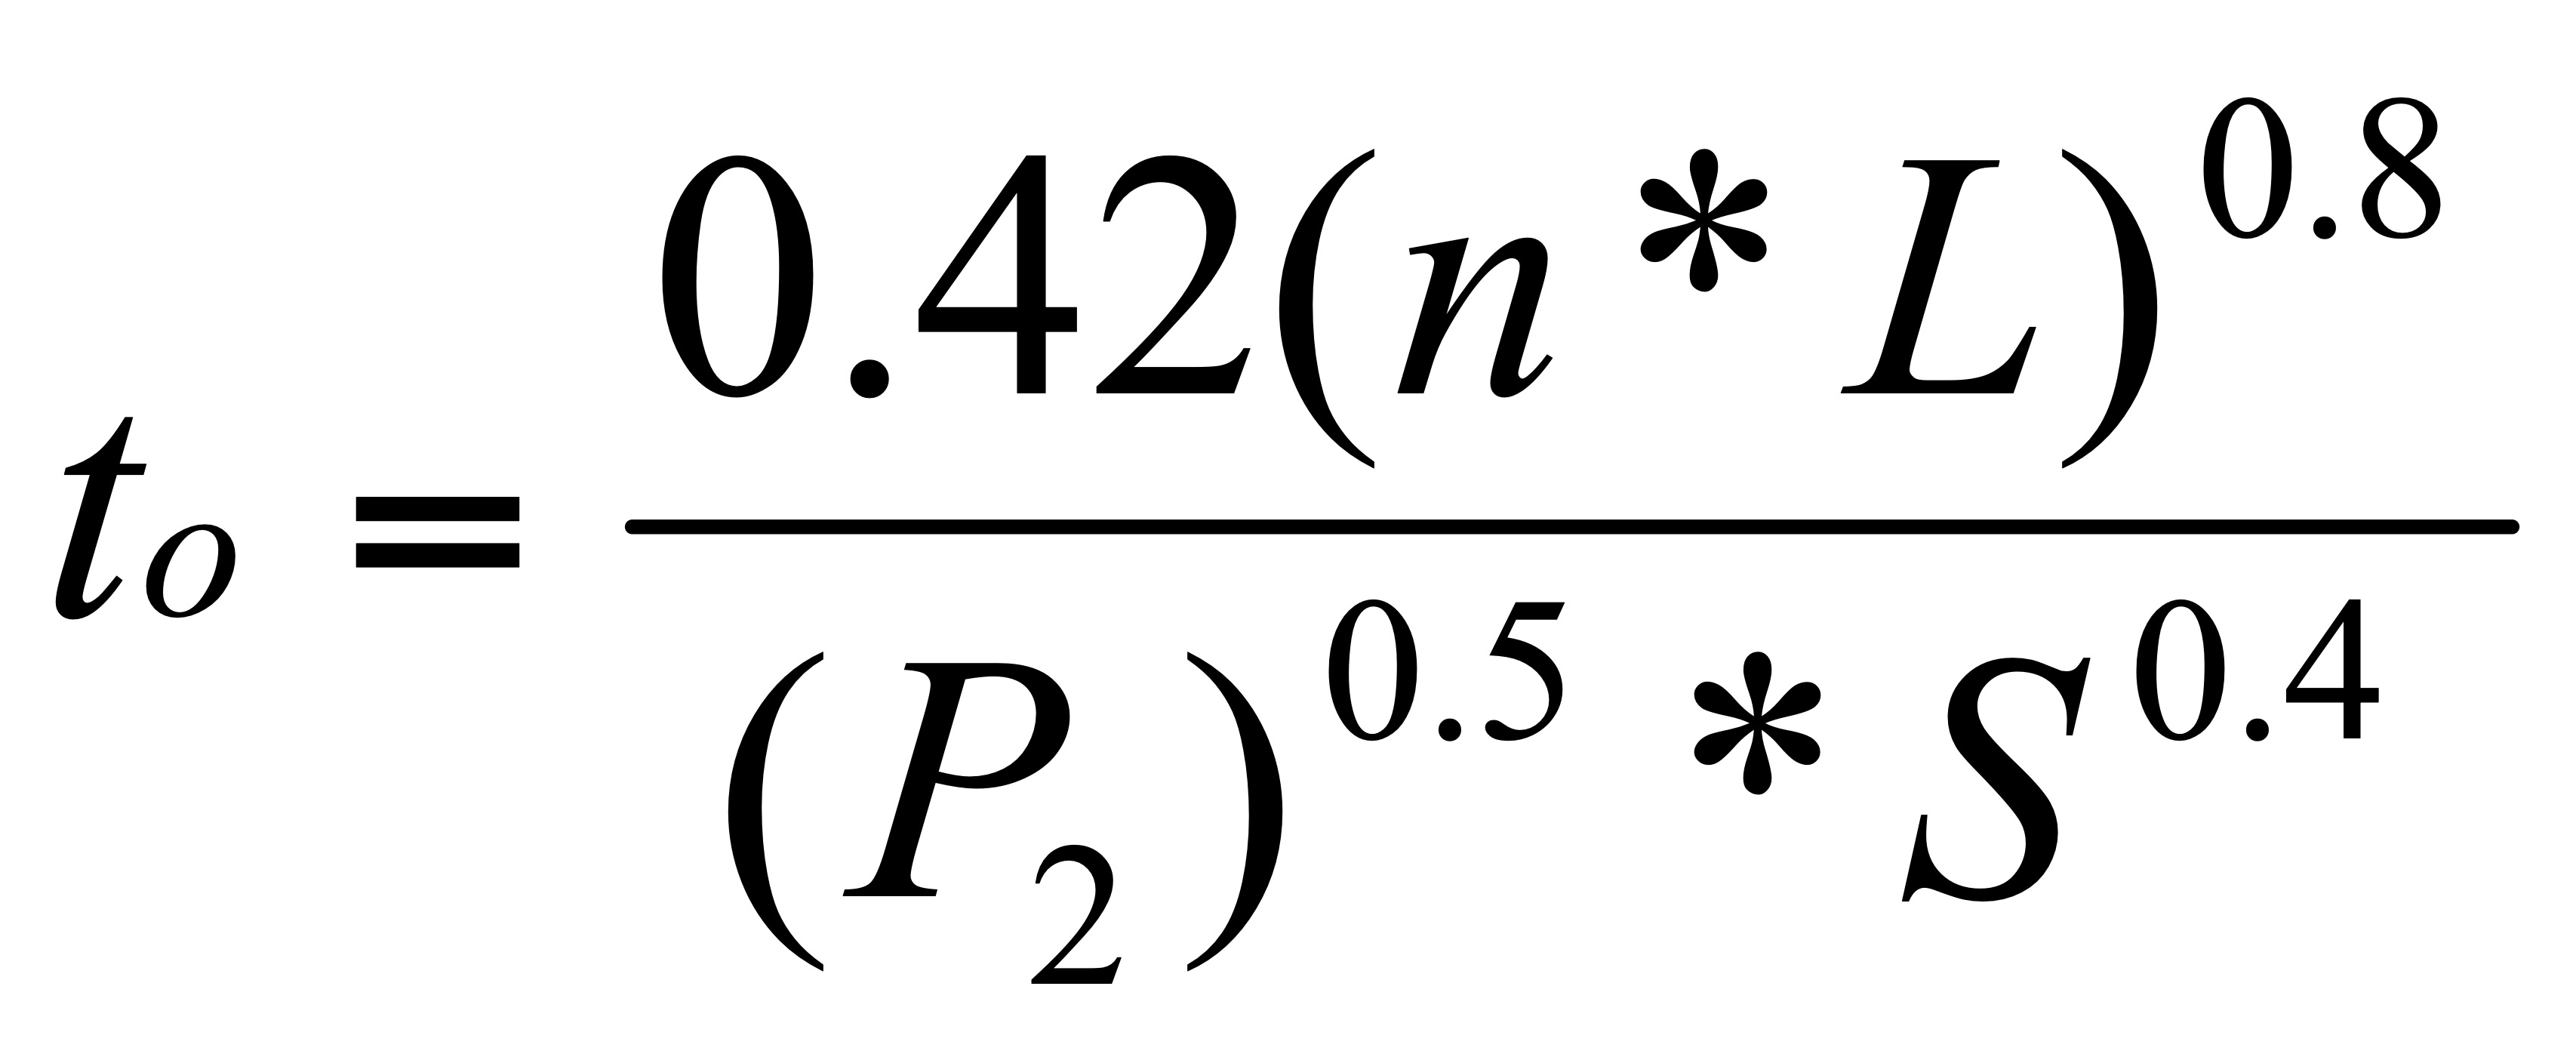
- to = overland flow time (minutes)
- n = Manning’s roughness coefficient (Table RO-6)
- L = length of overland flow in feet (300-ft maximum in non-urban areas; 100-ft maximum in urban areas)
- P2= 2-year, 24-hour rainfall (inches) calculated from Table RO-5 (or obtained from Table RO-9)
- S = average basin slope (ft-per-ft) expressed as a decimal
Manning’s Values of Roughness Coefficient n for Overland Flow (same as Table RO-6)
Surface Description | n1 |
|---|---|
Smooth surfaces (concrete, asphalt, | |
gravel, or bare soil) . . . . . . . . | 0.011 |
Fallow (no residue) . . . . . . . . . . . . . | 0.05 |
Cultivated Soils: | |
Residue cover ≤ 20% . . . . . . | 0.06 |
Residue cover > 20% . . . . . . | 0.17 |
Grass: | |
Short grass prairie . . . . . . . . | 0.15 |
Dense grasses 2 . . . . . . . . . | 0.24 |
Bermuda grass . . . . . . . . . . | 0.41 |
Range (natural) . . . . . . . . . . . . . . . | 0.13 |
Woods: 3 | |
Light underbrush . . . . . . . . . | 0.40 |
Dense underbrush . . . . . . . . | 0.80 |
1 The n values are a composite of information compiled by Engman (1986). 2 Includes species such as weeping lovegrass, bluegrass, buffalo grass, blue grama grass, and native grass mixtures. 3 When selecting n, consider cover to a height of about 0.1 ft. This is the only part of the plant cover that will obstruct sheet flow. | |

- ts = shallow concentrated flow time (minutes)
 (Paved Areas)
 (Unpaved Areas)
- where V is calculated from Manning’s equation (use Table RO-7)
- tt = channel flow time (minutes)
Manning’s Values of Roughness Coefficient n for Open Channels (same as Table RO-7)
Type of Channel and Description | Minimum | Normal | Maximum | |
|---|---|---|---|---|
Lined or built-up channels | ||||
Concrete, float finish | 0.013 | 0.015 | 0.016 | |
Concrete, concrete bottom | 0.020 | 0.030 | 0.035 | |
Gravel bottom with riprap | 0.023 | 0.033 | 0.036 | |
Brick, glazed | 0.011 | 0.013 | 0.015 | |
Excavated or dredged canal | ||||
Earth, straight and uniform - short grass | 0.022 | 0.027 | 0.033 | |
Earth, winding, sluggish - dense weeds | 0.030 | 0.035 | 0.040 | |
Rock cuts, jagged and irregular | 0.035 | 0.040 | 0.050 | |
Channels not maintained, weeds and brush uncut | 0.050 | 0.080 | 0.120 | |
Natural Streams | ||||
Clean, straight, full stage | 0.025 | 0.030 | 0.033 | |
Clean, winding, some pools and shoals | 0.033 | 0.040 | 0.045 | |
Sluggish reaches, weedy, deep pools | 0.050 | 0.070 | 0.080 | |
Mountain stream steep banks; gravel and cobbles | 0.030 | 0.040 | 0.050 | |
Mountain stream steep banks; cobbles with large boulders | 0.040 | 0.050 | 0.070 | |
Floodplains | ||||
Pasture, no brush, high grass | 0.030 | 0.035 | 0.050 | |
Brush, scattered brush, heavy weeds | 0.035 | 0.050 | 0.070 | |
Brush, medium to dense brush in summer | 0.070 | 0.100 | 0.160 | |
Trees, dense willows, summer, straight | 0.110 | 0.150 | 0.200 | |
Trees, heavy stand of timber | 0.080 | 0.100 | 0.120 | |
SCS Curve Number Method
- Refer to Section 3.0 for more detailed information/explanation
- SCS Method equation:
 where,
 - Q = runoff (inches)
- P = rainfall depth from Table RO-9
- S = potential maximum retention after runoff begins (inches)
- where,

- where,
- Ia = initial abstraction (inches)
- where,

- where,
- CN = runoff curve numbers (see Table RO-10 and Table RO-11 for urban and non-urban areas; also included on the next two pages of this Summary)
- For those models which require it, the Type II rainfall distribution shall be used within the City of Rogers planning boundary.
Runoff Curve Numbers (CN) for Urban Areas (Antecedent Moisture Condition II, and Ia = 0.2*S) (USDA NRCS – TR-55 1986) (same as Table RO-10)
COVER DESCRIPTION | CN FOR HYDROLOGIC SOIL GROUP | |||||
|---|---|---|---|---|---|---|
COVER TYPE AND HYDROLOGIC CONDITION | AVERAGE PERCENT IMPERVIOUS AREA 3 | A | B | C | D | |
Open Spaces (lawns, parks, golf courses, cemeteries, etc.) | ||||||
Poor Condition (grass cover <50%) . . . . . . . . . . . . . . . . | - | 68 | 79 | 86 | 89 | |
Fair condition: grass cover on 50% to 75% of the area . | - | 49 | 69 | 79 | 84 | |
Good condition: grass cover on 75% or more of the area 1 | - | 39 | 61 | 74 | 80 | |
Impervious Areas: | ||||||
Paved Parking Lots, Roofs, Driveways, etc. | ||||||
(excluding right-of-way) . . . . . . . . . . . . . . . . . . . . . . | - | 98 | 98 | 98 | 98 | |
Streets and Roads: | ||||||
Paved; curbs and storm sewers (excluding R.O.W) | - | 98 | 98 | 98 | 98 | |
Paved; open ditches (including right-of-way) . . . . . . | - | 83 | 89 | 92 | 93 | |
Gravel (including right-of-way) . . . . . . . . . . . . . . . . . | - | 76 | 85 | 89 | 91 | |
Dirt (including right-of-way) . . . . . . . . . . . . . . . . . . . | - | 72 | 82 | 87 | 89 | |
Urban Districts: | ||||||
Commercial and Business . . . . . . . . . . . . . . . . . . . . . . . | 85 | 89 | 92 | 94 | 95 | |
Industrial . . . . . . . . . . . . . . . . . . . . . . . . . . . . . . . . . . . . | 72 | 81 | 88 | 91 | 93 | |
Residential Districts by Average Lot Size: 2 | ||||||
1/8 acre or less (town houses) . . . . . . . . . . . . . . . . . . . . | 65 | 77 | 85 | 90 | 92 | |
1/4 acre . . . . . . . . . . . . . . . . . . . . . . . . . . . . . . . . . . . . . | 38 | 61 | 75 | 83 | 87 | |
1/3 acre . . . . . . . . . . . . . . . . . . . . . . . . . . . . . . . . . . . . . | 30 | 57 | 72 | 81 | 86 | |
1/2 acre . . . . . . . . . . . . . . . . . . . . . . . . . . . . . . . . . . . . . | 25 | 54 | 70 | 80 | 85 | |
1 acre . . . . . . . . . . . . . . . . . . . . . . . . . . . . . . . . . . . . . . | 20 | 51 | 68 | 79 | 84 | |
2 acres . . . . . . . . . . . . . . . . . . . . . . . . . . . . . . . . . . . . . | 12 | 46 | 65 | 77 | 82 | |
Developing Urban Areas | ||||||
Newly Graded Areas (pervious areas only, no vegetation) . . | - | 77 | 86 | 91 | 94 | |
1 Good cover is protected from grazing and litter and brush cover soil. 2 Curve numbers are computed assuming that the runoff from the house and driveway is directed toward the street with a minimum of roof water directed to lawns where additional infiltration could occur. 3 The remaining pervious areas (lawn) are considered to be in good pasture condition for these curve numbers. | ||||||
Runoff Curve Numbers (CN) for Non-Urban Areas (Antecedent Moisture Condition II, and Ia = 0.2*S) (USDA NRCS – TR-55 1986) (same as Table RO-11)
COVER DESCRIPTION | CN FOR HYDROLOGIC SOIL GROUP | |||||||
|---|---|---|---|---|---|---|---|---|
COVER TYPE AND HYDROLOGIC CONDITION | A | B | C | D | ||||
Idle Lands (not yet developed) | ||||||||
Pasture, Grassland, or Range ---- continuous forage for grazing. 1 | Poor | 68 | 79 | 86 | 89 | |||
Fair | 49 | 69 | 79 | 84 | ||||
Good | 39 | 61 | 74 | 80 | ||||
Meadow ---- continuous grass, protected from grazing and generally mowed for hay. | ---- | 30 | 58 | 71 | 78 | |||
Brush ---- brush-weed-grass mixture with brush the major element. 2 | Poor | 48 | 67 | 77 | 83 | |||
Fair | 35 | 56 | 70 | 77 | ||||
Good | 30 3 | 48 | 65 | 73 | ||||
Woods ---- grass combination (orchard or tree farm). 4 | Poor | 57 | 73 | 82 | 86 | |||
Fair | 43 | 65 | 76 | 82 | ||||
Good | 32 | 58 | 72 | 79 | ||||
Woods 5 | Poor | 45 | 66 | 77 | 83 | |||
Fair | 36 | 60 | 73 | 79 | ||||
Good | 30 3 | 55 | 70 | 77 | ||||
Farmsteads ---- buildings, lanes, driveways, and surrounding lots. | ---- | 59 | 74 | 82 | 86 | |||
1Poor: <50% ground cover or heavily grazed with no mulch. Fair: 50 to 75% ground cover and not heavily grazed. Good: >75% ground cover and lightly or only occasionally grazed. 2Poor: <50% ground cover. Fair: 50 to 75% ground cover. Good: >75% ground cover. 3 If actual CN is less than 30; use CN = 30 for runoff calculations 4 CNs shown were computed for areas with 50% woods and 50% grass (pasture) cover. Other combinations of conditions may be computed from the CNs for woods and pasture. 5Poor: Forest litter, small trees, and brush are destroyed by heavy grazing or regular burning. Fair: Woods are grazed but not burned, and some forest litter covers the soil Good: Woods are protected from grazing, and litter and brush adequately cover the soil. | ||||||||
1.1 Introduction
Determining the peak flow rate and volume of storm water runoff generated in a watershed for a given storm event is an essential step in evaluating drainage design. The size of rainfall event, type of flow condition, and flow rate of the runoff all play a major role in the sizing, configuration, and operation of storm drainage and flood control systems. Numerous methods for calculating runoff have been developed and studied as engineering design options but only a few are accepted by the City of Rogers, based on the climate and natural environment.
1.2 City of Rogers Drainage Methods
There are a number of different methods and procedures for computing runoff on which the design of storm drainage and flood control systems are based. The three methods the City accepts are:
- The Rational Method
- The Soil Conservation Service Technical Release – 55 Synthetic Hydrograph Method (SCS method)
- USGS Regional Regression Equations. This third method will not be discussed in detail in this Manual, but can be examined and further studied in Magnitude and Frequency of Floods in Arkansas (USGS – WRIR 95-4224, 1995).
The two main drainage methods described in this Manual are: (1) the Rational Method and (2) SCS method. The Rational Method is generally used for smaller watersheds when only the peak flow rate or the total volume of runoff is needed at a design point or points (e.g., storm sewer sizing or simple detention basin sizing). The SCS method is used for larger watersheds and when a hydrograph of the storm event is needed (e.g., sizing large detention facilities). The watershed size limits and/or ranges for each analysis method are shown in Table RO-1.
2.1 Rational Formula
The Rational Method is based on the Rational Formula which is expressed as:
Q = ki*C*I*A(Equation RO-1)
in which:
Q = peak rate of runoff (cubic feet per second [cfs]). Q is actually in units of acre-inches per hour (ac-in/hr), but conversion of the results to cubic-feet per second (cfs) differs by less than 1 percent. Since the difference is so small, the Q value calculated by the equation is accepted as cubic feet per second (cfs).
ki = adjustment multiplier for design storm recurrence interval
(see Table RO-4)
C = runoff coefficient - represented in the ratio of the amount of runoff to the amount of rainfall (see Section 2.5).
I = average intensity of rainfall (inches per hour [in/hr]) for a period of time equal to the critical time of full contribution of the drainage area under consideration (see Section 2.6). This critical time for full contribution is commonly referred to as "time of concentration," tc (see Section 2.8)
A = area (acres) that contributes to runoff at the point of design or the point under consideration (see Section 2.7).
2.2 Rational Method Calculation Procedure
The general procedure for Rational Method calculations for a single watershed is as follows:
- Delineate the watershed boundary and measure its area in acres.
- Define the flow path from the hydraulically most distant point of the watershed to the design point. This flow path should be divided into reaches of similar flow type [i.e. overland flow (sheet flow), shallow concentrated flow (swales, shallow ditches, etc.)], and channelized flow (gutters, storm sewers, open channels, etc.). The length and slope of each reach should be measured.
- Determine the time of concentration, tc, for the watershed. Refer to Section 2.8 of this chapter for additional information on calculating tc.
- Find the rainfall intensity, I, for the design storm using the calculated tc and the rainfall intensity-duration-frequency information (see Table RO-5). Use arithmetic interpolation to calculate rainfall intensity for tc not displayed in the table.
- Determine the runoff coefficient, C, (see Table RO-2 and/or Table RO-3) for the watershed boundary and its resulting subareas.
- Calculate the peak flow rate from the watershed using Equation RO-1.
Calculations for the Rational Method shall be carried out using the spreadsheets or other software aides discussed in Section 4.0 of this chapter.
2.3 Assumptions
Basic assumptions associated with use of the Rational Method are as follows:
- The computed peak rate of runoff to the design point is a function of the average rainfall rate during the time of concentration for the watershed.
- The time of concentration is the critical value in determining the design rainfall intensity and is equal to the time required for water to flow from the hydraulically most distant point in the watershed to the point of design.
- The runoff coefficient, C, is uniform during the entire duration of the storm event.
- The rate of rainfall or rainfall intensity, I, is uniform for the entire duration of the storm event and is uniformly distributed over the entire watershed area.
- The depth of rainfall used is that which occurs from the start of the storm to the time of concentration. The design rainfall depth during that time period is converted to the average rainfall intensity for that period in inches per hour (in/hr).
- The maximum runoff rate occurs when the entire area is contributing flow. However, this assumption has to be modified when a more intensely developed portion of the watershed with a shorter time of concentration produces a higher rate of maximum runoff than the entire watershed with a longer time of concentration.
2.4 Limitations
The Rational Method is an adequate method for approximating the peak rate of runoff from a design rainstorm in a given watershed area. The greatest drawback to the Rational Method is that it normally provides only one point on the runoff hydrograph. When the areas become complex and where sub-watersheds come together, the Rational Method will tend to overestimate the actual flow, which results in oversizing of drainage facilities. The Rational Method provides no direct information needed to route hydrographs through the drainage facilities. One reason the Rational Method is limited to small areas is that good design practice requires the routing of hydrographs for larger watersheds to achieve an economic design.
Another disadvantage of the Rational Method is that in the typical design procedure one normally assumes that all of the design flow is collected at the design point and that no water bypasses or runs overland to the next design point. However, this is not a limitation of the Rational Method but of the design procedure. The Rational Method must be modified, or another type of analysis used, when analyzing an existing system that is under-designed or when analyzing the effects of a major storm on a system designed for the minor storm.
2.5 Runoff Coefficient, C
The runoff coefficient, C, represents the integrated effects of infiltration, detention storage, evaporation, retention, flow routing, and interception, all of which affect the time of distribution and peak rate of runoff. The proportion of the total rainfall that runs off depends on the relative porosity or imperviousness of the ground surface, the surface slope, and the ponding character of the surface. Impervious surfaces, such as asphalt pavements and roofs of buildings, will be subject to nearly 100 percent runoff, regardless of the slope, after the surfaces have become thoroughly wet. On-site inspections and aerial photographs are valuable in determining the types of surfaces within the drainage area and are essential when assessing the runoff coefficient, C.
2.6 Rainfall Intensity, I
Rainfall intensity, I, is the design rainfall rate in inches-per-hour (in/hr) for a particular drainage basin or subbasin of a watershed. The rainfall intensity, I, is obtained from an intensity-duration-frequency (IDF) chart for a specified return period under the assumption that the duration is equal to the time of concentration for the watershed being evaluated. Once the time of concentration is known, the design intensity of rainfall may be interpolated from Table RO-5. The frequency of recurrence interval is a statistical variable which is established by City standards.
2.7 Drainage Area, A
The drainage area is measured in acres when using the Rational Method. Drainage areas should be calculated using planimetric-topographic maps, supplemented by field surveys where topographic data has changed or where the contour interval is too great to distinguish the exact direction of overland flows. Field surveys are also useful for verifying flows through culverts or other drainage structures. Recent topographic aerial surveys of the City of Rogers can be viewed using the City’s GIS web browser at http://gis.rogersar.gov and downloadable aerial images can be obtained by logging in at http://www.geostor.arkansas.gov/. City topography is available for use in designating off-site drainage or preliminary designs. An actual site survey will be required for all site developments and subdivisions.
2.8 Time of Concentration, tc
The time of concentration, tc, is best defined as the time required for water to flow from the hydraulically most distant point of a watershed to the design point at which peak runoff is desired. The critical time of concentration is the time to the peak of the runoff hydrograph at the location of the design point. Runoff from a watershed usually reaches a peak at the time when the entire watershed area is contributing to flow. The critical time of concentration, therefore, is assumed to be the flow time measured from the most remote part of the watershed to the design point. A trial and error procedure should be used to select the most remote point of a watershed since type of flow, ground slopes, soil types, surface treatments and improved conveyances all affect flow velocity and time of flow.
Water moves through a watershed as overland flow (sheet flow), shallow concentrated flow (swales, shallow ditches, etc.), channelized flow (gutters, storm sewers, open channels, etc.) or some combination of these. The type that occurs is a function of the conveyance system and is best determined by field inspection.
The time of concentration, tc, is represented by Equation RO-2 for both urban and non-urban areas:
tc= to + ts + tt(Equation RO-2)
in which:
tc = time of concentration (minutes)
to = overland flow time (minutes)
ts = shallow concentrated flow time (minutes)
tt = channelized flow time (minutes)
Urban areas are characterized as densely populated areas, where the collection of streets, parking lots, and rooftops in close proximity to one another create a situation where the collective runoff area is more impervious than not. Non-urban areas are characterized as less populated and more agricultural, where the majority of the area is farmland, open pastures, woodlands. This combination of agricultural land creates the situation where the collective runoff area is more pervious than not.
A convenient tool for calculating the time of concentration (as outlined in Equation RO-2) is located in the Tc and PeakQtab within the RDM-Rational Method spreadsheet. This tab allows for the calculation of the total time of concentration for a watershed based on the collective equations presented in this section of the Manual for calculating overland flow time (to), shallow concentrated flow time (ts), and channelized flow time (tt). All time of concentration calculations shall be performed on this spreadsheet and included in the drainage report.
3.1 SCS Method Formula
Runoff, Q, for the SCS method is represented by Equation RO-9:
(Equation RO-9)
in which:
Q = runoff (inches)
P = rainfall depth for design storm (inches)
S = potential maximum retention after runoff begins (inches)
Ia = initial abstraction (inches)
Initial abstraction, Ia , is all losses before runoff begins. It includes water retained in surface depressions, water intercepted by vegetation, evaporation, and infiltration. Ia is highly variable but generally is correlated with soil and cover parameters. A relationship between Ia and S was developed by USDA NRCS through studies of many small agricultural watersheds. The empirical relationship used in the SCS runoff formula is:
(Equation RO-10)
Substituting Equation RO-10 into Equation RO-9 gives:
(Equation RO-11)
S is related to the soil and cover conditions of the watershed through the CN. CN has a range of 0 to 100, and S is related to CN by:
(Equation RO-12)
Figure RO-1 and Table RO-8 solve Equation RO-11 and Equation RO-12 for a range of CNs and rainfall. Refer to Section 3.3 for explanations and direction in determining proper CNs for use in Equation RO-12.
3.2 Design Storm Data
The SCS method is based on 24-hour rainfall amounts for various design storm recurrence intervals (e.g., 1-year, 10-year, or 100-year storm events). These rainfall amounts are taken from the U.S. Weather Bureau Technical Paper No. 40 for Rogers and are as follows: 3.32 inches for the 1-year frequency rainfall; 4.08 inches for the 2-year frequency rainfall; 5.28 inches for the 5-year frequency rainfall; 6.00 inches for the 10-year frequency rainfall; 6.96 inches for the 25-year frequency; 7.92 inches for the 50-year frequency; and 8.64 inches for the 100-year frequency. Table RO-9 provides rainfall data derived from several sources for storm durations other than the 24-hour event and for a range of storm return frequencies, if needed for further detailed analysis.
3.3 Determination of Runoff Curve Number (CN)
The runoff curve number (CN) determines the amount of runoff that will occur given a specified rainfall amount. The determination of the CN value for a watershed is a function of the hydrologic soil group (HSG), cover type and hydrologic condition, and antecedent moisture condition (AMC). Another factor considered is whether impervious areas outlet directly to the drainage system (connected) or whether the flow spreads over pervious areas before entering the drainage system (unconnected).
CN values in Table RO-10 and Table RO-11 represent average antecedent moisture conditions for undeveloped and developed lands. For watersheds with multiple soil types or land uses, an area-weighted CN should be calculated. When significant differences in land use or natural control points exist, the watershed shall be broken into smaller drainage areas for modeling purposes. Curve Numbers presented in Table RO-10 and Table RO-11 are based on the assumption that impervious areas are directly connected. The following sections provide details on the factors governing the determination of CN values and their relationship to runoff.
3.4 Limitations on Use of SCS Method
- Do not use the SCS method when large changes in CN values occur among watershed subareas and when runoff volumes are less than about 1-1/2 -inches for CN values less than 60.
- The CN procedure is less accurate when runoff is less than 1/2-inch. As a check, use another procedure to determine runoff when this occurs.
- Do not use the SCS method for watersheds that have several subareas with times of concentration below six minutes. In these cases, subareas should be combined to produce a time of concentration of at least six minutes (0.10 hours) for the combined areas.
- Curve numbers describe average conditions that are useful for design purposes. If the rainfall event used is a historical storm, the modeling accuracy decreases.
- Use the runoff curve number equation with caution when re-creating specific features of an actual storm. The equation does not contain an expression for time and, therefore, does not account for rainfall duration or intensity.
- The initial abstraction relationship, Ia = 0.2*S, which consists of interception, initial infiltration, surface depression storage, evapotranspiration, and other factors, is based on data obtained by the USDA NRCS from agricultural watersheds (where S is the potential maximum retention after runoff begins). In reality not all watersheds (urban conditions and non-urban conditions) share the same Ia because of differing combinations of impervious and pervious areas along with differing storage features. However, for this Manual Ia will be related the same for all watershed conditions.
- Runoff from snowmelt or rain on frozen ground cannot be estimated using these procedures.
- The SCS method procedures apply only to direct surface runoff. Do not overlook large sources of subsurface flow or high ground water levels that contribute to runoff. These conditions are often related to HSG A soils and forest areas that have been assigned relatively low CNs in Table RO-10 and Table RO-11. Good judgment and experience based on stream gage records are needed to adjust CNs as conditions warrant.
- When the weighted CN is less than 40, use another procedure to determine runoff.
3.5 Computer Modeling
Due to the large number of computations involved in runoff calculations and routing, use of modern computer models by experienced engineers is allowed by the City for the drainage calculations/methods outlined above. The U.S. Army Corps of Engineers (USACE) Hydrologic Engineering Center (HEC) has developed computer programs that can be downloaded online at the USACE hydrologic website (http://www.hec.usace.army.mil/) that can be applied to some of the drainage methods. HEC-HMS is one such program available from USACE. Additionally, versions of TR-20 and TR-55 are available through the NRCS, which allow user input of rainfall distributions and perform acceptable detention and channel routing routines. The Type II rainfall distribution type shall be used within the City of Rogers planning boundary, refer to Figure RO-4. The HEC-HMS, TR-55, and TR-20 models are available free of charge from the agencies that developed them. Table RO-12 provides additional information on the computer models as well as a link for downloading the available software.
Commercial software, such as StormCAD, Hydraflow, PondPack, etc., is also an acceptable method for evaluating the drainage methods mentioned in this chapter. It is the responsibility of the design engineer to understand the methods employed within the commercial software used and ensure that the software’s results will match and correspond with the methodology outlined in this chapter of the Manual.
Purpose of the Chapter
The intent of this chapter of the Manual is to give concise, practical guidelines for the design of urban storm water collection and conveyance systems. Procedures and equations are presented for the hydraulic design of storm sewer systems, locating inlets and determining capture capacity and efficiency, and sizing storm sewers. In addition, examples are provided to illustrate the hydraulic design process. Spreadsheet solutions accompany the hand calculations for most example problems.
Chapter Summary
Proper sizing and placement of stormwater capture and conveyance structures is pivotal in the handling of stormwater runoff in urban areas. The primary function of stormwater collection and conveyance systems is to collect excess stormwater from street gutters, convey the excess stormwater through storm sewers and along the street right-of-way or drainage easements, and discharge it into a detention basin, water quality best management practice (BMP) or the nearest receiving water body (FHWA 1996). The main premise of urban stormwater systems is to minimize disruption to the natural drainage system, promote safe passage of vehicular traffic during minor storm events, maintain public safety and manage flooding during major storm events, preserve and protect the urban stream environment, and minimize capital and maintenance costs of the stormwater collection system. To ensure these measures are met, consistent and strategic use of accepted and proven design methodology for sizing and placing stormwater capture and conveyance structures is required. Within this section of the Manual the City of Rogers addresses specific stormwater system design methods and system requirements that have been deemed acceptable and compatible with the type of transportation system and stormwater system characteristic within the City.
Urban stormwater collection and conveyance systems are comprised of three primary components: (1) street gutters and roadside swales, (2) stormwater inlets, and (3) storm sewers (and appurtenances like manholes, junctions, bends and transitions, etc.). Street gutters and roadside swales collect runoff from the street (and adjacent areas) and convey the runoff to a stormwater inlet while maintaining the street’s level-of-service.
Inlets collect stormwater from streets and other land surfaces, transition the flow into storm sewers, and often provide maintenance access to the storm sewer system. Storm sewers convey stormwater in excess of a street’s or a swale’s capacity along the right-of-way and discharge it into a stormwater management facility or a nearby receiving water body. All of these components must be designed properly to achieve the stormwater collection and conveyance system’s objectives. This chapter of the Manual spells out the steps involved in the design and evaluation of the three primary components mentioned above.
The design procedures presented in this chapter are based upon fundamental hydrologic and hydraulic design concepts. The design equations provided are well accepted and widely used. They are presented without derivations or detailed explanation, but are properly referenced if the reader wishes to study their background. Therefore, it is assumed the reader has a fundamental understanding of basic hydrology and hydraulics. A working knowledge of the Rational Equation (Chapter 3 – Determination of Stormwater Runoff) and open channel hydraulics (Chapter 6 – Open Channel Flow Design) is particularly helpful.
Summary of Critical Design Criteria
The summary below outlines some of the most critical design criteria essential to design engineers for proper drainage design of streets, inlets, and storm sewers according to City of Rogers’ requirements. The information below contains exact numerical criteria as well as general guidelines that must be adhered to during the design process. This section is meant to be a summary of critical design criteria for this section; however, the engineer is responsible for all information in this chapter. It should be noted that any design engineer who is not familiar with Rogers’ Drainage Criteria Manual and its accepted design techniques and methodology should review the entirety of this chapter. If additional specific information is required, it will be necessary to review the appropriate section as needed.
1.0 STREET DRAINAGE
Street Class | Street Width | Depth at Curb | Maximum Encroachment | Maximum Width of Gutter Flow (Typical Section) |
|---|---|---|---|---|
Minor Class I | 30-ft | No overtopping | Half of roadway width (F.O.C. to F.O.C.) to remain clear. | ≤ 7.25-ft |
Collector Class II | 40-ft | No overtopping | Half of roadway width (F.O.C. to F.O.C.) to remain clear. | ≤ 9.75-ft |
Minor Arterial Class III | 52-ft | No overtopping | Half of roadway width (F.O.C. to F.O.C.) to remain clear. | ≤ 12.75-ft |
Major Arterial Class IV | 64-ft | No overtopping | Half of roadway width (F.O.C. to F.O.C.) to remain clear. | ≤ 15.75-ft |
Boulevard Class IV | 68-ft | No overtopping | Half of roadway width (F.O.C to F.O.C) to remain clear in each direction. | ≤ 13.75-ft |
1.1 Street Function and Classification
The primary function of a street or roadway is to provide for the safe passage of vehicular traffic at a specified level of service. If stormwater collection and conveyance systems are not designed properly, this primary function can be impaired when streets flood due to surcharge in storm sewers and street encroachment. To make sure this does not happen, streets are classified for drainage purposes based on their traffic volume, parking practices, and other criteria (Wright-McLaughlin Engineers 1969). The five street classifications for the City of Rogers are:
- Minor: low-speed traffic for residential or industrial area access.
- Collector: low/moderate-speed traffic providing service between local streets and arterials.
- Minor Arterial: moderate/high-speed traffic moving through urban areas.
- Major Arterial: moderate/high-speed traffic moving through urban areas.
- Boulevard: moderate/high-speed traffic moving through urban areas.
For drainage design, the classification shown on the Rogers Master Street Plan shall be used unless a higher standard is deemed appropriate by the Engineer of Record or City. Refer to Article 6 – Engineering Manual - for layout design standards and criteria for the street classifications mentioned above (http://library.municode.com).
Streets serve another important function other than traffic flow. They contain the first component in the urban stormwater collection and conveyance system. That component is the street gutter or adjacent swale, which collects excess stormwater from the street and adjacent areas and conveys it to a stormwater inlet. Proper street drainage is essential to:
- Maintain the street’s level-of-service.
- Reduce skid potential.
- Minimize the potential for cars to hydroplane.
- Maintain good visibility for drivers by reducing splash and spray.
- Minimize inconvenience/danger to pedestrians during storm events (FHWA 1984).
1.2 Design Considerations
Stormwater which flows in a street will flow in the gutters of the street until it reaches an overflow point or some other outlet/inlet. During its travel time the top width (or spread) of the stormwater flowing in the gutter widens as more stormwater is collected. Certain design considerations must be taken into account in order to meet the drainage objectives of a street to handle the stormwater flowing in the gutter. The primary design objective is to maintain permissible values of spread (encroachment) for minor storm (10-yr frequency) events. If the width and depth of the flow becomes great enough, the street loses its effectiveness as a traffic-carrier and travel becomes hazardous. Based on this, the City has established encroachment standards for the minor storm event. These encroachment standards are shown in Table ST-1.
Table ST-1 — Pavement Encroachment and Curb Depth Standards for the Minor Storm, 10-yr Return Frequency
Street Class | Depth at Curb | Maximum Encroachment | Example Based on Given Street Width (Normal Typical Section) | ||||
|---|---|---|---|---|---|---|---|
| Minor | No curb overtopping | Spread of water flowing in gutter shall be limited so that half of roadway width (F.O.C. to F.O.C.) remains clear. | - Street Width (F.O.C. to F.O.C.) = 29-ft ; - Required Clear Lane = 29-ft/2 = 14.5-ft - Therefore: Street flow in each gutter ≤ (29’-14.5’)/2 = 7.25-ft | ||||
Collector | No curb overtopping | Spread of water flowing in gutter shall be limited so that half of roadway width (F.O.C. to F.O.C.) remains clear. | - Street Width (F.O.C. to F.O.C.) = 39-ft ; - Required Clear Lane = 39-ft/2 = 19.5-ft - Therefore: Street flow in each gutter ≤ (39’-19.5’)/2 = 9.75-ft | ||||
Minor Arterial | No curb overtopping | Spread of water flowing in gutter shall be limited so that half of roadway width (F.O.C. to F.O.C.) remains clear. | - Street Width (F.O.C. to F.O.C.) = 51-ft ; - Required Clear Lane = 51-ft/2 = 25.5-ft - Therefore: Street flow in each gutter ≤ (51’-25.5’)/2 = 12.75-ft | ||||
Major Arterial | No curb overtopping | Spread of water flowing in gutter shall be limited so that half of roadway width (F.O.C. to F.O.C.) remains clear. | - Street Width (F.O.C. to F.O.C.) = 63-ft ; - Required Clear Lane = 63-ft/2 = 31.5-ft - Therefore: Street flow in each gutter ≤ (63’-31.5’)/2 = 15.75-ft | ||||
Boulevard | No curb overtopping | Spread of water flowing in gutter shall be limited so that half of roadway width (F.O.C. to F.O.C.) remains clear in each direction. | - Street Width (F.O.C. to F.O.C.) Each Direction = 27-ft ; - Required Clear Lane = 27.5’/2 = 13.5-ft - Therefore: Street flow in each gutter ≤ (27.5’)/2 = 13.5-ft |
Additional design objectives are required for major storm (100-yr frequency) events and resulting gutter flows and street cross flows. The main factor to be considered when evaluating the major storm event is to determine the potential for flooding and public safety. Cross-street/intersection flows also need to be regulated for traffic flow and public safety. The City has established street inundation standards during the major storm event and allowable cross-street/intersection flow standards. These standards are shown in Table ST-2 and Table ST-3.
Table ST-2 — Street Inundation Standards for the Major Storm, 100-yr Return Frequency
Street Classification | Maximum Depth and Inundated Area |
|---|---|
Minor And Collector | Residential dwellings and public, commercial, and industrial buildings shall be no less than 12-inches above the 100-year flood at the ground line or lowest water entry of the building, whichever is lower. The depth of water over the gutter flow line shall not exceed 18-inches. Minimum finished floor elevation (F.F.E) shall be 1-foot above top of curb. |
Minor Arterial, Major Arterial and Boulevard | Residential dwellings and public, commercial, and industrial buildings shall be no less than 12-inches above the 100-year flood at the ground line or lowest water entry of the building, whichever is lower. The depth of water shall not exceed the street crown to allow operation of emergency vehicles. The depth of water over the gutter flow line shall not exceed 12-inches. Minimum finished floor elevation (F.F.E) shall be 1-foot above top of curb. |
Table ST-3 — Allowable Cross-Street/Intersection Flows
Street Classification | Minor (10-yr) Storm Flow | Major (100-yr) Storm Flow |
|---|---|---|
Local | 6-inches of depth in cross pan. | 12-inches of depth above gutter flow line. |
Collector | Where cross pans allowed, depth of flow shall not exceed 4-inches. | 12-inches of depth above gutter flow line. |
Minor Arterial | None. | No cross flow through intersection or across a street. Maximum depth at upstream gutter on road edge of 12-inches. |
Major Arterial | None. | No cross flow through intersection or across a street. Maximum depth at upstream gutter on road edge of 12-inches. |
Boulevard | None. | No cross flow through intersection or across a street. Maximum depth at upstream gutter on road edge of 12-inches. |
1.3 Hydraulic Evaluation of Street Gutters and Swales
Hydraulic computations are performed to determine the capacity of roadside swales and street gutters and the encroachment of stormwater onto the street. The design discharge is usually determined using the Rational Method (covered later in this chapter). Stormwater runoff ends up in swales, roadside ditches and street gutters.
2.1 Inlet Functions, Types and Appropriate Applications
Once the design flow spread (encroachment) has been established for the minor storm, the placement of inlets can be determined. The primary function of stormwater inlets is to intercept excess surface runoff and deposit it in storm sewers, thereby reducing the possibility of surface flooding.
The location of storm drain inlets along a road is influenced by the roadway’s geometry as well as adjacent land features. As a rule, inlets are placed at all low points in the gutter grade, median breaks, intersections, and at or near crosswalks. Along with adhering to the geometric controls outlined above, storm drain inlet spacing shall be such that the gutter spread under the design storm (10-yr frequency) conditions will not exceed the allowable encroachment for the type of street class under consideration. (Table ST-1)
There are five major types of storm drain inlets: grate, curb opening, combination, slotted and area. Figure ST-5 depicts the major types of inlets along with some associated geometric variables. Table ST-5 provides general information on the appropriate application of the different inlet types along with basic advantages and disadvantages of each.
Figure ST-5 –– Types of Storm Drain Inlets (FHWA – HEC-22 2001)
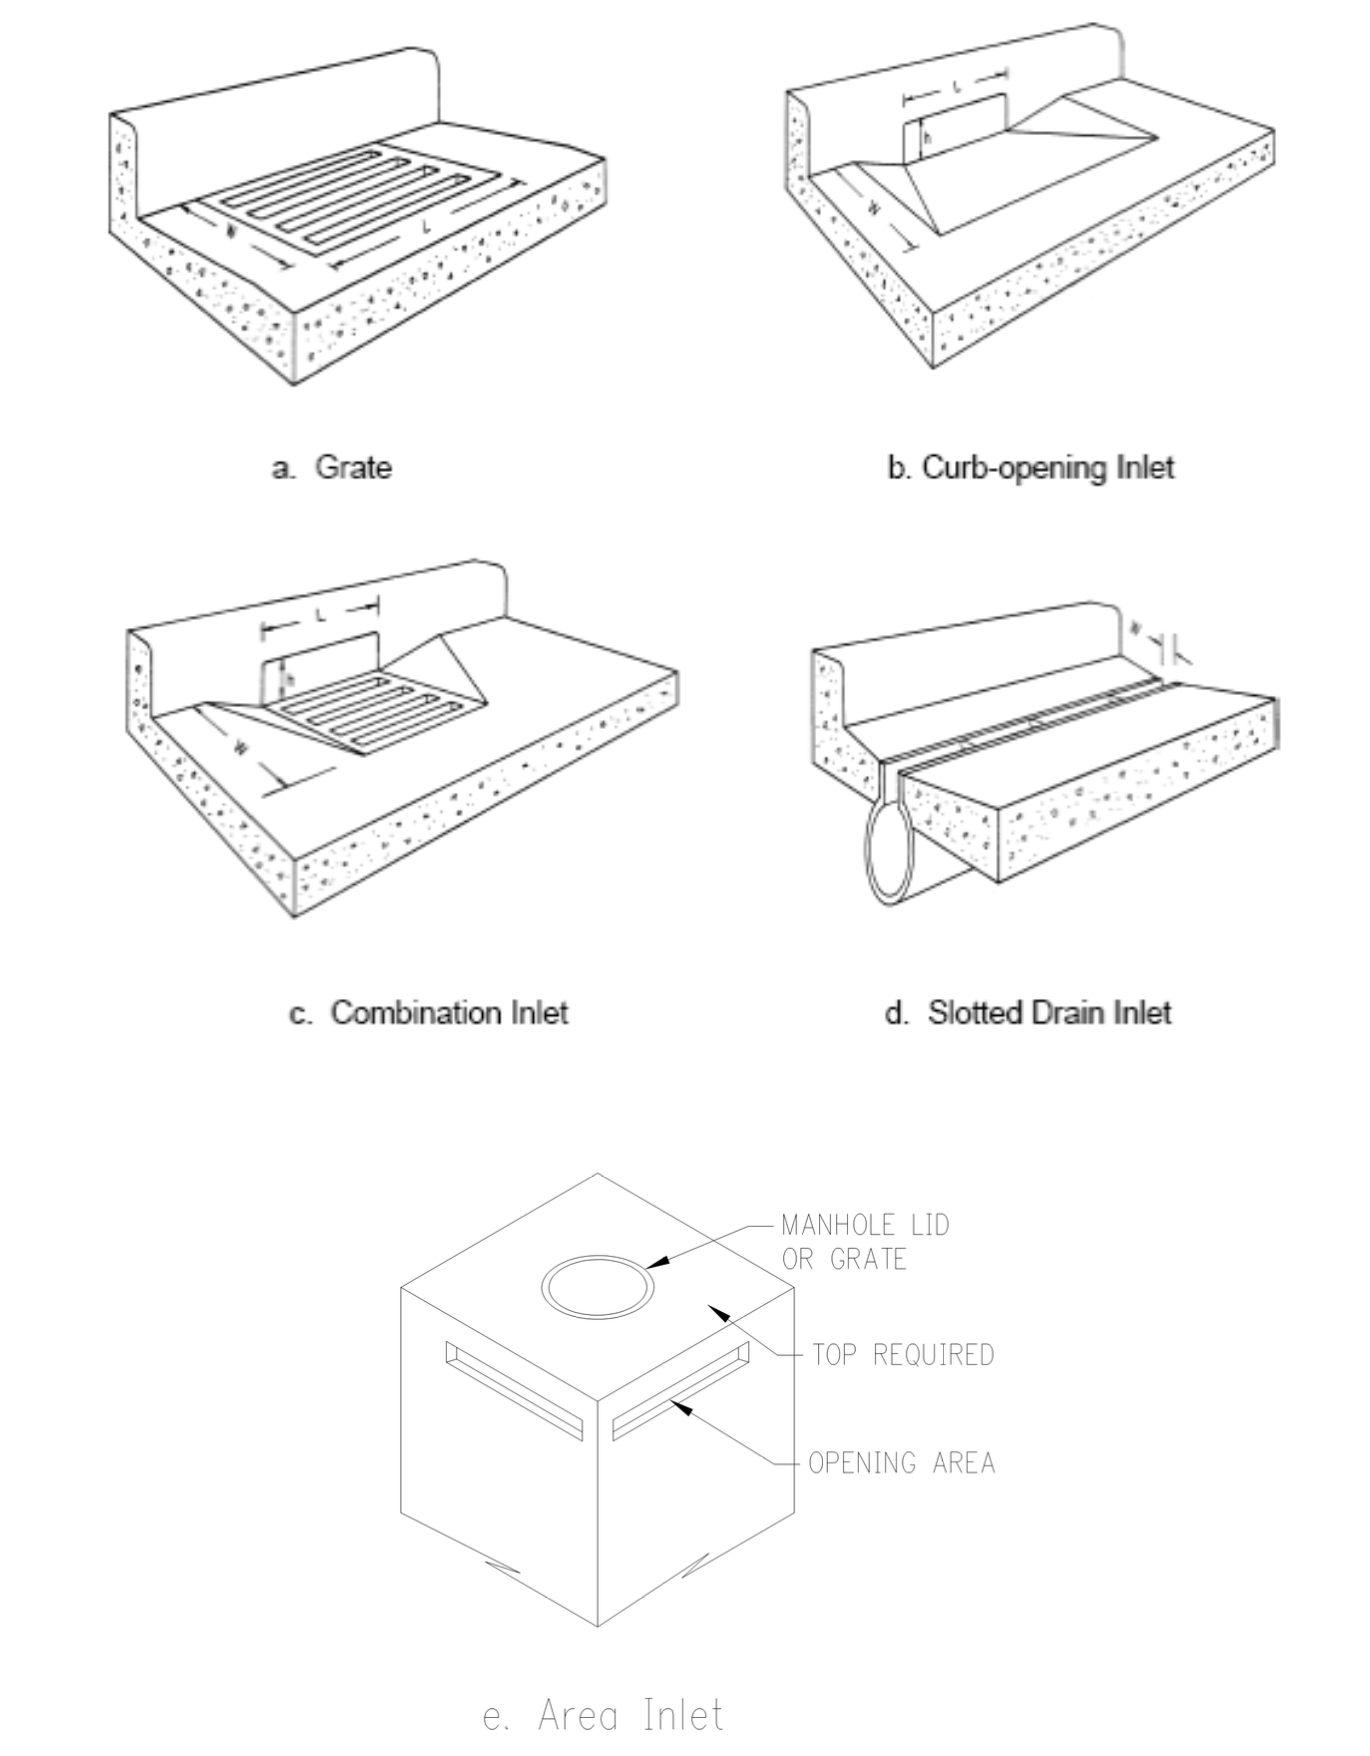
Table ST-5 — Applicable Settings for Various Inlet Types
Inlet Type | Applicable Setting | Advantages | Disadvantages |
|---|---|---|---|
Grate | Sumps and continuous grades (must be bicycle safe) | Perform well over wide range of grades | Can become clogged Lose some capacity with increasing grade |
Curb-opening | Sumps and continuous grades (but not steep grades) | Do not clog easily Bicycle safe | Lose capacity with increasing grade |
Combination | Sumps and continuous grades (must be bicycle safe) | High capacity Do not clog easily | More expensive than grate or curb-opening acting alone |
Slotted | Locations where sheet flow must be intercepted. | Intercept flow over wide section | Susceptible to clogging |
Area Inlet | Sumps or a lower point on a site where runoff can be efficiently collected | Do not clog easily Bicycle safe | Protrude above ground and are limited to certain locations (such as yards, etc.) |
2.2 Design Considerations
Stormwater inlet design takes two forms: inlet placement location and inlet hydraulic capacity. As previously mentioned, inlets must be placed in sumps to prevent ponding of excess stormwater. On streets with continuous grades, inlets are required periodically to keep the gutter flow from exceeding the encroachment limitations. In both cases, the size and type of inlets need to be designed based upon their hydraulic capacity.
Inlets placed on continuous grades rarely intercept all of the gutter flow during the minor (design) storm. The effectiveness of the inlet is expressed as an efficiency, E, which is defined as:
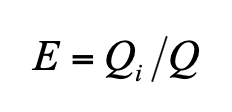 (Equation ST-15)
in which:
E= inlet efficiency
Qi= intercepted flow rate (cfs)
Q= total gutter flow rate (cfs)
Bypass (or carryover) flow is not intercepted by the inlet. By definition,
 (Equation ST-16)
in which:
Qb= bypass (or carryover) flow rate (cfs)
The ability of an inlet to intercept flow (i.e., hydraulic capacity) on a continuous grade generally increases with increasing gutter flow, but the capture efficiency decreases. In other words, even though more stormwater is captured, a smaller percentage of the gutter flow is captured. In general, the inlet capacity depends upon the following factors:
- Inlet type and geometry (length, width, etc.).
- Flow rate (depth and spread of water).
- Cross (transverse) slope (of road and gutter).
- Longitudinal slope.
As a general rule, an effective way to achieve an economic design and spacing for storm drain inlets is to allow 20- to 40-percent of gutter flow reaching the inlet to carry over to the next inlet downstream, provided that water flowing in the gutter does not exceed the allowable encroachment.
Inlets in sumps operate as weirs for shallow pond depths, but eventually will operate as orifices as the depth increases. A transition region exists between weir flow and orifice flow, much like a culvert. Grate inlets and slotted inlets tend to clog with debris, especially in sump conditions, so calculations shall take that into account. Curb opening inlets tend to be more dependable in sumps for this reason.
2.3 Hydraulic Evaluation
The hydraulic capacity of an inlet is dependent on the type of inlet (grate, curb opening, combination, or slotted) and the location (on a continuous grade or in a sump). The methodology for determination of hydraulic capacity of the various inlet types is described in the following sections:
- grate inlets on a continuous grade (Section 2.3.1)
- curb opening inlets on a continuous grade (Section 2.3.2)
- combination inlets on a continuous grade (Section 2.3.3)
- slotted inlets on a continuous grade (Section 2.3.4)
- inlets located in sumps (Section 2.3.5).
3.1 Introduction
Once stormwater runoff is collected from the street surface and local watershed areas and captured by an inlet, the water is conveyed through the storm sewer system. The storm sewer system is comprised of inlets, manholes, pipes, bends, outlets, and other appurtenances. The stormwater passes through these components and is discharged into a stormwater management device for mitigation purposes, such as a detention pond or wetland, or discharged directly to an open channel or other waterbody. This section addresses the combination of storm sewer features and how they interrelate to convey stormwater to an outlet.
3.3 Design Process, Considerations, and Constraints
The design of a storm sewer system requires the collection and evaluation of multiple pieces of information concerning the existing conditions of the study area. Required information includes topography, drainage/watershed boundaries, soil types, impervious surface areas, and locations of any existing storm sewers, inlets, and junction boxes and their sizes. In addition, it is necessary to identify the type and location of existing utilities. With the information described above it is possible to accurately examine proposed layouts of a new storm sewer system or adjustments to an existing system.
When looking at proposed layouts for a storm sewer system each conceptual layout plan shall show inlet and manhole locations, drainage boundaries serviced by each inlet, storm sewer locations, flow directions, and outlet locations. Emphasis should be placed on how the proposed layout interfaces with the existing right-of-way and site topography as these two factors greatly affect the cost of any new storm sewer construction or renovations of an existing system.
Once a final layout is chosen, storm sewers are sized using hydrologic techniques (to determine peak flows generated by the watershed) and hydraulic analysis (to determine pipe capacities). The constraints discussed below and the following design methods shall be used to evaluate the design requirements of a proposed storm sewer system with respect to the design storm.
Purpose of the Chapter
The purpose of this chapter is to provide guidance for designing facilities to detain stormwater runoff from new developments and redevelopments. The intent of the detention facilities is to protect downstream channels and property from adverse impacts caused by increased peak flow rates and runoff volumes that can result if stormwater control measures are not implemented when areas are developed.
Chapter Summary
Urbanization results in increased levels of imperviousness which frequently causes increased peak flow rates and increased runoff volumes from developed sites. Hence, development can result in adverse impacts such as flooding of downstream properties, widening and instability of downstream channels and ecosystem disruption unless measures are taken to detain the runoff and control the rate of discharge off of newly developed sites.
The City requirements for stormwater detention described in this chapter apply to all new developments and redevelopments.
For sites that are 1 acre in size or smaller, for sites that are being redeveloped, or for sites of any size that are adjacent to a primary channel, the City may allow the property owner to pay a fee in-lieu-of implementing the stormwater detention measures described in this section.
There are two basic approaches to designing storage facilities: 1) Onsite or private facilities – facilities that are planned on an individual site basis and 2) Common or regional facilities - facilities that are planned to serve multiple lots, a subdivision, or larger area. These facilities can be constructed either on-line (in the drainageway) or off-channel, though off-channel facilities are preferred by the City and on-line facilities must be approved during the concept phase of the development.
The specific type of detention basin used falls into one of three design categories: 1) Dry detention basin (including underground detention chambers) – drains within 1 to 2 days, for flood control only, 2) Extended detention basin– drains over 1 to 3 days,for pollutant removal and flood control, and 3) Wet basin - contains a permanent pool of water and is designed for pollutant removal, flood control, and often aesthetics.Permeable paver systems must also drain the open graded aggregate base course over 1 to 3 days for pollutant removal and flood control.
Two methods are described for detention basin sizing: 1) The Rational formula-based Modified FAA Method – for additional impervious area of 2 acres or less, and 2) Hydrograph Methods – for any size of additional impervious area (these include the Hydrograph Volumetric Method for estimating the required detention volume and the Modified Puls routing method for designing detention facilities).
For the basin outlet works, design guidance is provided for orifices and weirs (including rectangular sharp-crested weirs, broad-crested weirs, and broad-crested slot and v-notch weirs). Design guidance for pipe outlet control is addressed in the culvert section of this Manual. Other design considerations for detention basins are also described, including factors such as public safety, layout, grading, lining materials, vegetation, access, and maintenance.
Plantings within detention facilities will need to be provided as part of a site’s planting plan, but will be in addition to other landscaping requirements, so as to provide a natural landscape that supplements the hydrologic capacity of the detention facility. Landscaping considerations outlined herein include minimizing the need for herbicides, fertilizers, pesticides or soil amendments, minimizing the need for mowing, pruning and irrigation, and not impeding the primary function of the detention facility.
Design examples are provided for: 1) the Modified FAA method for sizing smaller basins, 2) the Hydrograph Volumetric Method for initial sizing of larger basins, and 3) the Modified Puls routing method for the design of larger basins.
Summary of Critical Design Criteria
To comply with the City requirements for detention of stormwater, new developments and redevelopments must satisfy the applicable criteria in this chapter.
1.1 Impact of Urbanization on the Quantity of Stormwater Runoff
Urbanization results in increased levels of imperviousness which frequently causes increased peak flow rates and increased runoff volumes from developed sites. Historically, the traditional approach for stormwater management was to move runoff away from structures and transportation systems as quickly and efficiently as possible. However, this approach resulted in impacts such as:
- Flooding of downstream properties.
- Widening and instability of downstream channels.
- Habitat damage and ecosystem disruption, resulting in streambed and bank erosion and associated sediment and pollutant transport.
These types of adverse impacts will occur unless measures are taken to detain the runoff and control the rate of discharge off of newly developed sites.
3.1 Fee-in-Lieu of Implementing Stormwater Detention Measures
For sites that are 1-acre in size or smaller, for sites that are being redeveloped, or for sites of any size that are adjacent to a primary channel (see primary channel description in Section 2.5 of Chapter 6 – Open Channel Flow Design), the City may allow a developer/property owner to make a monetary payment or some other form of valuable consideration in lieu of implementing the stormwater detention measures described in this chapter. The City shall make the determination of whether fee-in-lieu of detention will be allowed or required on a case by case basis based upon capacity of the receiving stormwater drainage system and whether regional detention facilities are either proposed or in place and the increase in flow rates to these downstream conditions will not adversely affect downstream property owners. The amount of the fee shall be based on the number of square feet of impervious area on the property post-development. The developer/owner shall provide the City calculations of the number of square feet of impervious area and the City shall prepare a bill for payment in-lieu of detention. The fee shall be paid at the time the final plat is approved by the City Council or before issuance of a Certificate of Occupancy. When these fees are collected, they shall be deposited into a stormwater capital improvements fund, which will be used for future or ongoing stormwater improvement and regional detention projects that will benefit stormwater management in the community. The methodology for calculating the fee-in-lieu is described in Appendix A at the end of this chapter.
3.2 Other Important Considerations for Detention Facility Selection and Design
In addition to the design considerations above, the following factors shall be considered when selecting and designing a detention facility for a site:
- Public Safety – Detention facilities shall be evaluated in terms of public safety and the risks or liabilities that occur during implementation. Public safety is always one of the most important design considerations. Wet detention ponds must have side-slopes that are no steeper than 3:1 (H:V) and must incorporate either a safety bench or fencing into the design (see Section 6.11).
- Public Acceptability - The detention facility shall consider the expected response from the public, particularly neighboring residential properties, if any.
- Agency Acceptability – Selection of a detention facility for a site shall consider the expected response of agencies that will oversee the facility and their relationship to regulatory requirements.
- Mosquito Control – A specific component of public health and safety related to the design of detention facilities is the issue of mosquito control. The potential for mosquito breeding and the spread of mosquito-borne illnesses in detention facilities must be addressed. In general, the biggest concern is the creation of areas with shallow stagnant water and low dissolved oxygen that creates prime mosquito habitat. Studies indicate that pools of deep water (≥ 5 feet) and pools with residence times less than 72 hours are less likely to breed mosquitoes. Therefore, dry detention basins must have outlets designed to drain in 24 to 48 hours. Careful design and proper management and maintenance of systems can effectively control mosquito breeding.
- Reliability/Maintenance/Sustainability – The detention facility shall be effective over an extended time and be able to be properly operated and maintained over time. This may involve requiring subdivision covenants and designating individuals responsible for the operation and maintenance of detention facilities.
4.1 Private versus Common Detention Facilities
There are two basic approaches to designing storage facilities, which vary depending on the type of development:
- Onsite or private facilities – Detention facilities that are planned on an individual site basis.
- Common or regional facilities – Detention facilities that are planned to serve multiple lots, a subdivision, or larger area.
Depending on the type of development, requirements for detention basins may vary, as described below:
- Residential or Commercial Subdivision - These are developments that involve the subdivision of property. One or more detention basins may be required depending on the natural drainage patterns of the development.
- Single Lot Commercial - Generally, these are developments on lots that are not part of a subdivision. Basins shall be designed for full development of the lot based on zoning unless land use restrictions dictate less land is available for development.
- Multiple Properties - Multiple properties or developments may be served by a regional basin that is not within the boundary of the development.
4.2 Type of Detention Facilities
Generally, the type of detention is determined by the required design objectives and the appearance and function desired by the developer. Detention basins fall into one of the following three design categories:
- Dry detention basin - Designed for several different frequency rainfalls for flood control only. Dry basins drain over 1 to 2 days. The outlet is typically composed of orifices and/or weirs.
- Extended detention basin - Designed for pollutant removal and potentially for flood control. Extended detention basins drain over an extended period of time, typically 1 to 3 days. The outlet is typically composed of a filtered control as well as orifices and/or weirs.
- Wet basin – Awet basin, also referred to as a retention basin, contains a permanent pool of water and is designed for pollutant removal, flood control, and often aesthetics. Wet basins may be designed to drain down to the permanent pool level over a short or long period of time.
Unplanned(or non-engineered)storage may also be present in features such as sinkholes and the upstream side of railroad and highway embankments. When planning a development along a major waterway, such non-engineered storage should be accounted for when calculating existing flow rates but generally should not be accounted for when calculating ultimate future peak flow rates.
4.3 In-line versus Off-Line Storage
In developments where an offsite area drains across the property, the developer must consider whether to: 1) construct an off-line detention basin to capture only the local site runoff and bypass the offsite runoff around the basin, or 2) construct an in-line basin with offsite runoff directed through the basin. In-line and off-line storage are defined below:
- Off-Line Storage: A facility located off-line from the drainageway that receives runoff from a smaller drainage area or from a particular site. These facilities often are smaller and may store water less frequently than in-line facilities. This is the approach preferred by the City for cases where an offsite area drains across a property.
- In-Line Storage: A facility located in-line with the drainageway that captures and routes the entire flood volume. A disadvantage with in-line storage is that it must be large enough to store and convey the total flood volume of the entire tributary catchment, including offsite runoff, if it exists. A U.S. Army Corps of Engineers (USACE) Section 404 permit for dredge and fill activities within the waters of the United States and a Section 401 Water Quality Certification from the Arkansas Department of Environmental Quality (ADEQ) are typically required for in-line storage. In-line storage is only allowed by the City if it can be demonstrated that off-line storage is not practicable.
For all types of basins, the designer should consider safety, aesthetics, and multipurpose uses during both wet and dry conditions. The use of other specialists such as landscape architects, biologists, and planners is encouraged to achieve these objectives.
5.1 Detention Volume Design Methods
Two design methods that are acceptable for use in detention design are summarized in Table DET-1. The appropriate method is dependent on the detention volume required and the impervious area added by the development. When determining which method is acceptable, the calculated volume takes precedence over the impervious area added.
5.2 Outlet Works Design
To maintain peak flow rates at pre-development levels, a multi-frequency outlet design approach is required. The designer must demonstrate that the 1-, 2-, 5-, 10-, 25-, 50- and 100-year post-development peak flow rates are limited to the corresponding pre-development flow rates. The outlet design must be compatible with the calculated volume and volume design for each design event to ensure peak discharges do not exceed pre-development rates for each design event. For example, for the water surface elevation corresponding to the volume calculated for the 10-year event, the outlet should be designed to discharge no greater than the 10-year pre-development peak flow rate. If the facility is also providing water quality treatment, then the detention volume and outlet design must also incorporate the WQCV (See Chapter 9 – Water Quality).
The hydraulic capacity of the various components of the outlet works (i.e., pipes, orifices, weirs) can be determined using standard hydraulic equations described below. (Note: Because the discharge pipe of an outlet works functions as a culvert, the reader is directed to Chapter 7 – Culvert & Bridge Hydraulic Design, for guidance regarding the calculation of the hydraulic capacity of outlet pipes).
To create a rating curve for an entire outlet, a composite total outlet rating curve can be developed based on the rating curves developed for each of the components of the outlet and then selecting the most restrictive element that controls the release at a given stage.
6.1 Potential for Multiple Uses
When designing a detention facility, multi-purpose uses, such as active or passive recreation and wildlife habitat, are encouraged in addition to providing the required storage volume. Facilities used for recreation should be designed to inundate no more frequently than every two years.
6.2 Detention Basin Location
Detention basins should be located at the natural low point of the site and must discharge to the natural drainage location to minimize downstream impacts.
6.3 Detention Basin Grading
Detention basin grading shall conform to the natural topography of the site to the maximum extent practical. Developments should be laid out around the existing waterways and proposed detention basin (see Figure DET-3). Layouts conforming to existing topography often reduce construction costs, land disturbance and maintenance costs, and increase aesthetic quality. Existing slopes should be used to the maximum extent practical. If slopes are modified, the maximum allowable slope is 3H:1V. Exceptions to these criteria must be justified through engineering studies and are subject to City approval. Significant modifications to existing topography may require geologic impact studies and geotechnical analysis, particularly where shallow bedrock or karst topography is believed to be present.
6.4 Geometry of Storage Facilities
The geometry of a detention facility depends on specific site conditions such as adjoining land uses, topography, geology, existing natural features, volume requirements, etc. A cross-section of the proposed detention facility shall be provided in the plans showing at a minimum the basin profile, normal water surface elevation (WSE) if applicable, the 100 year WSE and the outlet works. The following criteria apply to the geometry of detention facilities:
- Pond side slopes - Pond side slopes of 3:1 (H:V) are the maximum permissible; slopes between 5H:1V and 10H:1V are encouraged. If slopes steeper than 3H:1V are desired, the engineer must demonstrate why 3H:1V slopes are not feasible and provide an explanation regarding how the steeper slopes will be maintained and how safety concerns will be addressed. Steeper slopes are subject to City approval. For all wet detention facilities, a safety bench sloped at 10:1 and 15-feet wide shall be provided starting at the normal water surface elevation unless a safety fence is provided (see Section 6.11)
- Pond bottom slopes – For dry detention ponds, the pond bottom slopes must be a minimum of 1 percent to ensure drainage.
- Pond shape - The water quality portion of a facility (if present) should be shaped with a gradual expansion from the inlet and a gradual contraction toward the outlet, thereby minimizing short-circuiting. The minimum length:width ratio shall be 2:1. Storage facility geometry and layout are best developed with input from a land planner/landscape architect.
- Low-flow channel - A 5-ft wide concrete low-flow channel may be required. However, for water quality basins or wetlands, concrete low-flow channels are not desirable, in which case alternative materials, as described below, should be discussed with and approved by City staff.
- Materials - Between the 1- and 10-year design flows, hard armor/grass composites may be considered, provided that velocities are low enough to ensure stability. Above the 10-year water surface, sod, turf reinforcement mat or other composite designs may be used, provided that they are appropriate for design velocities. Sod is acceptable for velocities less than 5 ft/s. Turf reinforcement mat or other composite materials are acceptable for velocities less than 8 ft/s. For velocities of 8 ft/s or more, a manufactured hard lining, or other suitable armor material is necessary (see Chapter 6 – Open Channel Flow Design).
6.5 Embankments and Cut Slopes
If the detention storage structure is a jurisdictional facility, meaning it is subject to regulation by the Arkansas Soil and Water Conservation Commission (ASWCC), the embankment shall be designed, constructed, and maintained to meet most current ASWCC criteria for jurisdictional structures. The design for an embankment of a storm water detention or retention storage facility shall be based upon a site-specific engineering evaluation. The embankment shall be designed to prevent catastrophic failure during the 100-year and larger storms. The following criteria frequently apply (ASCE and WEF 1992):
- Side Slopes—For ease of maintenance, side slopes of the embankment shall not be steeper than 3:1 (H:V). The embankment’s side slopes shall be well vegetated, and riprap protection (or the equivalent) may be necessary to protect it from wave action on the upstream face, especially in retention ponds.
- Emergency Spillway—An emergency spillway is required to convey the 100-year flow if the primary outlet becomes clogged or for storm events larger than the 100-year event. The spillway shall be designed to accommodate the 100-year flow from the fully developed watershed assuming no upstream detention.
- Freeboard—The elevation of the top of the embankment shall be a minimum of 1 foot above the water surface elevation when the emergency spillway is conveying the maximum design or emergency flow. When relevant, all Arkansas Natural Resources Commission dam safety criteria must be carefully considered when determining the freeboard capacity of an impoundment.
- Settlement—The design height of the embankment shall be increased by roughly 5 percent to account for settlement. All earth fill shall be free from unsuitable materials and all organic materials such as grass, turf, brush, roots, and other material subject to decomposition. The fill material in all earth dams and embankments shall be compacted to at least 95 percent of the maximum density obtained from compaction tests performed by the Modified Proctor method in ASTM D698.
- Embankment—A geotechnical engineer shall provide a stamped report for any embankment over 10-feet tall. The City reserves the right to require a report for any embankment between 5 and 10-feet as well. (See Section 6.14)
- Vegetation—No trees shall be planted or allowed to grow on a detention facility embankment. Vegetation will be required elsewhere within the detention facility per Section 6.10 of this Chapter.
6.6 Linings
Detention facilities may require an impermeable clay or synthetic liner for a number of reasons. Storm water detention and retention facilities have the potential to raise the groundwater level in the vicinity of the basin. If the basin is close to structures or other facilities that could be damaged by raising the groundwater level, consideration should be given to lining the pond. An impermeable liner may also be warranted in a retention basin where the designer seeks to limit seepage from a permanent pond. Alternatively, there are situations where the designer may seek to encourage seepage of storm water into the ground. In this situation, a layer of permeable material may be warranted.
6.7 Inlets and Forebays
Inlets to the facility should incorporate energy dissipation to limit erosion and should be designed in accordance with drop structure criteria in Chapter 6 – Open Channel Flow Design, or using other approved energy dissipation techniques. In addition, forebays or sediment traps should be incorporated at inflow points to storage facilities to settle sediment being delivered by stormwater to the facility.
A forebay, while optional, should be considered when the design volume exceeds 20,000 ft3 or a large sediment, trash, or debris load is anticipated due to upstream land use. A forebay provides an opportunity for larger particles to settle out in the inlet area, which has a solid surface bottom to facilitate mechanical sediment removal. The forebay volume for the extended dry detention basin should be between 3 and 5 percent of the design volume. Forebays will need regular maintenance to reduce the sediment being transported and deposited on the storage basin’s bottom.
6.8 Outlet Works
Outlet works shall be sized and structurally designed to release at the specified flow rates without structural or hydraulic failure. Design guidance for outlet works used for water quality purposes is included in Chapter 9 – Water Quality. A staff gauge shall be installed on all outlet works. The staff gauge shall be a porcelain-coated metal USGS Type C gauge.
6.9 Trash Racks
Trash racks are required and shall be sized so as not to interfere with the hydraulic capacity of the outlet and must be designed in a manner that is protective of public health, safety and welfare. See Chapter 9 – Water Quality for minimum trash rack sizes.
6.10 Vegetation
The type of vegetation specified for a newly constructed storage facility is a function of several factors, including:
- The frequency and duration of inundation of the area
- Soil types
- The desire for native versus non-native vegetation
- Other potential uses of the area (e.g., park, open space, etc.)
- All plants within required stormwater facility areas shall be appropriate species approved by the City Engineer. The developer must plant a variety of tree and shrub species so that no single species comprises more than 25% of the plantings.
- The design for plantings shall minimize the need for herbicides, fertilizers, pesticides or soil amendments at any time before, during and after construction and for a long-term basis
- Plantings should be designed to minimize the need for mowing, pruning and irrigation. Grass or wildflower seed shall be applied at the rates specified by the suppliers. If plant establishment cannot be achieved with seeding by the time of substantial completion of the stormwater facility portion of the project, the contractor shall plant the area with wildflower sod, plus, container plants or some other means to complete the specified plantings and protect against erosion as approved by the City Engineer
- Plantings shall not impede the primary function of the stormwater facility. Should plantings be proposed that call into question the ability of the stormwater facility to operate to the satisfaction of the City Engineer, the developer shall provide sufficient information (calculations, etc.) for review, at the time of submittal
- Dry detention basins shall be sodded up to the top of bank. Wet detention basins shall be sodded from the top of bank to the normal water surface elevation.
- A planting plan should be developed for new facilities to meet their intended use and setting in the urban landscape. The stormwater facility area for a dry detention or wet retention facility is defined to be equivalent to the area of the detention basin, including the bottom and the side slopes, plus a 10-foot buffer around the detention basin. The developer must install minimum plant material quantities per 3,000 square feet of the dry detention facility area as follows:
- 1 tree from the canopy tree list in the UDC
- 2 trees from the understory tree list in the UDC
- 2 large shrubs
- 6 shrubs/large grass-like plants, 1-gallon containers or equivalent
- Ground cover plants, 1 per 12 inches on center with triangular spacing, unless sod is specified and installed
- At least 50% percent of the facility must be planted with grasses or grass-like plants
- Wildflowers, native grasses and ground covers shall be designed to require mowing no more than twice annually.
- The developer must install minimum plant material quantities per 1,500 square feet of a wet retention facility area as follows:
- 1 tree from the canopy tree list in the UDC
- 2 trees from the understory tree list in the UDC
- Trees planted within the stormwater facility area for wet retention facilities must be planted in a manner so as to not obscure sight of the pond or on the top of the constructed berms. Plantings must be within the slopes of the pond.
6.11 Public Safety Concerns
For retention ponds (i.e., a pond that typically has a permanent pool), the pond must either have a safety bench or be surrounded by a minimum 48-inch tall wrought iron fence or equivalent, as approved by City.
For detention ponds (i.e., a pond that is generally dry), and especially if children are apt to play in the vicinity of the impoundment, use of relatively flat side slopes along the banks is advisable. In addition, installation of landscaping that will discourage entry, such as thick, thorny shrubs, is suggested for locations along the periphery, near the inlets and at steeper embankment sections.
The use of thin steel plates as sharp-crested weirs should be avoided because of potential accidents, especially with children. Trash racks must protect all outlets, especially ones made of a thin plate.
If the impoundment is situated adjacent to and at the same or a lower grade than a street or highway, installation of a guardrail between the roadway and the pond is required.
Consideration shall be given for safety at outlet structures. The City reserves the right to require safety appurtenances at outlet structures.
6.12 Operations and Maintenance
Maintenance considerations during design include the following (ASCE and WEF 1992):
- Maintenance access - The facility shall be accessible to maintenance equipment for removal of silt and debris and for repair of damages that may occur over time. An access easement and/or right-of-way is required to allow access to the impoundment by the owner or agency responsible for maintenance. The access shall have a maximum grade of 10 percent and have a solid driving surface of gravel, rock, concrete, or reinforced turf on a stabilized bed designed to support vehicle loads.
- Sediment removal considerations - Permanent ponds shall have provisions for complete drainage for sediment removal or other maintenance. The frequency of sediment removal will vary among facilities, depending on the original volume set aside for sediment, the rate of accumulation, rate of growth of vegetation, drainage area erosion control measures, and the desired aesthetic appearance of the pond. Sediment should be removed when its depth accumulates to 6 inches. A depth gauge is required at the outlet to facilitate determining when sediment removal is necessary as well as the pond depth. Also, appearance may dictate more frequent cleaning. Detention facilities shall be designed with sufficient depth to allow accumulation of sediment for several years prior to its removal. A general guideline is to oversize the storage capacity of a detention facility by 20 percent of the WQCV (see Chapter 9 – Water Quality) to allow for sediment storage.
- Sediment concerns - Secondary uses that are incompatible with sediment deposits should not be planned unless a high level of maintenance will be provided. French drains or the equivalent are almost impossible to maintain and should be used with discretion where sediment loads are apt to be high.
- Dissolved oxygen concentrations in pond - Adequate dissolved oxygen supply in permanent ponds (to minimize odors and other nuisances) shall be maintained by artificial aeration. Use of fertilizer and pesticides adjacent to the permanent pool pond should be carefully controlled.
- Underground tank maintenance - Underground tanks or conduits designed for detention shall be sized and designed to permit pumping. Multiple entrance points shall be provided to remove accumulated sediment and trash.
- Permanent pool depth - Permanent pools shall have a minimum depth of 6 feet to discourage excessive aquatic vegetation on the bottom of the basin, unless the vegetation is specifically provided for water quality purposes.
- Aesthetics and landscaping - Trash racks and/or fences are often used to minimize hazards. These may become eyesores, trap debris, impede flows, hinder maintenance, and, ironically, fail to prevent access to the outlet. On the other hand, desirable conditions can be achieved through careful design and positioning of the structure, as well as through landscaping that will discourage access. Creative designs, integrated with innovative landscaping, can be safe and can also enhance the appearance of the outlet and pond. In addition, bank slopes, bank protection, and vegetation types are important design considerations for site aesthetics and maintainability.
- Avoid moving parts - To reduce maintenance and avoid operational problems, outlet structures should be designed with no moving parts (i.e., use only pipes, orifices, and weirs). Manually and/or electrically operated gates should be avoided and must be approved by City staff during the design concept stage of development.
- Outlet openings - To reduce maintenance, outlets should be designed with openings as large as possible, be compatible with the depth-outflow relationships desired, and be designed with water quality, safety, and aesthetic objectives in mind.
- Resistant to vandalism - Outlets should be robustly designed to lessen the chances of damage from debris or vandalism.
- Maintenance of forebays and sediment traps - Clean out all forebays and sediment traps on a regular basis or when routine inspection shows them to be ¾ full.
See Chapter 9 – Water Quality, for additional recommendations regarding operation and maintenance of water quality related facilities, some of which also apply to detention facilities designed to meet other objectives.
6.13 Access
All-weather, stable access to the bottom, inflow, forebay, and outlet works areas shall be provided for maintenance vehicles. Maximum grades should be 10 percent, and a solid driving surface of gravel, rock, concrete, or reinforced turf on a stabilized bed designed to support vehicle loads.
6.14 Geotechnical Considerations
The designer must account for the geotechnical conditions of the site. These considerations may include issues related to embankment stability, geologic hazards, seepage, and other site-specific issues such as karst topography. It may be necessary to confer with a qualified geotechnical engineer during both design and construction, especially for larger detention and retention storage facilities.
A geotechnical engineer shall provide a stamped design for any dam 10 feet or more in height. This design shall include, but may not be limited to, minimum factors of safety for stability (including global stability). The City may require a design for dams 5-10 feet in height. Unless otherwise shown, dam embankments shall be compacted at 95% standard proctor within ± 2% of optimum moisture content.
6.15 Environmental Permitting and Other Considerations
The designer must account for environmental considerations surrounding the facility and the site during its selection, design and construction. These can include regulatory questions such as: 1) Will the facility be located in a jurisdictional wetland?, or 2) Will the facility be located on a waterway regulated by the USACE as a “Water of the U.S.,” and 3) Are there threatened and endangered species or habitat in the area? See Chapter 1 – Stormwater Submittal Requirements for more information on regulatory and permitting requirements.
Other non-regulatory environmental issues should also be taken into account. Detention facilities can become breeding grounds for mosquitoes unless they are properly designed, constructed and maintained. Area residents may object to facilities that impact riparian habitat or wetlands. Considerations of this kind must be carefully accounted for, and early discussions with relevant federal, state and local regulators are recommended.
7.1 Rational Formula-Based Modified FAA Procedure Example
Use the Rational Formula-Based Modified FAA Procedure (described in Section 5.1.1) to determine the required detention volume for the 100-year storm event for a 40-acre watershed, based on single-family land use. The watershed has a 100-year runoff coefficient of 0.56 and a time of concentration of 25 minutes. The post-development 100-year, undetained peak flow rate from the watershed is 157 cfs. The pre-project 100-year peak flow rate for the site is 90 cfs.
Given the information above, the following variables are known:
A = 40 acres
C= 0.56
Qpo = 90 cfs
tc = 25 minutes
Following the methodology outlined in Section 5.1.1, Table DET-3 can be created to determine the required detention volume.
The required detention volume is determined from the maximum storage volume (see column 7 in Table DET-3). For this example, the required detention volume is 110,832 ft3 or 2.5 acre-feet (see shaded cell in Table DET-3). Because this volume exceeds the 20,000-ft3 threshold for applicability of the FAA method for final detention sizing, this should be treated as an initial estimate, and a hydrograph-based method should be used to determine detention storage requirements.
7.2 Hydrograph Volumetric Method Example
Use the Hydrograph Volumetric method (described in Section 5.1.2.1) to determine the preliminary detention volume required, given an inflow hydrograph for a 20-acre commercial site (calculated according to guidelines in Chapter 3 – Determination of Stormwater Runoff) and a maximum allowable release rate of 30 cfs.
The tabular format for use with the inflow hydrograph method is shown in Table DET-4 below. The time and flow ordinates of the inflow hydrograph are entered in columns 1 and 2. Based on the inflow hydrograph, the allowable release rate of 30 cfs is matched on the falling limb at a time between 102 and 108 minutes, so 108 minutes is used as an estimate for Tp.
7.3 Modified Puls Method - Reservoir Routing Example
Use the Modified Puls Method (described in Section 5.1.2.2) to determine the outflow hydrograph for a proposed detention facility. Given the inflow hydrograph from the example in 7.2 for a 20-acre commercial site, a detention basin with the stage-storage relationship in Table DET-5 is proposed.
CALCULATION METHODOLOGY FOR FEE IN-LIEU-OF DETENTION
For sites that are 1-acre in size or smaller, for sites that are being redeveloped, or for sites of any size that are adjacent to a primary channel (see primary channel description in Section 2.5 of Chapter 6 – Open Channel Flow Design), the City may allow a developer/property owner to make a monetary payment or some other form of valuable consideration in lieu of implementing the stormwater detention measures described in this chapter. The City shall make the determination of whether fee-in-lieu of detention will be allowed or required on a case by case basis based upon capacity of the receiving stormwater drainage system and whether regional detention facilities are either proposed or in place and the increase in flow rates to these downstream conditions will not adversely affect downstream property owners. The fee shall be paid at the time the final plat is approved by City Council or prior to issuance of any Certificate of Occupancy for a Site Development. When these fees are collected, they shall be deposited into a stormwater capital improvements fund, which will be used for future or ongoing stormwater improvement and regional detention projects that will benefit stormwater management in the community.
The fee in-lieu of detention rate is set at $0.20/ft2 of impervious area on developments that are approved for fee in-lieu.
Purpose of the Chapter
The purpose of this chapter is to provide guidance for designing facilities to convey stormwater runoff in open channels. The goal of open channels is to convey stormwater runoff from and through urban drainage areas without damage to adjacent properties/developments, to the open channel, or to the storm drainage system connected to it. Specifically, this chapter provides information on physical channel criteria and design methodology necessary to design open channels according to City requirements.
Chapter Summary
Once stormwater runoff has been collected in a storm drainage system it continues to combine with other sections of the storm drainage system until, typically, culminating into open channels. Except for roadside ditches and swales, open channels are nearly always a component of the major drainage system. There are a number of factors which must be considered in determining whether to specify an open drainageway as opposed to an underground storm drain: material and installation cost, maintenance costs and problems, acceptability to the developer or home buyer, public safety, water quality, appearance, etc. Effective planning and design of open drainageways can significantly reduce the cost of storm drainage facilities, while enhancing the quality of the development.
In planning a development, the designer should begin by determining the location and the width of existing drainageways. Streets and lots should be laid out in a manner to preserve the existing drainage system to the greatest degree practical. Constructed channels should be used only when it is not practical or feasible to utilize existing drainageways.
This section covers the evaluation of capacity and stability of natural drainage channels, and design of constructed drainage channels.
City Open Channel Flow Requirements
To comply with the City requirements for open channel flows, channels must be planned and designed to address the applicable criteria outlined below:
- Layout and Structure
- Safety of the general public and preventing damage to private property are the most important considerations in the selection of the cross-sectional geometry and type of open channel. Channel shape, type, and alignment should be selected to ensure that velocities and depths do not exceed those specified in Section 2.0 and Section 3.0 of this chapter. The range of design channel discharges should be selected by the designer based on flood hazard risks and local site conditions.
- Channels must be designed with long-term stability in mind. Following the guidelines and design criteria presented in this chapter for designing open channels provides reasonable parameters that when met provide adequate channel stability. Regular channel maintenance will be a necessary part of maintaining channel stability as well. The design of open channels must consider the frequency and types of maintenance expected and make allowance for maintenance access along and within the channel.
- Environmental and Regulatory
- Environmental and regulatory criteria as mentioned herein are not discussed in detail in this Manual. Local, state, and federal regulations must be reviewed and addressed for the appropriate agency having jurisdiction over impacted areas.
- Environmental impacts of channel modifications, including disturbance of fish habitat, wetlands and channel stability, should be assessed and if needed remediation planned within the overall drainage design for such impacted areas.
- Channel designs that impact existing open channels shall satisfy the policies of the Federal Emergency Management Agency (FEMA) applicable to floodplain management and regulation. Wherever possible, disturbance of natural channels/streams shall be avoided and encroachment onto flood plains shall be minimized to the fullest extent practical.
- Coordination with other Federal, State and local agencies (US Army Corp of Engineers, US Fish and Wildlife Service, Arkansas Department of Energy & Environment Division of Environmental Quality, Arkansas Historic Preservation Program, etc.) concerned with water resources planning must be carried out as part of the design of open channels to ensure all laws and regulations are adhered to in a design.
Summary of Critical Design Criteria
The summary below outlines some of the most critical design criteria essential to design engineers for proper drainage design of open channels according to City of Rogers’ requirements. The information below contains exact numerical criteria as well as general guidelines that must be adhered to during the design process. This section is meant to be a summary of critical design criteria for this section; however, the engineer is responsible for all information in this chapter. It should be noted that any design engineer who is not familiar with Rogers’ Drainage Criteria Manual and its accepted design techniques and methodology should review the entirety of this chapter.
Maintenance Classifications – Primary Channels, Secondary Channels, and Tertiary Channels | |
|---|---|
Primary Channels |
|
Secondary Channels |
|
Tertiary Channels |
|
More detailed information can be found in Section 2.5 and Table OC-7a
Refer to the City of Rogers’ GIS site for Streambank Inventory-BEHI (Bank Erosion Hazard Index) for areas of special design considerations (http://gis.rogersar.gov).
In addition to the design criteria outlined in the following tables in this chapter, primary channels will also need to incorporate natural channel design elements, unless otherwise approved by the Director of Community Development and the City Engineer. Natural channel design elements would include riparian zones, floodplains, alluvial landscapes, natural weirs and vanes, toe wood along channel banks, etc.
1.1 General
Major drainage is the cornerstone of an urban storm runoff system. The major drainage system will exist whether or not it has been planned and designed, and whether or not urban development is wisely located in respect to it. Thus, major drainage must be given high priority when considering drainage improvements.
A core component of any major drainage system is open channels. Open channels are the most common major drainage system component used to transport all of the stormwater runoff collected in drainage systems. Open channels are versatile and come in several different types and consist of several different channel components. Open channels are in effect the final instrument within a drainage system for handling stormwater and as such have the final interaction with stormwater before it flows into a major river or other large body of water.
While the primary function of open channels is conveyance of runoff, many design decisions contribute to the role of channels in the urban environment in terms of stability, multiple use benefits, social acceptance, aesthetics, resource management, and maintenance. It is important for the engineer to be involved from the very start of a land development project, so that the criteria in this Manual have bearing on the critical planning decisions involved in route selection for open channels within the major drainage system. The importance of route selection cannot be overstated since the route selected will influence every element of the major drainage project from the cost, to the type of channel to use, to the benefits derived to the community.
Secondary and primary open channels shall be placed in Drainage and Recreation Easements.
1.2 Types of Major Open Channels
The types of major drainage channels available to the designer are numerous. Section 2.3.1 describes in detail the types of channels engineers can consider as potential major open channels in urban areas and then select the one that addresses the hydraulic requirements, environmental considerations, sociological/community impact and needs, permitting limitations the best. Table OC–6 lists the types of channels discussed within this chapter along with the City’s attitude toward each channel type.
1.3 Overview of Chapter
This chapter addresses the major topics related to the design of open channels, beginning with essential background on the issues of open channel planning and engineering (Section 1.4) and fluvial geomorphology (Section 1.5). General open channel hydraulics and preliminary design criteria are presented in Section 2.0. It is the responsibility of the designer to be knowledgeable of open channel hydraulics, and, therefore, the key principles and equations are reviewed without extensive background of the subject matter, theoretical considerations, etc. Section 3.0 contains specific design criteria for a variety of channel types and includes example calculations, typical cross sections, and other representative design details.
1.4 Issues in Open Channel Planning and Engineering
The most fundamental function of open channels is conveyance of the major storm runoff event, and an important characteristic is their stability during major and minor storms. Stability must be examined in the context of the future urbanized condition, in terms of both runoff events and altered base flow hydrology. Base flow within a channel is flow that is not caused by rainfall events, but rather aquifer seepage resulting from a variety of causes. Some of the most common base flow sources are yard irrigation, artesian groundwater, and other constant flow sources. Urbanization in the City of Rogers commonly causes base flows to increase, and the planner and engineer must anticipate and design for this increase.
In addition to stability issues, there are many planning and engineering decisions that contribute to the role of open channels in the urban environment, in terms of multiple use benefits, social acceptance, aesthetics, and resource management. The choices of the type and layout of open channels are of prime importance.
Open channels for transporting major storm runoff are the most desirable type of major drainageway because they offer many opportunities for creation of multiple use benefits such as incorporation of parks and greenbelts along the channel and other aesthetic and recreational uses that closed-conveyance drainageway designs preclude. Open channels are also usually less costly and they provide a higher degree of flood routing storage. Where opportunities are presented for establishing primary or secondary channels, or enhancing the functionality of already existing open channels, deviating from utilizing an open channel would first need to be approved by the City Engineer.
The choice of the type of open channel is a critical decision in planning and design of major drainageways. The preferred channel is a stable natural one carved by nature over a long period of time that can remain stable after urbanization. Generally, the closer an artificial channel’s character can be made to that of a natural channel, the more functional and attractive the artificial channel will be. In an urban area, however, it is rarely feasible to leave a natural channel untouched since urbanization alters the hydrology of the watershed. Consequently, some level of stabilization is usually necessary to prevent the channel from degrading and eroding. Channel type evaluation should be done in ascending order as shown in Table OC-6.
1.5 Fluvial Geomorphology
A drainage system within a watershed involves flowing water or movement of water, thus the term fluvial. When flowing water develops a drainage pattern or surface forms, the process is identified as fluvial geomorphology. Surface form characteristics represented by open channels (natural and manmade) behave in a complex manner dependent on watershed factors such as geology, soils, ground cover, land use, topography, and hydrologic conditions. These same watershed factors contribute to the sediment eroded from the watershed and transported by the stream channel. The sediments moved by the flowing water also influence channel hydraulic characteristics. The natural-like channel and stabilization systems recommended in this Manual are based on fluvial geomorphology principles. The remainder of this section will provide the reader with a basic understanding of the workings and evolution of open channels within an urban watershed.
2.1 General Open Channel Flow Hydraulics
When performing open channel design, hydraulic analyses must be completed to evaluate flow characteristics including flow regime, water surface elevations, velocities, depths, and hydraulic transitions for multiple flow conditions. Hydraulic grade lines and energy grade lines shall be prepared on all design projects.
The purpose of this section is to provide the designer with an overview of open channel flow hydraulics principles and equations relevant to the design of open channels. The reader should already be familiar with the open channel flow principles discussed in this section. Water surface profile computations are not addressed herein, and the reader is referred to other references [such as Chow (1959), Daugherty and Franzini (1977), and King and Brater (1963)] for discussion of this topic.
2.4. Design Flows
Open channels must be able to convey the flow from a fully urbanized watershed for the design considerations outlined here. Methods for calculating the flow from a fully urbanized watershed are described in Chapter 3 – Determination of Stormwater Runoff. A channel’s lining, geometry (depth, width, alignment, etc.), and freeboard characteristics shall be designed in relation to the channel’s maintenance classification as defined in Section 2.5 of this chapter. Channels shall be designed according to the following design storm frequencies as follows:
- Primary Channel – 100-year design storm with ≥2-foot of freeboard
- Secondary Channel – 100-year design storm with ≥1-foot of freeboard
- Tertiary Channel – 10-year design storm and pass 100-year design storm between structures
Furthermore, open channels, including residual floodplain, must be able to convey the flow from a fully urbanized watershed, assuming no upstream detention, for the event with a 100-year recurrence interval without significant damage to the system. In addition to the capacity consideration of the 100-year event, the designer must also consider events of lesser magnitudes. For the low-flow channel in any type, 5-year storm peak discharge for fully developed conditions, assuming no upstream detention, is to be used for its design. Base flow must also be assessed, especially for grassed channels, channels with wetland bottoms, and bioengineered channels. Base flows are best estimated by examining already-urbanized watersheds that are similar to the planned urban area in terms of imperviousness, land use, and hydrology.
2.5. Maintenance Classification – Primary Channels, Secondary Channels, and Tertiary Channels
In order for open channels to function according to their original design, channels require periodic maintenance and repair. Maintenance and repair includes removal of debris and litter from the channel, regular mowing of grass-lined and composite channels to maintain expected channel roughness, repair and stabilization of eroded channel banks/bottoms, repair/replacement of any erosion control structures (including but not limited to channel drop structures, armored channel lining, etc.), and any other necessary upkeep work within the established open channel boundaries that don’t reflect the channels intended purpose.
Being that open channels provide a benefit to a number of different users the City has established certain physical and operational criteria that designate channels within the city limits as either primary, secondary, or tertiary. The definitions below along with Table OC-7a describe the use, maintenance/repair responsibilities, and designation criteria of each of the channels.
- Primary Channel – a major open channel that serves as a primary waterway to conduct runoff generated in a large composite area (typically ≥ 30-acres). More so, any channel that has a flood zone (floodway, floodplain, etc.) as determined/studied by the City and/or FEMA is to be considered a primary channel. Runoff conducted by primary channels is collected in the channel from discharges of a watershed, closed storm sewer systems, secondary and tertiary channels, and from the convergence of other primary channels. These types of channels are to be maintained by the City, POA, developer of the subdivision or other responsible entity for a development and shall be placed in a Drainage and Recreation Easement. Designate extent of 100-year water surface elevation on grading plan and as a Drainage and Recreation Easement.
- Secondary Channel – a moderate open channel that collects runoff from storm sewer systems, tertiary and other secondary channels, and feeds the runoff into primary channels. Drainage areas for secondary channels typically range from ≥ 2-acres and ≤ 30-acres. These types of channels are to be maintained by a POA, developer of the subdivision, or other responsible entity for a development and shall be placed in a Drainage and Recreation Easement. Designate extents of 100-year water surface elevation on grading plan and as a Drainage and Recreation Easement.
- Tertiary Channel – a small minor channel that serves as a conduit to channel runoff (typically ≤ 2-acres). These types of channels are to be maintained by the owners of the property which the channel serves. Maintenance responsibilities for the property owner end at the furthest point upstream and/or downstream the channel exists within the property’s legal recorded boundaries. These channels are not typically placed in a drainage easement.
3.1. Grass-Lined Channels
Grass-lined channels are considered by the City the most desirable type of artificial channels for new development where natural channels are absent or have limited environmental value. Channel storage, lower velocities, and aesthetic and recreational benefits create advantages over other channel types.
3.2. Composite Channels
When the trickle channel flow capacity limits, as discussed in Section 3.1.4, are exceeded the use of a composite channel is required, namely a channel with a stabilized low-flow section and an overflow section above it to carry major flow. Composite channels are, in essence, grass-lined channels in which more dense vegetation (including wetland-type) is encouraged to grow on the bottom and sides of the low-flow channel. Hence they are sometimes known as “wetland bottom” channels. Under certain circumstances, such as when existing wetland areas are affected or natural channels are modified, the USACE’s Section 404 permitting process may mandate the use of composite channels that will have wetland vegetation in their bottoms. In other cases, a composite channel with a wetland bottom low-flow channel may better suit individual site needs if used to mitigate wetland damages elsewhere or if used to enhance urban stormwater runoff quality. Composite channels can be closely related to bioengineered and natural channels. Composite channels can provide aesthetic benefits, habitat for aquatic, terrestrial and avian wildlife and water quality enhancement as base flows come in contact with vegetation.
Wetland bottom vegetation within a composite channel will trap sediment and, thereby, reduce the low-flow channel’s flood carrying capacity over time. To compensate for this the channel roughness factor used for design must be higher than for a grass-lined channel. As a result, more right-of-way is required for composite channels that have the potential for developing wetlands in their bottom.
3.3. Concrete-Lined Channels
The use of concrete-lined channels is subject to City approval. Although not recommended for general use because of safety water quality and aesthetic reasons; hydraulic, topographic, or right-of-way constraints may necessitate the use of a concrete-lined channel in some instances. A common constraint requiring a concrete-lined channel is the need to convey high velocity, sometimes supercritical, flow. Whether the flow will be supercritical or subcritical, the concrete lining must be designed to withstand the various forces and actions that cause overtopping of the bank, damage to the lining, and erosion of unlined areas.
Concrete-lined channels can be used for conveyance of both subcritical and supercritical flows. In general, however, other types of channels such as grass-lined channels or channels with wetland bottoms shall be used for subcritical flows. The use of a concrete-lined channel for subcritical flows shall not be used except in unusual circumstances where a narrow right-of-way exists.
3.4. Riprap-Lined Channels
The use of riprap-lined channels is discouraged and subject to City approval. Channel linings constructed from riprap (grouted or partially grouted), soil riprap, grouted boulders, or wire-encased rock (gabion) to control channel erosion may be considered on a case-by-case basis for the following situations:
- Where major flows such as the 100-year flood are found to produce channel velocities in excess of allowable non-eroding values (5-ft/sec) or when main channel depth is greater than 5 feet.
- Where channel side slopes must be steeper than 3H:1V.
- For low-flow channels.
- Where rapid changes in channel geometry occur such as channel bends and transitions.
Design criteria applicable to these situations are presented in this section. Riprap-lined channels shall only be used for subcritical flow conditions where the Froude number is 0.8 or less. Loose stones serving as a protective blanket will not be accepted for riprap lining. Instead riprap shall either receive a full grout matrix or be partially grouted. The type of grouting, full or partial, a riprap lining is to receive will be as directed by the City. The grout for riprap receiving a full grout matrix shall adhere to the methods and specifications outlined in Table OC-12 of this Manual. Furthermore, requirements for riprap that is grouted that aren’t covered in this Manual shall adhere to ARDOT’s Standard Specification for Highway Construction – Section 816 – Filter Blanket and Riprap for Dumped Riprap (Grouted). Partially grouted riprap shall be designed, specified, and constructed according to the criteria presented in FHWA’s HEC 23 (2001) and other trusted sources on the subject. Furthermore, when used, it is required that all riprap outside frequent flow zones have the voids filled with soil, the top of the rock covered with topsoil, and the surface revegetated with native grasses. This combination of riprap, soil, and vegetation is considered soil riprap.
3.5. Bioengineered Channels
Bioengineered channels emphasize the use of vegetative components in combination with structural measures to stabilize and protect stream banks from erosion. The City advocates the integration of bioengineering techniques into drainage planning, design, and construction when the use of such channels is consistent with the City’s policies concerning flow carrying capacity, stability, maintenance, and enhancement of the urban environment and wildlife habitat. The following discussion on bioengineered channels interfaces closely with Section 3.2, Composite (Wetland Bottom) Channels, and Section 3.6, Natural Channels; designers are encouraged to read Section 3.2, Section 3.5, and Section 3.6, concurrently. In addition, because bioengineered channels require some structural assistance to maintain stability in urban settings, the designer should be familiar with the design of drop structures as discussed in FHWA’s Hydraulic Engineering Circular No. 14, 3rd Edition (HEC-14 2006).
3.6. Natural Channels
Natural waterways in the City of Rogers are sometimes in the form of steep, almost vertical stream banks, which have eroding banks and bottoms. On the other hand, many natural waterways exist in urbanized and to-be-urbanized areas, which have mild slopes, are reasonably stable, and are not currently degrading. If the channel will be used to carry storm runoff from an urbanized area, it can be assumed that the changes in the runoff regime will increase channel erosion and instability. Careful hydraulic analysis is needed to address this projected erosion. In most cases, stabilization of the channel will be required. Stabilization using bioengineering techniques, described in Section 3.5 of this chapter, has the advantage of preserving and even enhancing the natural character and functions of the channel. Some structural stabilization measures will also be required in combination with the bioengineered stabilization measures.
In the Rogers area, most natural waterways will need drops and/or erosion cutoff check structures to maintain a mild channel slope and to control channel erosion. Typically, these grade control structures are spaced to limit channel degradation to what is expected to be the final stable longitudinal slope after full urbanization of the tributary watershed. In the Rogers area, this slope, depending on watershed size and channel soils, has been observed to range from 0.30% to 1.5%, with the Illinois River itself approaching a slope of 0.06% to 0.10% within Benton County. Whenever feasible, natural channels shall be kept in as near a natural condition as possible by limiting modifications to those necessary to protect against the destabilizing hydrologic forces caused by urbanization.
Investigations needed to ensure that the channel is stable will differ for each waterway; however, generally, it will be necessary to measure existing cross sections, investigate the bed and bank material, determine soil particle size distribution, and study the stability of the channel under future conditions of flow. At a minimum, the designer should consider the concept of the stable channel balance discussed in Section 1.5.2 of this chapter, complete tractive force analysis, and apply the Leopold equations to evaluate channel stability and changes in channel geometry. Oftentimes, more sophisticated analysis will be required. When performing stability and hydraulic analyses, keep in mind that supercritical flow normally does not exist in natural-earth channels. During backwater computations, check to ensure that the computations do not reflect the presence of consistent supercritical flow (Posey 1960). Because of the many advantages of natural channels to the community (e.g., preservation of riparian habitat, diversity of vegetation, passive recreation, flood control and aesthetics), the designer should consult with experts in related fields as to method of development. Nowhere in urban hydrology is it more important to convene an environmental design team to develop the best means for using a natural waterway. It may be concluded that park and greenbelt areas should be incorporated into the channel design. In these cases, the usual rules of freeboard, depth, curvature, and other rules applicable to artificial channels often will need to be modified to better suit the multipurpose objectives. For instance, there are advantages that may accrue if the formal channel is designed to overtop, resulting in localized flooding of adjacent floodplain areas that are laid out for the purpose of being inundated during larger (i.e., > 10-year) flood events. See the Chapter 5 – Detention Design.
The following design criteria are required when evaluating natural channels:
- The channel and overbank floodplain shall have adequate capacity for the 100-year flood.
- A water surface profile shall be defined in order to identify the 100-year floodplain, to control earthwork, and to build structures in a manner consistent with Roger’s floodplain regulations and ordinances.
- Use roughness factors (n) representative of un-maintained channel conditions for analysis of water surface profiles. Roughness factors for a variety of natural channel types are presented in Table OC-7.
- Use roughness factors (n) representative of maintained channel conditions to analyze effects of velocities on channel stability. Roughness factors for a variety of natural channel types are presented in Table OC-7.
- Prepare plan and profile drawings of the channel and floodplain.
- Provide erosion-control structures, such as drop structures or grade-control checks, to control channel erosion and/or degradation as the tributary watershed urbanizes.
- Outfalls into natural channels shall be 2 feet above the channel invert to account for vegetation and sediment accumulation. The engineer should visit the site of any outfalls into natural drainageways to examine the actual ground surface condition.
Purpose of the Chapter
The purpose of this chapter is to provide guidance for culvert and bridge hydraulic design. The primary objective of a culvert or bridge is to convey stormwater flows, based on a design flow rate, through embankments or under roadways without causing damage to adjacent properties and developments, the roadway, or to the drainage structure. Specifically, this chapter provides information on the criteria and methodology necessary to design culverts and bridges according to City requirements.
Chapter Summary
The function of culverts and bridges is to convey surface water under a highway, city street, railroad, recreation trail, or other embankment. In addition to the hydraulic function, the culverts and bridges must carry construction, highway, railroad, or other traffic and earth loads. Therefore, culvert and bridge design involves both hydraulic and structural design considerations. The hydraulic aspects and design loading criteria of culvert and bridge design are set forth in this chapter.
Critical Design Criteria
The summary below outlines some of the most critical design criteria essential to design engineers for proper drainage design of streets, inlets, and storm sewers according to City of Rogers requirements. The information below contains exact numerical criteria as well as general guidelines that must be adhered to during the design process. This section is meant to be a summary of critical design criteria for this section; however, the engineer is responsible for all information in this chapter. It should be noted that any design engineer who is not familiar with Rogers’ Drainage Criteria Manual and its accepted design techniques and methodology should review the entirety of this chapter. If additional specific information is required, it will be necessary to review the appropriate section as needed.
1.1. Required Design Information
The hydraulic design of a culvert consists of an analysis of the required performance of the culvert to convey flow from one side of an embankment to the other. The designer must select a design flood frequency, estimate the design discharge for that frequency, and set an allowable headwater elevation based on the selected design flood and headwater considerations. These criteria are dictated by the City of Rogers. The culvert size and type can be selected after the design discharge, controlling design headwater, slope, tailwater, and allowable outlet velocity have been determined.
The design of a culvert requires that the following be determined:
• Impacts of various culvert sizes and dimensions on upstream and downstream flood risks, including the implications of embankment overtopping.
• How will the proposed culvert/embankment fit into the relevant major drainageway master plan, and are there multipurpose objectives that should be satisfied?
• Alignment, grade, and length of culvert.
• Size, type, end treatment, headwater, and outlet velocity.
• Amount and type of cover.
• Public safety issues, including the key question of whether or not to include a safety/debris rack.
• Pipe material.
• Need for protective measures against abrasion and corrosion.
• Need for specially designed inlets or outlets.
• Structural and geotechnical considerations, which are beyond the scope of this chapter. The City may require a structural or geotechnical analysis.
2.1. Key Hydraulic Principles
For purposes of the following review, it is assumed that the reader has a basic working knowledge of hydraulics and is familiar with the Manning’s, continuity and energy equations, which are presented in Chapter 6 – Open Channel Flow Design:
 (Equation CB-1)
where:
Q = Flow rate or discharge (ft3/sec)
n = Manning’s Roughness Coefficient
A = Flow Area (ft2)
R = Hydraulic Radius (ft)
S = Channel Slope (ft/ft)
 (Equation CB-2)
where:
Q = Flow rate or discharge (ft3/sec)
v = Velocity (ft/sec)
A = Flow Area (ft2)
 constant(Equation CB-3)
where:
v = Velocity (ft/sec)
g = Gravity (32.2 ft/sec2)
p = Pressure (lb/ft2)
γ = Specific weight of water (62.4 lb/ft3)
z = Height above datum (ft)
2.2. Energy Losses
In short conduits, such as culverts, the losses caused by the entrance can be as important as the friction losses through the conduit. The losses that must be evaluated to determine the carrying capacity of the culverts consist of inlet (or entrance) losses, friction losses along the length of the culvert and outlet (or exit) losses. These losses are described in Sections 2.2.1 through 2.2.3 of this chapter, respectively.
3.1 Determination of Design Flow Rate
The first step to consider in the hydraulic design of a culvert is the determination of the flow rate that the culvert must convey. There is no single method for determining peak discharge that is applicable to all watersheds. The method chosen should be a function of drainage area size, availability of data, and the degree of accuracy desired.
The following methods described in Chapter 3 – Determination of Stormwater Runoff, shall be used to generate peak discharge:
Rational Method – used for drainage areas less than 30 acres.
Soil Conservation Method – used for drainage areas between 30 and 2000 acres.
3.2. Computer Applications
Although nomographs can still be used for design, the majority of engineers currently design culverts using computer applications. Among these applications are the FHWA’s HY8 Culvert Analysis (Ginsberg 1987) and numerous proprietary applications such as CulvertMaster. FHWA’s HY8 Culvert Analysis (Version 7.2) is located FHWA’s webpage (http://www.fhwa.dot.gov) for download.
In addition, the City of Rogers has developed spreadsheets to aid in the sizing and design of culverts. Use of the RDM-Culvert spreadsheet application is required when sizing and designing culverts in the City of Rogers.
3.3. Design Considerations
The actual design of a culvert installation is more complex than the simple process of sizing culverts because of problems arising from topography and other considerations. Since the problems encountered are too varied and too numerous to be generalized, the information in the design procedure presented below is only a guide to design. Several combinations of entrance types, invert elevations, and pipe diameters should be evaluated to determine the most economic design that will meet the conditions imposed by topography and engineering. Descriptions of different variables that must be evaluated are presented in Sections 3.3.1 through 3.3.2 of this chapter.
3.4. Culvert Discharge Velocity
The outlet velocity must be checked to determine if significant scour will occur downstream during the major storm. If scour is indicated (which is normally the case), refer to Section 6.0 of this chapter for guidance on outlet protection. The maximum allowable discharge velocities from culverts for particular downstream conditions are listed in Table CB-3:
3.5. Minimum Slope
To minimize sediment deposition in the culvert, the culvert slope must be equal to or greater than the slope required to maintain a minimum velocity of 3-ft/sec flowing full as recommended in FHWA HEC-22. The slope should be checked for each design, and if the proper minimum velocity is not obtained, the pipe diameter may be decreased, the slope steepened, a smoother pipe used, or a combination of these measures implemented.
Table CB-4 – Entrance Loss Coefficients for Outlet Control, Full or Partly Full Flow
(FHWA HDS-5, 2005)
Circular Culvert | Coefficient, Ke |
|---|---|
Square End Projection | 0.2 |
Square End with Headwall | 0.5 |
Grooved End Projection | 0.2 |
Grooved End with Headwall | 0.2 |
1.1 : 1 Beveled Edge | 0.2 |
1.5 : 1 Beveled Edge | 0.2 |
Box Culvert | Coefficient, Ke |
|---|---|
Square Edge w/ 90-15 Degree Headwall | 0.5 |
1.5 : 1 Bevel w/ 90 Degree Headwall | 0.2 |
1 : 1 Bevel w/ Headwall | 0.2 |
Square Edge w/ 30-78 Degree Flared Wingwall | 0.4 |
Square Edge w/ 90-15 Degree Flared Wingwall | 0.5 |
Square Edge w/ 0 Degree Flared Wingwall | 0.7 |
1.5 : 1 Bevel w/ 18-34 Degree Flared Wingwall | 0.2 |
1.5 : 1 Bevel w/ 45 Degree Flared Wingwall | 0.2 |
4.1. Projecting Inlets
Projecting inlets vary greatly in hydraulic efficiency and adaptability to requirements with the type of pipe material used. Figure CB-7 illustrates this type of inlet.
4.2. Inlets with Headwalls
Headwalls may be used for a variety of reasons, including increasing the efficiency of the inlet, providing embankment stability, and providing embankment protection against erosion. The relative efficiency of the inlet varies with the pipe material used. The range of inlet coefficients for different headwall configurations is summarized in Table CB-4. Different configurations of pipe with headwalls are described in Sections 4.2.1 through 4.2.4 of this chapter. Figure CB-8 illustrates a headwall with wingwalls.
4.3. Special Inlets
In addition to the common inlets described above, a large variety of other special inlet types exist. Among these are special end-sections, which serve as both outlets and inlets and are available for both corrugated metal pipe and concrete pipe. Because of the difference in requirements due to pipe materials, the special end-sections are addressed according to pipe material. Mitered inlets are discussed in Section 4.3.3 of this chapter.
5.1. Debris Control
Accumulation of debris at a culvert inlet can result in the culvert not performing as designed. This can result in damage caused by overtopping of the roadway and/or inundation of the upstream property. Three main options exist to address the debris problem:
- Retain the debris upstream of the culvert.
- Attempt to pass the debris through the culvert.
- Install a bridge.
If the debris is to be retained by an upstream structure or at the culvert inlet, frequent maintenance may be required. The design of a debris control structure shall include a thorough study of the debris problem. Factors to be considered in a debris study include the following:
• Type of debris
• Quantity of debris
• Expected changes in type and quantity of debris due to future land use
• Stream flow velocity in the vicinity of culvert entrance
• Maintenance access requirements
• Availability of storage
• Maintenance plan for debris removal
• Assessment of damage due to debris clogging, if protection is not provided
FHWA’s Hydraulic Engineering Circular, No. 9 (HEC-9 2005 - http://www.fhwa.dot.gov/engineering/), Debris Control Structures, shall be referenced when designing debris control structures.
5.2. Buoyancy
When a culvert is functioning with inlet control, an air pocket forms, just inside the inlet, that creates a buoyant effect when the inlet is submerged. The buoyancy forces increase with an increase in headwater depth under inlet control conditions. These forces, along with vortexes and eddy currents, can cause scour, undermine culvert inlets, and erode embankment slopes, thereby making the inlet vulnerable to failure, especially with deep headwater.
The large unequal pressures resulting from inlet constriction, which are accentuated when the capacity of the culvert is impaired by debris or damage, are in effect buoyant forces that can cause entrance failures, particularly on corrugated metal pipe with mitered, skewed, or projecting ends. The failure potential will increase with steepness of the culvert slope, depth of the potential headwater, flatness of the fill slope over the upstream end of the culvert, and the depth of the fill over the pipe.
Anchorage at the culvert entrance helps to protect against these failures by increasing the dead load on the end of the culvert, protecting against bending damage, and by protecting the fill slope from the scouring action of the flow. When inlet control conditions are present a standard concrete headwall or endwall will be provided unless otherwise approved by the City to counteract the hydrostatic uplift and to prevent failure due to buoyancy.
Because of a combination of high head on the outside of the inlet and the large region of low pressure on the inside of the inlet due to separation, a large bending moment is exerted on the end of the culvert, which may result in failure. This problem has been noted in the case of culverts under high fills, on steep slopes, and with projecting inlets. In cases where upstream detention storage requires headwater depth in excess of 20 feet, reducing the culvert size is required to limit the discharge rate rather than using an inefficient projecting inlet.
6.1. Scour
Protection against scour at culvert outlets varies from limited riprap placement to complex and expensive energy dissipation devices. At some locations, use of a rougher culvert material may alleviate the need for a special outlet protection device. Pre-formed scour holes (approximating the configuration of naturally formed holes) dissipate energy while providing a protective lining to the streambed. Methods for predicting scour hole dimensions are provided in FHWA’s Hydraulic Engineering Circular, No. 14 (HEC-14 , 2006), Hydraulic Design of Energy Dissipators for Culverts and Channels.
6.2. Energy Dissipation/Erosion Control
Riprap-armored channel expansions and concrete aprons protect the channel and redistribute or spread the flow. Barrel outlet expansions operate in a similar manner. Headwalls and cutoff walls protect the integrity of the fill. When outlet velocities are high enough to create excessive downstream problems, consideration should be given to more complex energy dissipation devices. Design information for the general types of energy dissipators can be found in HEC-14 (FHWA 2006).
Four examples of energy dissipators and erosion control are given below: Drop Structures, Turf Reinforcement Mats, Hydraulic Jump Energy Dissipators and Riprap (requires City approval).
7.1 Culvert Location
Culvert location is an integral part of the total design. The main purpose of a culvert is to convey storm water drainage across the roadway section expeditiously and effectively. The designer should identify all live stream crossings, springs, low areas, gullies, and impoundment areas created by the new roadway embankment for possible culvert locations. Note that environmental permitting constraints will often apply for new culverts or retrofits, such as a Section 404 permit that regulates construction activities in jurisdictional wetlands and “Waters of the United States.”
Culverts shall be located on existing stream alignments and aligned to give the stream a direct entrance and a direct exit. Abrupt changes in direction at either end may retard the flow and make a larger structure necessary. If necessary, a direct inlet and outlet may be obtained by means of a channel change, skewing the culvert, or a combination of these. The choice of alignment should be based on environmental concerns, hydraulic performance, and/or maintenance considerations.
If possible, a culvert shall have the same alignment as its channel. Often this is not practical and where the water must be turned into the culvert, headwalls, wingwalls, and aprons with configurations similar to those in Figure CB-9 shall be used as protection against scour and to provide an efficient inlet.
7.2. Sedimentation
Deposits usually occur within the culvert barrels at flow rates smaller than the design flow. The deposits may be removed during larger floods depending upon the relative transport capacity of flow in the stream and in the culvert, compaction and composition of the deposits, flow duration, ponding depth above the culvert, and other factors.
Culvert location in both plan and profile is of particular importance to the maintenance of sediment-free culvert barrels. Deposits occur in culverts because the sediment transport capacity of flow within the culvert is often less than in the stream.
Deposits in culverts may also occur because of the following conditions:
- At moderate flow rates the culvert cross section is larger than that of the stream, so the flow depth and sediment transport capacity is reduced within the culvert compared to the stream.
- Point bars form on the inside of stream bends. Culvert inlets placed at bends in the stream will be subject to deposition in the same manner. This effect is most pronounced in multiple-barrel culverts with the barrel on the inside of the curve often becoming almost totally plugged with sediment deposits.
- Abrupt changes to a flatter grade in the culvert or in the channel adjacent to the culvert will induce sedimentation. Gravel and cobble deposits are common downstream from the break in grade because of the reduced transport capacity in the flatter section.
7.3. Open Channel Inlets
Entrances to open channels often require the same careful planning and design as is needed for culverts and long conduits if the necessary hydraulic balance is to be achieved. The energy grade line shall be analyzed by the designer to provide proper balanced energy conversion, velocity control, energy loss, and other factors that control the downstream flow. Channel confluences, in particular, require careful hydraulic design to eliminate scour, reduce oscillating waves, and minimize upstream backwater effects.
7.4. Transitions
Transitions from pipe flow to open channels, between different rigid channels, and from slow flow to supercritical flow must be designed using the concepts of conservation of energy and open channel hydraulics. Primarily, a transition is necessary to change the shape or cross section of flowing water.
Normally, the designer will have as an objective the avoidance of excessive energy losses, cross waves, and turbulence. It is also necessary to provide against scour and overtopping.
Supercritical flow transitions must receive more attention than is generally provided to subcritical flow transitions. Care must be taken to prevent unwanted hydraulic jumps or velocities that cause critical depth. Froude numbers between 0.8 and 1.2 must be avoided.
In general, the rate at which the flow prism may be changed shall not exceed perhaps 5 to 12½ degrees, depending upon velocity. Sharp angles shall be avoided. The water surface hydraulic grade line shall normally be smooth. More information on transitions is available in HEC-14 (FHWA 2006).
7.5. Culvert Replacements
When installing or replacing a culvert, careful consideration should be taken to ensure that upstream and downstream property owners are not adversely affected by the new hydraulic conditions. The potential upstream flooding impacts associated with the backwater from the calculated headwater depth must be considered and the determination of the available headwater should take into account the area inundated at the projected water surface elevation. If a culvert is replaced by one with more capacity, the downstream effects of the additional flow must be factored into the analysis. Assuring consistency with existing major drainageway master plans and/or outfall studies is important.
7.6. Fencing for Public Safety
Culverts are frequently located at the base of steep slopes. Large box culverts, in particular, can create conditions where there is a significant drop, which poses risk to the public. In such cases, handrail or fencing (or a guardrail configuration) is required for public safety. A handrail or fence shall be placed to provide a barrier between adjacent pedestrian areas and culvert openings when the culvert height/drop is ≥ 30-inches and ≤ 10-feet from the edge of the closest travel way.
Typical culvert inlets consist of concrete headwalls and wingwalls for larger structures and beveled-end sections for smaller pipes that may represent an obstacle to motorists who run off the road. This type of design may result in either a fixed object protruding above an otherwise traversable embankment or an opening into which a vehicle can drop causing an abrupt stop. The options available to a design engineer to minimize these obstacles are: use a traversable design, extend the structures so it is less likely to be hit, shield the structures (guardrail, concrete barrier wall, etc.), or delineate the structure if the other alternatives are not appropriate. Guidance for when to use which option is located in Section 3.4.2 Cross-Drainage Structures of the AASHTO Roadside Design Guide (2002).
7.7. Cover, Fill Heights and Bedding for Culverts
Refer to Chapter 5 for pipe and
The minimum cover for reinforced concrete pipe shall be one-foot and shall meet minimum ASTM Class III specifications. The minimum cover for metal pipe is two-feet. Minimum cover less than these values shall be fully justified in writing and approved by the City Engineer prior to proceeding with final plans. Maximum fill heights and bedding descriptions for pipes are shown on Tables CB-6 and CB-7.
Box culverts shall be structurally designed to accommodate earth and live load to be imposed upon the culvert. Refer to the Arkansas State Highway and Transportation Department’s Reinforced Concrete Box Culvert Standard Drawings. When installed within public right of way, all culverts shall be capable of withstanding minimum HL-93 loading.
When culverts under railroad facilities are necessary, the designer shall obtain approval from the affected railroad.
8.1. Coordination with Other Agencies
Numerous local, State and Federal agencies have vested interests in surface waters. These agencies represent interests in water rights, flood control, drainage, conservation, navigation and maintenance of navigation channels, recreation, floodplain management and safety of floodplain occupancy, fish and wildlife, preservation of wetlands, and regulation of construction for the protection of environmental values. Other local, State and Federal agencies have vested interest in historic bridge structures and archeological resources. Early coordination with other agencies will reveal areas of mutual interest and offer opportunities to conserve public funds by resolving conflicts between roadway plans and water resources plans.
8.2. Basic Criteria
Bridge openings shall be designed to have as little effect on the flow characteristics as reasonable, consistent with good bridge design and economics. However, with respect to supercritical flow with a lined channel, the bridge shall not affect the flow at all—that is, there shall be no projections into the design water prism that could create a hydraulic jump or flow instability in the form of reflecting and standing waves.
8.3. Hydraulic Analysis
The hydraulic analysis procedures described below are suitable, although the use of HEC-RAS is preferred.
The design of a bridge opening generally determines the overall length of the bridge. The length affects the final cost of the bridge. The hydraulic engineering in the design of bridges has more impact on the bridge cost than does the structural design.
The reader is referred to Hydraulics of Bridge Waterways (U.S. Bureau of Public Roads 1978) for more guidance on the preliminary hydraulic assessment approach described below. In working with bridge openings, the designer may use the designation shown in Figure CB-17.
8.4. Design Procedure
The following is a brief step-by-step outline for determination of backwater produced by a bridge constriction:
- Determine the magnitude and frequency of the discharge for which the bridge is to be designed.
- Determine the stage of the stream at the bridge site for the design discharge.
- Plot a representative cross section of the stream for design discharge at Section 1, if not already done under Step 2. If the stream channel is essentially straight and the cross section substantially uniform in the vicinity of the bridge, the natural cross section of the stream at the bridge site may be used for this purpose.
- Subdivide the above cross section according to marked changes in depth of flow and roughness. Assign values of Manning's roughness coefficient, n, to each subsection. Careful judgment is necessary in selecting these values. Refer to Table OC-7 in Chapter 6 – Open Channel Flow Design.
- Compute conveyance and then discharge in each subsection.
- Determine the value of the kinetic energy coefficient.
- Plot the natural cross section under the proposed bridge based on normal water surface for design discharge and compute the gross water area (including area occupied by piers).
- Compute the bridge opening ratio, M, observing modified procedure for skewed crossings.
- Obtain the value of Kb from the appropriate base curve.
- If piers are involved, compute the value of J and obtain the incremental coefficient, ΔKp.
- If eccentricity is severe, compute the value of eccentricity and obtain the incremental coefficient, ΔKe (FHWA, HDS-1 1978).
- If a skewed crossing is involved, observe proper procedure in previous steps, and then obtain the incremental coefficient, ΔKs, for proper abutment type.
- Determine the total backwater coefficient, K*, by adding incremental coefficients to the base curve coefficient, Kb.
- Compute the backwater by Equation CB-14.
- Determine the distance upstream to where the backwater effect is negligible.
Detailed steps illustrated by examples are presented in Hydraulics of Bridge Waterways (FHWA, HDS-1 1978).
8.5. Inadequate Openings
The engineer will often encounter existing bridges and culverts that have been designed for storms having return periods less than 100 years. In addition, bridges will be encountered which have been improperly designed. Often the use of the orifice formula will provide a quick determination of the adequacy or inadequacy of a bridge opening:
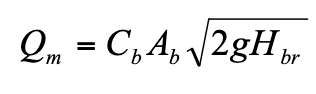 (Equation CB-17)
or
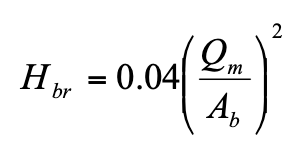 (Equation CB-18)
in which:
Qm = The major storm discharge (ft3/s)
Cb = The bridge opening coefficient (0.6 assumed in Equation CB-17)
Ab = The area of the bridge opening (ft2)
g = Acceleration of gravity (32.2 ft/s2)
Hbr = The head, that is the vertical distance from the bridge opening center point to the upstream water surface about 10H upstream from the bridge, where H is the height of the bridge, in feet. It is approximately the difference between the upstream and downstream water surfaces where the lower end of the bridge is submerged.
These expressions are valid when the water surface is above the top of the bridge opening.
9.1. Culvert Under an Embankment
Given: Q5-yr = 20 cfs, Q100-yr = 35 cfs, L = 95 feet
The maximum allowable headwater elevation is 5288.5. The natural channel invert elevations are 5283.5 at the inlet and 5281.5 at the outlet. The tailwater depth is computed as 2.5 feet for the 5-year storm, and 3.0 feet for the 100-year storm.
Solution:
1.1 Executive Summary
The purpose of this chapter of the Manual is to provide technical guidance for erosion, sediment, and runoff control for construction activity along with the implementation of Best Management Practices (BMPs) for the period of time from initial earth disturbance until the final landscaping and permanent stormwater measures are accepted by the City of Rogers and coverage under the Arkansas Department of Energy & Environment Division of Environmental Quality (DEQ) Construction General Permit has been terminated.
The City of Rogers requires that a Stormwater Pollution Prevention Plan (SWPPP) be developed for construction sites in accordance with the DEQ Construction General Permit prior to obtaining a Land Disturbance Permit. The City of Rogers has the right under the Federal Clean Water Act and the Arkansas Water and Air Pollution Control Act to require that BMPs for erosion, sediment, and runoff control be implemented at construction sites. The owner of a site of construction activity shall be responsible for compliance with the requirements of this article.
Two copies of the SWPPP shall be submitted for review and approval to the City of Rogers for sites with disturbed areas of five (5) acres or more.
For sites with disturbed areas greater than or equal to one (1) acre and less than five (5) acres, the City of Rogers will review the proposed BMPs based on the submitted erosion control plans. The SWPPP must be submitted to the City of Rogers.
1.2 Introduction
Surface runoff controls for construction sites and activities in Arkansas are mandated by the Clean Water Act of the Federal Government and the Arkansas Water and Air Pollution Control Act. All sites where construction will disturb soil or remove vegetation on one (1.0) or more acres of land in total for all phases of work during the life of the construction project must be covered under the DEQ Construction General Permit. This Construction General Permit provides authorization to discharge stormwater associated with construction activity under the National Pollutant Discharge Elimination System (NPDES) to all Arkansas receiving waters in accordance with effluent limitations, monitoring requirements, and other conditions set forth in the Construction General Permit. Coverage under the Construction General Permit does not relieve the site owner or operator from addressing and obtaining, as needed, other local, State and Federal permits (e.g., permit for work in a floodplain, Corps of Engineers 404 permit, building permit, local Land Disturbance Permit, etc.).
A Stormwater Pollution Prevention Plan (SWPPP) must be developed for construction sites in accordance with the Construction General Permit. The SWPPP shall be prepared in accordance with good engineering practices and shall identify potential sources of pollution which may reasonably be expected to affect the quality of stormwater discharges from the construction site. In addition, the SWPPP shall describe and ensure the implementation of Best Management Practices (BMPs) which are to be used to reduce pollutants in stormwater discharges and to assure compliance with the terms and conditions of the Construction General Permit. The initially developed SWPPP has to be viewed as a starting point that will be modified as the work progresses and its effectiveness is tested in the field.
The DEQ identifies two construction project sizes for the City of Rogers including: large construction sites (disturbance of five (5) or more acres of total land area) and small construction sites (greater than or equal to one (1) acre and less than five (5) acres of total land area). The owner or operator of large construction sites must submit a Notice of Intent (NOI) and permit fee to DEQ to be covered under the Construction General Permit. In addition, for large construction sites a copy of the SWPPP must be submitted to DEQ. For small construction sites, an NOI and a DEQ permit fee is not required; however, a Land Disturbance Permit fee is required through the City. Rather than an NOI, the owner or operator must complete and sign a Construction Site Notice and post it at the construction site. For small construction sites, a SWPPP must be developed but does not need to be submitted to DEQ unless requested.
DEQ requires qualified personnel (provided by the site owner or operator) to conduct inspections of all areas disturbed by construction activity and all storage areas that are exposed to precipitation. The inspectors must look for evidence of, or the potential for, pollutants to enter the stormwater system. Locations where vehicles enter or exit the site, discharge locations, and locations where erosion and sediment control measures are installed shall also be inspected. In addition, the City of Rogers, DEQ or EPA may conduct inspections at any time.
Issuance of a Notice of Violation (NOV) by the City, State or EPA sets the stage for enforcement action and fines. This is a regulatory program with many potential consequences and has to be taken seriously by site owners or operators. Conducting construction activities without coverage under the Construction General Permit when one is needed has the potential of criminal action enforcement being taken against the violating party, which not only can carry much higher fines, but has a potential for jail sentences.
1.3 Performance Objectives
The following are objectives for erosion and sediment control during construction:
- Conduct all land disturbing activities in a manner that effectively reduces accelerated soil erosion and reduces sediment movement and deposition off site.
- Schedule construction activities to minimize the total amount of soil exposed at any given time to reduce the period of accelerated soil erosion.
- Establish temporary or permanent cover on areas that have been disturbed as soon as possible after grading is completed.
- Design and construct all temporary or permanent facilities to limit the flow of water to non-erosive velocities around, through or from disturbed areas.
- Remove sediment from surface runoff water before it leaves the site.
- Stabilize the areas of land disturbance with permanent vegetative cover and stormwater quality control measures.
1.4 Stormwater Pollution Prevention Plan
The owner is responsible for providing the Stormwater Pollution Prevention Plan (SWPPP). It is recommended that the owner secure the services of a qualified professional knowledgeable in construction management practices to develop the SWPPP. The SWPPP must meet the requirements listed in the DEQ Construction General Permit No. ARR150000, "Authorization to Discharge under the National Pollutant Discharge Elimination System and the Arkansas Water and Air Pollution Control Act" available at www.adeq.state.ar.us.
Two copies of the SWPPP shall be submitted for review and approval to the City of Rogers for sites with disturbed areas of five (5) acres or more. The final SWPPP must be consistent with the Drainage Report accepted by the City of Rogers. However, approval of the SWPPP does not imply acceptance or approval of Drainage Plans, Street Plans, Design of Retaining Walls, or any other aspect of the site development.
The City of Rogers will review the SWPPP submitted for the site and will return either an approval of the SWPPP or a request for revisions. Construction activity, including any soil disturbance or removal of vegetation, shall not commence on the site until the City of Rogers and DEQ has issued an approval of the SWPPP.
For sites with disturbed areas greater than or equal to one (1) acre and less than five (5) acres, the City of Rogers will review the proposed BMPs based on the submitted erosion control plans. The SWPPP doesn’t need to be submitted to the City of Rogers unless requested.
Preparation and implementation of SWPPPs for construction activity shall comply with the following:
- Preparation:
- The SWPPP shall be prepared under the direction of a qualified person.
- The SWPPP shall provide the name, address and phone number of the project owner for purposes of correspondence and enforcement.
- The SWPPP shall identify existing natural resources such as streams, forest cover, and other established vegetative cover.
- The SWPPP shall specify and provide detail for all BMPs necessary to meet the requirements of this Manual, including any applicable BMPs that have been adopted and imposed by the City.
- The SWPPP shall specify when each BMP will be installed, and for how long it will be maintained within the construction sequence. Multiple plans may be required for major phases of construction such as rough grading, building construction and final grading.
- The SWPPP shall delineate all anticipated disturbed areas and specify the vegetative cover that must be established in those areas to achieve final stabilization.
- Implementation:
- BMPs shall be installed and maintained by qualified persons. The owner/developer or their representative shall be able to provide upon the stormwater coordinator's request a copy of the SWPPP on site and shall be prepared to respond to unforeseen maintenance of specific BMPs.
- The owner/developer or their representative shall inspect all BMPs at least once per month and within 24 hours after a rainfall of one quarter of an inch or more as measured at the site or generally reported in the City area.
- Based on inspections performed by the owner/developer or by authorized City personnel, modifications to the SWPPP will be necessary if at any time the specified BMPs do not meet the objectives of this Manual. In this case, the owner/developer or authorized representative shall meet with authorized City personnel to determine the appropriate modifications. All modifications shall be completed within seven days of the referenced inspection, except in circumstances necessitating more timely attention, and shall be recorded on the owner's copy of the SWPPP.
1.5 Land Disturbance Permit
Any person proposing to engage in clearing, filling, cutting, quarrying, construction, or similar activities on any piece of disturbed land of one-half (1/2) acre or larger shall apply for a Land Disturbance Permit with the City of Rogers.
For sites with disturbed areas of five (5) acres or more, the SWPPP must be approved by the City of Rogers prior to issuance of a Land Disturbance Permit.
For sites with disturbed areas greater than or equal to one-half (1/2) acre and less than five (5) acres, the erosion control plans must be approved by the City of Rogers prior to issuance of a Land Disturbance Permit.
1.6 Construction Phase
During the construction phase, the following sequence is recommended for the implementation of the project and the SWPPP:
- The owner and/or the contractor shall designate a manager for the implementation of the SWPPP. This person shall be responsible for implementing all permit conditions and shall communicate with inspectors from the City of Rogers and other agencies.
- Install all BMPs shown on the SWPPP that need to be installed in advance of proceeding with construction, such as construction entrances and exits, perimeter silt fences, etc.
- Identify construction equipment and materials storage and maintenance areas. Install BMPs to prevent pollutant migration from these areas.
- Install any additional BMPs that are called for in the SWPPP before overlot grading begins.
- Strip off and stockpile topsoil for reuse.
- Open areas not planned for immediate use shall be seeded or sodded. Soil which is exposed for more than fourteen (14) days with no construction activity shall be seeded, mulched, or re-vegetated.
- Exposed soil within stormwater facilities, including but not limited to detention/retention ponds, swales and sedimentation basins, must be stabilized and sodded immediately, but no later than fourteen (14) days, following construction of the facility.
- Insure that BMPs are installed and fully operational in advance of each construction phase as called for in the SWPPP.
- After construction and revegetation is complete, permanent post-construction BMPs that were used as construction sediment controls shall be cleaned and restored.
1.7 Revegetation Phase
Once revegetation has been deemed acceptable by the City of Rogers, the owner shall request release of any surety, letters of credit or other financial guarantees that the City of Rogers may have required the permit holder to provide at the time the permit was issued. A closure of the Construction General Permit from DEQ shall also be pursued at this time.
The City of Rogers shall require a bond at the time of approval by the Planning Commission for revegetation of the site if construction halts. The value of the bond shall be set based on an estimate provided by the engineer of record.
Upon completion of permitted construction activity on any site, the property owner and subsequent property owners will be responsible for continued compliance with the requirements of this article, in the course of maintenance, reconstruction or any other construction activity on the site.
2.2 Principles of Erosion and Sediment Control
Erosion controls limit the amount and rate of erosion occurring on disturbed areas. Sediment controls attempt to capture the soil that has been eroded before it leaves the construction site. Despite the use of both erosion control and sediment control measures (referred to as Best Management Practices (BMPs)), it is recognized that some amount of sediment will remain in runoff leaving a construction site.
The purpose of BMPs is to potentially minimize the sediment to the extent feasible. Construction activities management shall address six major elements:
- The erosion control measures that will be used to limit erosion of soil from disturbed areas at a construction site;
- The sediment and runoff control measures to limit transport of sediment off-site to downstream properties and receiving waters;
- The waterway protection measures to protect waterways located on or downstream of the construction site from erosion and sediment damages;
- The construction practices management to limit pollutant movement off site resulting from construction equipment maintenance and storage and from materials storage and handling.
- The stabilization practices to return the site to either a vegetative state or employ non-erosive surfaces where disturbances have occurred. Stabilization may include both temporary and permanent stabilization methods.
- The onsite infiltration measures used to infiltrate stormwater runoff onsite where appropriate.
2.3 Stormwater Planning Process
Stormwater planning should occur early in the site development process. The planning process can be divided into five separate steps:
- Gather information on topography, soils, drainage, vegetation and other predominant site features.
- Analyze the information in order to anticipate erosion, sedimentation, and runoff problems.
- Devise a plan which schedules construction activities and minimizes the amount of erosion created by development.
- Develop a SWPPP which specifies effective erosion, sediment and runoff control measures as well as waste management and construction phasing.
- Follow the SWPPP and revise it when necessary.
- Remove temporary BMPs once the site has reached final stabilization and file a Notice of Termination (NOT) with DEQ.
Table CS-1 – List of BMPs for Construction Management Practices
BMP # | BMP Name |
|---|---|
CM-1 | Construction sequencing/phasing |
CM-2 | Hazardous waste management and chemical storage |
CM-3 | Solid waste management |
CM-4 | Concrete washouts |
CM-5 | Construction staging and maintenance areas |
CM-6 | Construction dewatering |
Erosion control practices include the BMPs listed in Table CS-2.
Table CS-2 – List of BMPs for Erosion Control Practices
BMP # | BMP Name |
|---|---|
EC-1 | Chemical Stabilization |
EC-2 | Compost Blankets |
EC-3 | Geotextiles, Erosion Control Blankets and Mats |
EC-4 | Terraces |
EC-5 | Mulching |
EC-6 | Temporary Outlet Protection, Energy Dissipation Devices, Riprap Apron |
EC-7 | Temporary and Permanent Revegetation |
EC-8 | Wind erosion or dust control |
EC-9 | Hydroseeding and Hydromulching |
EC-10 | Surface Roughening |
EC-11 | Temporary Slope Drain |
EC-12 | Temporary Stream Crossings |
EC-13 | Level Spreader |
Sediment Control and Runoff Control practices include the BMPs listed in Table CS-3.
Table CS-3 – List of BMPs for Sediment Control and Runoff Control Practices
BMP # | BMP Name |
|---|---|
SC-1 | Stabilized construction entrance/exit |
SC-2 | Embedded Silt fence |
SC-3 | Inlet protection |
SC-4 | Chemical treatment |
SC-5 | Sediment trap |
SC-6 | Sediment basin |
SC-7 | Compost filter socks |
SC-8 | Fiber rolls/wattles |
SC-9 | Gravel bags |
SC-10 | Vegetative buffers |
SC-11 | Sediment filters and sediment chambers |
RC-1 | Check dams |
RC-2 | Triangular Silt Dike |
RC-3 | Grass-lined channels |
RC-4 | Interceptor and diversion dikes and swales |
RC-5 | Rough-cut street control |
RC-6 | Water bars |
Many of the temporary controls used for sediment control can be modified into permanent structural controls. In addition, permanent stormwater quality controls can often be constructed at the initial stages of the project and modified to control sediment during construction phases. When that occurs, they will need to be modified and restored to the post-construction BMP configuration at the end of construction. Restoration of the post-construction BMPs may involve removing sediment that may have accumulated during construction.
4.1 Working Within or Crossing a Waterway
When working immediately adjacent to a waterway, the use of erosion and sediment control practices described earlier in this Manual is crucial. Activities such as minimizing disturbed areas adjacent to the waterways, timing construction during low flows, using surface roughening techniques, mulching disturbed areas as quickly as possible, using silt fence, and using temporary slope diversions to direct runoff to sediment basins before runoff enters the waterway. The inspection and maintenance of the erosion and sedimentation controls needs to be more aggressive.
When working within a waterway, steps must be taken to stabilize the work area during construction to control erosion. The channel banks and channel bed must be restabilized by the use of seeding, mulching, and/or erosion control matting, as quickly as possible. If it is not practical to do final seeding due to site conditions (e.g., frozen ground, prolonged wet weather, etc.), mulch shall be applied to the surface, and then seed and final mulch when conditions permit.
A permit is required for placement of fill in a waterway under Section 404 of the Clean Water Act. The U.S. Army Corps of Engineers has issued nationwide permit Number 14 for Linear Transportation Projects (roads, highways, railways, trails, airport runways, etc.) along with the placement of temporary fill associated with the construction. Appropriate measures must be taken to maintain normal downstream flows and floodplain capacity. The U.S. Army Corps of Engineers has issued nationwide permit Number 12 for Utility Line Activities for construction of utility lines within Waters of the United States provided there is no change in pre-construction contours. The local office of the Corps of Engineers should be contacted concerning the requirements for obtaining a 404 permit.
In addition, a permit from the U.S. Fish and Wildlife Service may be needed if endangered species are of concern in the work area. For a list of endangered or threatened species, contact the Arkansas Natural Heritage Commission at (501) 324-9619 or www.naturalheritage.com or the U.S. Fish and Wildlife Services (USFWS) at (501) 324-5643 or www.fws.gov. Typically the USFWS issues are addressed by a 404 permit if one is required. The City of Rogers should also be consulted and can provide assistance.
Applicants of a Corps of Engineers 404 permit shall also contact DEQ for a Short Term Activity Authorization (STAA) needs determination for activities that have the potential to violate water quality criteria.
Besides permitting with the U.S. Army Corps of Engineers and USFWS, it may be necessary to submit the proper map revision application [(C)LOMA, (C)LOMR-F, (C)LOMR)] to FEMA depending on the type and level of work taking place within a waterway. Should any of the work occurring in and around a waterway create a situation that permanently alters the future hydraulic characteristics of the waterway (e.g. by placement of fill in a waterway or realignment of the waterway) it will be necessary to coordinate such work with FEMA and the City’s Floodplain Administrator to ensure all necessary maps and hydraulic information are revised/updated for the impacted area of the waterway.
Where an actively-flowing watercourse must be crossed regularly by construction vehicles, a temporary stream crossing shall be provided. Three primary methods are available: (1) a culvert crossing, (2) a stream ford, and (3) a bridge crossing. Refer to Figures CS-4 through CS-5 for examples of temporary stream crossings. Also refer to the Temporary Stream Crossing BMP fact sheet EC-12.
Construction vehicles shall be kept out of a waterway to the maximum extent practicable.
When working within a waterway, temporary facilities shall be installed to divert clean flowing water around the construction activities taking place within a waterway.
Whenever possible, construction in a waterway shall be sequenced to begin at the most downstream point and work progressively upstream installing required channel and grade control facilities.
Complete work in small segments, exposing as little of the channel at a time as possible.
Where feasible, it is best to perform all in-channel work during historically low stream flow periods. This is the period when the chances of flash floods and flows higher than the 2-year flood peak flows are least likely.
Some construction activities within a waterway are short lived, namely a few hours or days in duration, and are minor in nature. These are typically associated with maintenance of utilities and stream crossings and minor repairs to outfalls and eroded banks. In these cases, construction of temporary diversion facilities can often cause more soil disturbance and sediment movement than the maintenance activity itself. However, this determination will have to be made in conjunction with the Corps of Engineers, DEQ, the City and any other appropriate jurisdictions.
4.2 Temporary Channel Diversions
Limiting construction activities within a waterway will significantly reduce erosion and sediment movement downstream. Construction berms can be used on portions of large channels to carry water around construction activities. The berms shall be tall enough to contain at least the 2-year flood peak without being overtopped.
Temporary diversion channels that divert the entire waterway are appropriate for work in smaller waterways and for the construction of detention basins and dams located on waterways. Refer to Figure CS-6 for an example of a temporary channel diversion.
Whenever the temporary diversion is around the construction site of a detention basin or a dam, the detention basin behind the dam should be considered for use as a temporary sediment basin. During construction such basins will need to be maintained as any other sediment basin. Once the construction site is stabilized, and before the temporary diversion is removed, all the accumulated sediment will need to be removed. The basin and its outlet facility will need to be configured to meet the requirements of the final design plans and specifications.
8.1 BMP CM-1 Construction Sequencing/Phasing
Description
Premature and/or excessive grading can increase the erosion potential and is therefore prohibited.
Construction Sequencing coordinates land disturbing activities with construction requirements to minimize the amount of soil exposed to erosion at any time.
Applicability
Projects on larger sites and on projects that land disturbing activities can be phased are best suited for Construction Sequencing.
Design Criteria
The potential for erosion is reduced when construction is performed in stages and the entire construction site is not disturbed all at the same time.
Areas of the site to be preserved should be clearly marked on the plans and delineated on the site. The timing of clearing and access to different areas of the site should be indicated in the contract documents.
Only land needed for building activities and vehicular traffic should be cleared.
Another way to phase construction is to minimize the disturbed areas during times of the year that traditionally receive large precipitation events.
Limitations
Sometimes, smaller projects do not lend themselves to sequencing of land disturbing activities.
Maintenance Requirements
Maintenance of protective BMP as needed.
8.2 BMP CM-2 Hazardous Waste Management and Chemical Storage
Description
Often materials are used at a construction site that present a potential for contamination of stormwater runoff. Hazardous Waste Management is the proper staging, storage, handling, and disposal of construction material listed as hazardous by EPA and/or DEQ to prevent pollutants from being released from the site to receiving waters.
Applications
All construction materials that are listed as hazardous by EPA and/or DEQ.
Criteria
Guidelines published by EPA and OSHA for the types of materials to be used on the construction site should be incorporated into the SWPPP.
The types of materials that are generally considered hazardous are:
- Fuels (diesel, gas, etc.)
- Oils and greases (lubricating, cutting, etc.)
- Petroleum based materials (asphalt, emulsions, solvents)
- Paints (including wood preservatives, stains, and lead based)
- Solvents (paint thinners, cleaners, etc.)
- Pesticides, herbicides, insecticides
Proper management of hazardous materials entails:
- Replace hazardous materials with non-hazardous materials
- Minimize the use of hazardous materials
- Reuse and recycle hazardous materials
- Proper use of hazardous materials
- Proper storage and handling of hazardous materials
- Proper disposal of hazardous materials
Employees must be trained in the use, storage, and disposal of hazardous wastes. Hazardous materials should be stored so only authorized personnel can use the material.
Areas at the construction site that are used for storage of toxic materials and petroleum products should be designed with an enclosure, under a roof if possible, with a container, or with a dike located around the perimeter of the storage area to prevent discharge of these materials in runoff from the construction site. These barriers will also function to contain spilled materials.
Measures to prevent spills or leaks of fuel, gear oil, lubricants, antifreeze, and other fluids from construction vehicles and heavy equipment should be considered to protect groundwater and runoff quality. All equipment maintenance should be performed in a designated area and measures, such as drip pans, used to contain petroleum products. Spills of construction-related materials, such as paints, solvents, or other fluids and chemicals, shall be cleaned up immediately and disposed of properly.
The following methods shall be followed for spill prevention and clean-up:
- The manufacturers recommended methods for spill clean-up shall be clearly posted and personnel shall be trained in the location of clean-up supplies and clean-up procedures.
- Clean-up supplies shall be kept in a secure area.
- Personnel shall wear proper protective clothing when cleaning up the spill.
- Spills shall be cleaned up immediately and the waste properly disposed of.
- Licensed hazardous waste haulers must be used to transport hazardous wastes to approved treatment and disposal sites.
- Additional measures for spill prevention, response, and material storage practices may be required.
8.3 BMP CM-3 Solid Waste Management
Description
Solid wastes that are improperly disposed of can be blown or washed from construction sites causing others to pick up the wastes from their property. Solid Waste Management refers to the proper handling and disposal of all construction wastes.
Applications
All construction sites.
Criteria
Areas shall be designated for the storage and disposal of construction material waste (both solid and liquid) to prevent discharge or movement of these materials off of the construction site.
These sites shall be located away from all storm drainage facilities and waterways. Consider covering the waste storage areas and fencing them, if necessary, to contain windblown materials. Consider constructing a perimeter dike to exclude or to contain runoff. These measures may not be necessary if all waste is placed immediately in covered waste containers at the site and is otherwise controlled in an effective manner. Trash receptacles shall be placed in convenient locations throughout the job site.
All waste shall be disposed only at approved landfill sites.
Maintenance Requirements
Trash and waste construction materials shall be picked up and disposed of daily.
8.4 BMP CM-4 Concrete Washouts
Description
Concrete waste from washout of ready mix trucks, concrete pumps, and other concrete equipment increases sediment and changes the pH of stormwater runoff.
Concrete Waste Management is the practice of providing a basin for disposing of concrete residue and to wash out concrete truck mixers.
Applications
All construction sites with concrete work.
Design Criteria
The concrete washout area shall have sufficient storage volume to accept the wash water and allow the suspended particles to settle out.
The concrete washout area shall provide a minimum of six (6) cubic feet of containment volume for every ten (10) cubic yards of concrete to be poured.
Limitations
Improperly sized washout area can overflow and washout will not be contained.
Maintenance Requirements
The washout pit shall be cleaned weekly, when two-thirds (2/3) full, or as necessary to maintain capacity for wasted concrete. The waste material shall be disposed of properly.
8.5 BMP CM-5 Construction Staging and Maintenance Areas
Description
Ideally, vehicle maintenance occurs in garages and wash facilities, not on active construction sites. However, if these activities must occur onsite, operators shall follow appropriate BMPs to prevent untreated nutrient-enriched wastewater or hazardous wastes from being discharged to surface or ground waters.
Applications
Vehicle maintenance and BMPs prevent construction site spills of wash water, fuel, or coolant from contaminating surface or ground water. They apply to all construction sites.
A covered, paved or gravel-lined area shall be dedicated to vehicle maintenance. A spill prevention and cleanup plan should be developed. Prevent hazardous chemical leaks by properly maintaining vehicles and equipment. Properly cover and provide secondary containment for fuel drums and toxic materials. Properly handle and dispose of vehicle wastes.
Implementation
Construction vehicles shall be inspected daily, and any leaks repaired immediately. All used oil, antifreeze, solvents and other automotive-related chemicals shall be disposed of according to manufacturer instructions. These wastes require special handling and disposal. Used oil, antifreeze, and some solvents can be recycled at designated facilities, but other chemicals must be disposed of at a hazardous waste disposal site. Local government agencies can help identify such facilities.
Limitations
There are construction costs for the enclosed maintenance area, along with labor costs for hazardous waste storage, handling, and disposal.
Maintenance
Vehicle maintenance operations produce substantial amounts of hazardous and other wastes that require regular disposal. Clean up spills and dispose of cleanup materials immediately. Inspect equipment and storage containers regularly to identify leaks or signs of deterioration.
(Source: EPA)
8.6 BMP CM-6 Construction Dewatering
Description
Construction dewatering practices involve the removal of sediment from trench or groundwater prior to it being discharged from the construction site. It is also appropriate for the removal of stormwater from depressed areas at a construction site.
Implementation
If trench or ground waters contain sediment, it must pass through a sediment settling pond or other equally effective sediment control device, prior to being discharged from the construction site. Sediment may be removed by settling in place or by dewatering into a sump pit, filter bag, or comparable practice.
Groundwater dewatering which does not contain sediment or other pollutants is not required to be treated prior to discharge. However, care must be taken when discharging groundwater to ensure that it does not become pollutant-laden by traversing over disturbed soils or other pollutant sources.
Dewatering discharges must not cause erosion at the discharge point.
Limitations
Dewatering operations will require, and must comply with, applicable local permits. Dewatering that discharges water in a manner that may enter any waters of the State require a Construction General Permit from the Arkansas Department of Energy & Environment Division of Environmental Quality (DEQ). This permit will need to be obtained by the owner and all conditions stipulated in that permit strictly adhered to. It is the responsibility of the owner and their SWPPP manager to insure that this occurs.
8.7 BMP EC-1 Chemical Stabilization
Description
Erosion is caused by rainfall impact detaching soil particles and runoff carrying the particles downslope. Chemical stabilization is the practice of spraying chemicals (tackifiers, soil binders) on the soil to hold the soil particles in place and protect against erosion.
Applicability
Areas that have been cleared of vegetation or do not have a protective cover on the soil. If temporary seeding cannot be used or would not be effective due to the time of year, steepness of slope, or other reasons; chemical stabilizers can be applied to protect against erosion. Chemical stabilization can be used in conjunction with seeding and mulching.
Design Criteria
The type of chemical used (asphalt emulsion, polyacrylamides (PAM), vinyl, or rubber), the application rate, and application method should meet the manufacturer’s recommendations.
Limitations
Improper application methods or rates can result in over application which can diminish infiltration and cause additional runoff.
Maintenance Requirements
Chemically stabilized areas shall be inspected regularly and after one-half (1/2) inch or greater rainfalls and stabilizer reapplied as required.
8.8 BMP EC-2 Compost Blankets
Description
A compost blanket is a layer of loosely applied compost or composted material that is placed on the soil in disturbed areas to control erosion and retain sediment resulting from sheet-flow runoff. It can be used in place of traditional sediment and erosion control tools such as mulch, netting, or chemical stabilization. When properly applied, the erosion control compost forms a blanket that completely covers the ground surface. This blanket prevents stormwater erosion by (1) presenting a more permeable surface to the oncoming sheet flow, thus facilitating infiltration; (2) filling in small rills and voids to limit channelized flow; and (3) promoting establishment of vegetation on the surface.
Compost blankets can be placed on any soil surface: rocky, frozen, flat, or steep. The method of application and the depth of the compost applied will vary depending upon slope and site conditions. The compost blanket can be vegetated by incorporating seeds into the compost before it is placed on the disturbed area (recommended method) or the seed can be broadcast onto the surface after installation.
Applications
Compost blankets are most effective when applied on slopes between 4:1 (horizontal:vertical) and 2:1 (horizontal:vertical), such as stream banks, road embankments, and construction sites, where stormwater runoff occurs as sheet flow.
Compost blankets can be used on steeper slopes, such as 1:1 (horizontal:vertical), if netting or confinement systems are used in conjunction with the compost blanket to further stabilize the compost and the slope or if the compost particle size and compost depth are specially designed for the application.
Limitations
Compost blankets are not applicable for locations with concentrated flow.
Compost blankets are not generally used on slopes greater than 2:1
(Source: US Environmental Protection Agency)
8.9 BMP EC-3 Geotextiles, Erosion Control Blankets and Mats
Description
Geotextiles are porous fabrics also known as filter fabrics, road rugs, synthetic fabrics, construction fabrics, or simply fabrics. Geotextiles are manufactured by weaving or bonding fibers that are often made of synthetic materials such as polypropylene, polyester, polyethylene, nylon, polyvinyl chloride, glass, and various mixtures of these materials. As a synthetic construction material, geotextiles are used for a variety of purposes such as separators, reinforcement, filtration and drainage, and erosion control (USEPA, 1992).
Some geotextiles are made of biodegradable materials such as mulch matting and netting. Mulch mattings are jute or other wood fibers that have been formed into sheets and are more stable than normal mulch. Netting is typically made from jute, wood fiber, plastic, paper, or cotton and can be used to hold the mulching and matting to the ground. Netting can also be used alone to stabilize soils while the plants are growing; however, it does not retain moisture or temperature well. Mulch binders (either asphalt or synthetic) are sometimes used instead of netting to hold loose mulches together. Geotextiles can aid in plant growth by holding seeds, fertilizers, and topsoil in place. Fabrics come in a wide variety to match the specific needs of the site and are relatively inexpensive for certain applications.
Applications
Geotextiles can be used in various ways for erosion control on construction sites. Use them as matting to stabilize the flow of channels or swales or to protect seedlings on recently planted slopes until they become established. Use matting on tidal or stream banks, where moving water is likely to wash out new plantings. Geotextiles can be used to protect exposed soils immediately and temporarily, such as when active piles of soil are left overnight. They can also be used as a separator between riprap and soil, which prevents the soil from being eroded from beneath the riprap and maintains the riprap's base. Geotextiles can also be used on stockpiles.
Design Considerations
There are many types of geotextiles available; therefore, the selected fabric shall match its purpose. To ensure the effective use of geotextiles, keep firm, continuous contact between the materials and the soil. If there is no contact, the material will not hold the soil, and erosion will occur underneath the material.
Limitations
Geotextiles (primarily synthetic types) have the potential disadvantage of disintegrating when exposed to light. Consider this before installing them. Some geotextiles might increase runoff or blow away if not firmly anchored. Depending on the type of material used, geotextiles might need to be disposed of in a landfill, making them less desirable than vegetative stabilization. If the geotextile fabric is not properly selected, designed, or installed, its effectiveness may be reduced drastically.
Maintenance
Inspect geotextiles regularly to determine if cracks, tears, or breaches have formed in the fabric; if so, repair or replace the fabric immediately. It is necessary to maintain contact between the ground and the geotextile at all times. Remove trapped sediment after each storm event.
(Source: EPA)
8.10 BMP EC-4 Terraces
Description
Terraces are earthen embankments or ridge and channel systems that reduce erosion by slowing, collecting and redistributing surface runoff to stable outlets that increase the distance of overland runoff flow. Terraces hold moisture and help trap sediments, minimizing sediment-laden runoff.
Sediment can be controlled on slopes that are particularly steep by the use of terracing. During grading, relatively flat sections or terraces, are created and separated at intervals by steep slope segments. The steep slope segments are prone to erosion, however, and must be stabilized by mulching or other techniques. Retaining walls, gabions, cribbing, deadman anchors, rock-filled slope mattresses and other types of soil retention systems are available for use. These should be specified in the plan and installed according to manufacturer's instructions.
Applications
Terraces perform most effectively in barren areas with an existing or expected water erosion problem. Gradient terraces are effective only if suitable runoff outlets are available. Do not build terraces on slopes comprised of rocky or sandy soil because these soil types may not adequately redirect flows.
Implementation
Terraces should be properly spaced and constructed with an adequate grade, and they should have adequate and appropriate outlets toward areas not susceptible to erosion or other damage. Whenever possible, use vegetative cover in the outlet.
Terraced (stair-stepping) slopes shall have the vertical cuts no more than two (2) feet deep and the horizontal steps shall be wider than the depth of the vertical cut. The horizontal step shall slope backward to the vertical cut upslope on the hill.
Limitations
Terraces are inappropriate for use on sandy or shallow soils, or on steep slopes. If too much water permeates a terrace system's soils, sloughing could occur; potentially increasing cut and fill costs.
Maintenance
Terraces shall be inspected after major storms and at least once annually to ensure that they are structurally sound and have not eroded.
(Source: US Environmental Protection Agency)
8.11 BMP EC-5 Mulching
Description
Erosion is caused by rainfall impact detaching soil particles and runoff carrying the particles downslope. Mulch can be applied to the area to hold the soil particles in place and protect against erosion.
Mulching is the practice of applying a layer of organic material (hay, straw, wood fiber, paper fiber, etc.) to protect the soil from impact of precipitation.
Applicability
Areas that have been cleared of vegetation or do not have a protective cover on the soil. Mulches are typically used to protect areas that have been seeded. Mulching can be used in conjunction with chemical stabilization.
Design Criteria
Mulch should be applied consisting of clean, weed-free and seed-free, long-stemmed grass hay (preferred) or cereal grain straw. Hay is preferred as it is less susceptible to removal by wind. At least 50 percent of the grass hay mulch, by weight, shall be ten (10) inches or more in length.
Straw mulch shall be evenly applied at a rate of two (2) tons of dry straw per acre. The mulch shall be attached to the soil immediately after application as an anchor and not merely placed on the surface. This can be accomplished mechanically by crimping or with the aid of tackifiers or nets. Anchoring with a crimping implement is preferred, and is the recommended method for all areas equal to or flatter than 3:1. Mechanical crimpers must be capable of tucking the long mulch fibers into the soil four (4) inches deep without cutting them.
Mulch is typically applied using a mulch blower, but it can be applied by hand in small or hard to reach areas.
Soil which is exposed for more than fourteen (14) days with no construction activity shall be seeded, mulched, or revegetated.
On small areas sheltered from the wind and from heavy runoff, spraying a tackifier on the mulch is satisfactory for holding it in place. Hydraulic mulching consisting of wood cellulose fibers must be mixed with water and a tackifying agent and applied at a rate of no less than 2,000 pounds per acre with a hydraulic mulcher.
Mats, blankets, and nets are required to help stabilize steep slopes (3:1 and steeper) and waterways. Depending on the product, these may be used alone or in conjunction with grass or straw mulch. Normally, use of these products will be restricted to relatively small areas. Mats made of straw and jute, straw-coconut, coconut fiber, or excelsior can be used instead of mulch. Whichever material is used, blankets need to be bio-degradable.
Some synthetic tackifiers or binders may be used to anchor mulch in order to limit erosion and, if approved by review agency, provide soil stabilization. Caution should be used to prevent the introduction of any potentially harmful and non-biodegradable materials into the environment. Manufacturer's recommendations should be followed at all times.
Rock (gravel, slag, crushed stone, river rock) can also be used as mulch. It provides protection of exposed soils to wind and water erosion and allows infiltration of precipitation. Rock of aggregate base-coarse size can be spread on disturbed areas for temporary or permanent stabilization. Rock must be removed from those areas to be planned for vegetation establishment.
Limitations
Wind and concentrated water flows can blow or wash mulch from the application area. Mulch should not be applied in areas with concentrated flows.
For steep slopes and special situations where greater control is needed, blankets anchored with stakes should be required instead of mulch.
Road cuts, road fills, and parking lot areas shall be covered as early as possible with the appropriate aggregate base course where this is specified as part of the pavement in lieu of mulching.
Maintenance Requirements
Mulched areas shall be inspected regularly and after one-half (1/2) inch or greater rainfalls and mulch reapplied as required.
8.12 BMP EC-6 Temporary Outlet Protection, Energy Dissipation Devices, Riprap Apron
Description
Water exiting a channel, swale, pipe, or culvert (any water carrying conduit) typically is in a concentrated stream with a relatively high velocity. This high energy stream of water erodes unprotected soil.
Energy Dissipation is a structural BMP placed at the exit of a water carrying conduit to slow the velocity and decrease the turbulence of the water. Permanent energy dissipation controls can be used as temporary devices during the construction phase of the project, and shall be designed according to methods described in Chapter 6 – Open Channel Flow Design. A riprap apron is considered the most cost effective type of temporary energy dissipation device; meaning that the energy dissipation device is only needed during construction and will be removed once construction is complete. However, should a permanent energy dissipation device be required at the outlet end of a conduit it may be more economical to install a permanent energy dissipation device early in construction as a structural BMP, making sure to maintain and service the device so it can be used permanently once construction is over. Other types of energy dissipation devices include: Plunge Pools, ScourStop© Mats, ShoreMax© Mats, Velocity Dissipaters, etc. The only type of temporary energy dissipation device that will be discussed in this Manual will be the riprap apron. The use of riprap as a permanent energy dissipation device is discouraged and its use requires city approval.
Applicability
All channels or pipes carrying runoff at velocities that will erode the soil in the discharge area.
Design Criteria
See Section 6.0 – Outlet Protection of Chapter 7 –Culvert and Bridge Hydraulic Design for additional design information on sizing riprap apron outlet protection.
Determine the required median size (d50) of riprap using graph in the “Riprap Apron Sizing” Figure(s) below for the condition at hand. Enter the graph on the X-axis with the discharge in cubic feet per second, move vertically to intersect either the appropriate depth of flow (d) line or the velocity of flow (v) line, and then read horizontally to the Y-axis on the right side to determine the required median diameter of riprap (d50).
Determine the minimum required apron length using the graph in the “Riprap Apron Sizing” Figure(s). Enter the graph on the X-axis with the discharge in cubic feet per second, move vertically to the second set of lines to intersect the appropriate depth of flow (d), and then read horizontally to the left to determine the minimum required length of apron (La) in feet.
Limitations
Riprap aprons are best suited for applications where the Froude Number at the conduit exit is less than 2.5.
Maintenance Requirements
The apron should be inspected after large storms to ensure that the riprap is in place. Riprap should be replaced when it is dislodged or missing.
8.13 BMP EC-7 Temporary and Permanent Revegetation
Description
Erosion is caused by rainfall impact detaching soil particles and runoff carrying the particles downslope. Vegetation (seeded or sodded) can hold the soil particles in place and protect against erosion.
Applicability
Any area of a construction site that the natural vegetation has been removed. Seeding or sodding can be used as a temporary or a permanent erosion control measure.
Topsoil and Seedbed Preparation
Areas to be revegetated shall have soils capable of supporting vegetation. Overlot grading will oftentimes bring to the surface subsoils that have low nutrient value, little organic matter content, few soil microorganisms, rooting restrictions, and conditions less conducive to infiltration of precipitation. As a result, rototilling and adding topsoil, compost, and other soil amendments can be essential to achieve successful revegetation.
Topsoil should be salvaged during grading operations and used for spreading on areas to be revegetated later. Topsoil shall be viewed as an important resource to be utilized for vegetation establishment, primarily due to its water-holding capacity. Native topsoil located on a construction site also has good soil structure, organic matter content, biological activity, and nutrient supply that support vegetation.
At a minimum, the upper six (6) inches of topsoil can be stripped and stockpiled, and respread to a thicker depth on surfaces not planned for buildings or impervious areas. Stockpiled soils shall be seeded with a temporary or permanent grass cover. Mulching is recommended to ensure vegetation establishment. If stockpiles are located within one hundred (100) feet of a waterway, additional sediment controls, such as diversion dikes or embedded silt fences, should be provided.
If the soils have become compacted, they shall be loosened to a depth of at least six (6) inches.
Soil roughening will assist in placement of a stable topsoil layer on steeper slopes, and allow percolation and root penetration to greater depth. Soil roughening techniques shall be used for slopes greater than 3:1 (33%).
Where topsoil is not available or utilized, subsoils can be treated to provide a plant-growth medium. Organic matter, such as well digested compost, can be added to improve nutrient levels necessary for plant growth. Other treatments, such as liming, can be used to adjust soil pH conditions when needed. If the pH of the soil is less than 6, lime shall be added to the top six (6) inches of soil. Soil testing needs to be done to determine appropriate amendments required. Fertilizer (10-10-10) shall also be incorporated into the top six (6) inches of soil at a rate of 100 lb/acre.
A suitable seedbed will enhance the success of revegetation efforts. The surface should be rough and the seedbed should be firm, but neither too loose nor compacted. The seed bed should be loose, without large clods, and uniform before seeding. The upper layer of soil should be in a condition suitable for seeding at the proper depth and conducive to plant growth.
Temporary Revegetation
The appropriate temporary vegetation for a site is dependent upon the time of year. Prior to application of seed, grading of the site shall be complete including all erosion and sediment control practices.
Soil which is exposed for more than fourteen (14) days with no construction activity shall be seeded, mulched, or re-vegetated. All temporary seeding shall be protected with mulch.
Typical broadcast rates for temporary vegetation are listed in Table 8.1 below.
8.14 BMP EC-8 Wind Erosion or Dust Control
Description
Wind erosion or dust control consists of applying water or other dust palliatives as necessary to prevent or alleviate dust nuisance generated by construction activities. Covering small stockpiles or areas is an alternative to applying water or other dust palliatives.
Applications
Wind erosion control BMPs are suitable for construction vehicle traffic on unpaved roads, for drilling and blasting activities, for sediment tracking onto paved roads, for soil and debris storage piles, for batch drops from front-end loaders, for areas with unstabilized soil, and for final grading and site stabilization.
Limitations
Watering only prevents dust for a short period of time and should be applied daily (or more often) to be effective.
Over watering may cause erosion.
The effectiveness of wind erosion control depends on soil, temperature, humidity, and wind velocity.
Implementation
Dust control BMPs generally stabilize exposed surfaces and minimize activities that suspend or track dust particles. For heavily traveled and disturbed areas, wet suppression (watering), chemical dust suppression, gravel or asphalt surfacing, temporary gravel construction entrances, equipment washout areas, and haul truck covers can be employed as dust control applications. Permanent or temporary vegetation and mulching can be employed for areas of occasional or no construction traffic. Preventative measures would include minimizing surface areas to be disturbed, limiting onsite vehicle traffic to fifteen (15) mph, and controlling the number and activity of vehicles on a site at any given time.
Maintenance
Most dust control measures require frequent, often daily, or multiple times per day attention.
(Source: California Stormwater BMP Handbook, January 2003)
8.15 BMP EC-9 Hydroseeding / Hydromulching
Description
Hydroseeding typically consists of applying a mixture of wood fiber, seed, fertilizer, and stabilizing emulsion with hydromulch equipment, to temporarily protect exposed soils from erosion by water and wind and provide an environment conducive to plant growth. Hydromulching is applying a slurry of water, wood fiber mulch, and often a tackifier, to prevent soil erosion. These terms are often used interchangeably. For our purposes we will refer to hydroseeding only in this section, but all information shared below can and should be applied to hydromulching if its application is warranted in a design.
Applications
Hydroseeding is suitable for soil disturbed areas requiring temporary protection until permanent stabilization is established. Hydroseeding is also suitable for disturbed areas that will be re-disturbed following an extended period of inactivity.
Implementation
In order to select the appropriate hydroseeding mixture, an evaluation of site conditions shall be performed with respect to soil conditions, site topography, season and climate, vegetation types, maintenance requirements, sensitive adjacent areas, water availability, and plans for permanent vegetation.
Prior to application, roughen the area to be seeded with the furrows trending along the contours.
Hydroseeding can be accomplished using a multiple step or one step process. The multiple step process ensures maximum direct contact of the seeds to soil. When the one step process is used to apply the mixture, the seed rate shall be increased to compensate for all seeds not having direct contact with the soil.
Follow up applications shall be made as needed to cover weak spots and to maintain adequate soil protection.
Avoid over spray onto roads, sidewalks, drainage channels, and existing vegetation.
Limitations
Hydroseeding may be used alone only when there is sufficient time in the season to ensure adequate vegetation establishment and coverage to provide adequate erosion control. Otherwise, hydroseeding must be used in conjunction with mulching.
Steep slopes are difficult to protect with temporary seeding.
Temporary vegetation may have to be removed before permanent vegetation is applied.
Temporary vegetation is not appropriate for short term inactivity.
Maintenance
Hydroseeding BMPs, along with irrigation systems, shall be inspected prior to forecast rain, daily during extended rain events, after rain events, weekly during the rainy season, and at two-week intervals during the non-rainy season.
Where seeds fail to germinate, or they germinate and die, the area must be re-seeded, fertilized, and mulched within the planting season, using not less than half the original application rates.
(Source: California Stormwater BMP Handbook, January 2003)
8.16 BMP EC-10 Surface Roughening
Description
Water flowing down a bare slope will erode soil and transport soil to the bottom of the slope. Surface roughening provides temporary stabilization of disturbed areas from wind and water erosion.
Soil roughening is the practice of increasing the roughness of exposed soil by making grooves, tracks, or terraces (stair-steps) which run perpendicular to the flow path (parallel to slope) slowing flow and trapping sediment.
Applications
Soil roughening can be used on a wide variety of slopes and in conjunction with seeding and mulching.
Soil roughening is particularly useful where temporary revegetation cannot be immediately established due to seasonal planting limitations.
Design Criteria
Surface roughening shall be performed after final grading. Fill slopes can be constructed with a roughened surface. Cut slopes that have been smooth graded can be roughened as a subsequent operation. Roughening ridges and depressions should follow along the contours of the slope.
Tracking with lugged tracked equipment is appropriate on sandy material so as to not excessively compact the soil.
Grooving can be accomplished using a plow with the furrows three (3) inches deep and less than fifteen (15) inches apart.
Terraced (stair-stepping) slopes shall have the vertical cuts no more than two (2) feet deep and the horizontal steps shall be wider than the depth of the vertical cut. The horizontal step shall slope backward to the vertical cut upslope on the hill.
The slope shall be seeded immediately after roughening and mulch or chemical stabilization should be utilized where appropriate.
Limitations
Soil roughening should not be used on rocky soils or soils that are high in clay content. Tracking may cause excessive compaction which can lead to greater erosion.
Care should be taken not to drive vehicles or equipment over areas that have been roughened. Tire tracks will smooth the roughened surface and encourage runoff to collect into rills and gullies. As surface roughening is only a temporary control, additional treatments may be necessary to maintain the soil surface in a roughened condition.
Maintenance Requirements
Roughened slopes shall be inspected after ½ inch and greater storms and problem areas noted. After a rain event, slopes may need reconstruction, re-roughening, re-seeding, and re-mulching.
8.17 BMP EC-11 Temporary Slope Drain
Description
Gullying and excessive erosion will take place on slopes subjected to concentrated flows of runoff.
Slope Drains are conduits (open or closed) used to direct water down a slope while protecting the slope from erosion.
Applicability
Slopes with the potential for intended or unintended concentrated flows.
Design Criteria
Slope drains (rundowns, pipe slope drains, etc.) should be placed where runoff from uphill drainage areas will concentrate. Slope drains shall be sized to handle a 10-year storm from an area no greater than five (5) acres. Minimum size for a pipe slope drain is 18-inch diameter. Appropriate energy protection should be placed at the outlet of the pipe. Slope rundowns (stone or riprap lined channels) should be constructed with the middle sufficiently lower than the sides to ensure flow stays in the rundown. Slope drains operate best when used in conjunction with interceptor swales and dikes on the top of the slope. The discharge from all slope drains must be directed to a stabilized outlet, temporary or permanent channel, or sediment basin.
Limitations
For larger storms, the slope drain may not operate properly and can cause excessive gullying and slope erosion as well as damage to the construction site. Slope drains that are improperly designed or constructed such that the flow does not stay in the drain will cause excessive erosion.
Maintenance Requirements
Slope drains shall be inspected weekly and kept clear of trash, debris, and vegetation.
8.18 BMP EC-12 Temporary Stream Crossings
Description
A temporary stream crossing is a temporary culvert, ford, or bridge placed across a waterway to provide access for construction purposes. Temporary stream crossings are not intended to maintain traffic for the public. The temporary access will eliminate erosion and downstream sedimentation caused by vehicles.
Applications
Temporary stream crossings shall be installed at all designated crossings of perennial and intermittent streams on the construction site, as well as for dry channels that may be significantly eroded by construction traffic.
Temporary stream crossings shall be installed at sites when alternate access routes impose significant constraints, when crossing perennial streams or waterways causes significant erosion, and when appropriate permits have been obtained for the stream crossing (such as Corps of Engineers 404 permit).
Implementation
Temporary stream crossings are used to provide a safe, erosion-free access across a stream for construction equipment. Minimum standards and specifications for the design, construction, maintenance, and removal of the structure shall be established by a professional engineer registered in the State of Arkansas. Design and installation requires knowledge of stream flows and soil strength. Both hydraulic and construction loading requirements should be considered.
The following types of temporary stream crossings should be considered:
- Culverts – A temporary culvert is effective in controlling erosion, but will cause erosion during installation and removal. A temporary culvert can be easily constructed and allows for heavy equipment loads.
- Fords – Fords are appropriate during the dry season and on low-flow perennial streams. A temporary ford provides little sediment and erosion control and is ineffective in controlling erosion in the stream channel. A temporary ford is the least expensive stream crossing and allows for maximum load limits. It also offers very low maintenance.
- Bridges – Bridges are appropriate for streams and high flow velocities, steep gradients, and where temporary restrictions in the channel are not allowed.
The temporary stream crossing should be located where erosion potential is low. They should be constructed during dry periods to minimize stream disturbance and reduce costs.
Temporary stream crossings should be constructed at or near the natural elevation of the streambed to prevent potential flooding upstream of the crossing.
A culvert crossing should be designed to pass at least the 2-year design flow accounting for the headwater and tailwater controls to meet its design capacity.
When a ford needs to and can be used, namely a culvert is not practical or the best solution, it shall be lined with at least a twelve (12) inch thick layer of 6” riprap (D50) or 9” riprap (D50) with void spaces filled with 1-1/2 inch diameter rock.
Limitations
Installation and removal of the temporary stream crossings usually disturb the waterway, therefore additional BMPs will be required to minimize soil disturbance.
Appropriate permits will need to be obtained for the fill associated with temporary stream crossings (such as a Corps of Engineers 404 permit).
Installation may require dewatering or temporary diversion of the stream.
Fords shall only be used in dry weather.
Temporary stream crossings are not intended to maintain traffic for the public, only for construction purposes.
Maintenance
Inspect and verify that activity-based BMPs are in place prior to the commencement of associated activities. While activities associated with the BMP are under way, inspect weekly during the rainy season and at two week intervals in the non-rainy season to verify continued BMP implementation.
Check for blockage in the channel, sediment buildup or trapped debris in culverts, and for blockage behind fords or under bridges. Remove sediment that collects behind fords, in culverts, and under bridges periodically.
Check for erosion of abutments, channel scour, riprap displacement, or piping in the soil.
Check for structural weakening of the temporary crossings, such as cracks, and undermining of foundations and abutments.
Remove temporary crossings promptly when they are no longer needed.
8.19 BMP EC-13 Level Spreader
Description
A level spreader receives concentrated flow from channels, outlet structures, or other conveyance structures and converts them to sheet flow. Although a level spreader by itself is not considered a pollutant reduction device, it improves the efficiency of other facilities, such as vegetated swales, filter strips, or infiltration devices, which are dependent on sheet flow to operate properly. The slight depression allows water to collect and then disperse uniformly over the surrounding vegetated area to reduce erosion and concentrated stormwater runoff.
Applications
Level spreaders are used in wide, level areas where concentrated runoff occurs. The level spreader converts the concentrated runoff to sheet flow and releases it onto an area stabilized by vegetation. Flows to the spreader should be relatively free of sediment or the spreader will be quickly overwhelmed by sediment and lose its effectiveness.
Implementations
The spreader should be constructed absolutely level. Height of the spreader is based on depth of design flow, allowing for sediment and debris deposition. The length of the spreader is based on the design flow for the site.
The slope leading to the level spreader shall be less than one (1%) percent for at least twenty (20) feet immediately upstream in order to keep velocities less than two (2) feet per second at the spreader during the 10-year storm event. Slope of the outlet from the spreader shall be six (6%) percent or less.
Limitations
If the spreader is not absolutely level, flows will concentrate at the low point and may cause more problems than if no level spreader were used.
The drainage area shall be limited to five (5) acres or forty (40) cubic feet per second (cfs).
Maintenance
Regular inspection and maintenance is essential to ensure sheet flow discharge and to avoid channeling across the crest of the depression. The level spreader shall be inspected regularly and after large rainfall events. Inspection shall note and repair any erosion and low spots in spreader. Sediment shall be removed from behind spreader.
8.20 BMP SC-1 Stabilized Construction Entrance/Exit
Description
Mud and sediment carried off-site on the tires of equipment and vehicles will be deposited on the neighboring streets. This sediment will end up in the local streams if not swept up.
Construction Entrances are systems that clean vehicles of mud, sediment, and aggregate prior to leaving the site.
Applicability
Any entrance/exit of a construction site.
Design Criteria
A six (6) inch layer of B-stone (ranging in size from 1-1/2” minimum to 6” maximum, where the stone shall be uniformly graded and the amount passing the 1-1/2” sieve shall be not more than 10% by weight) can be used to stabilize construction site entrances. The stabilized construction entrance shall be a minimum length of twenty percent (20%) of the lot depth or fifty (50) feet, whichever is greater, up to a maximum of one hundred (100) feet and of adequate thickness to minimize tracking onto the city street. The stabilized construction entrance shall be at least 50 feet long. The entrance shall be as long as the longest vehicle that will enter the site. If larger volumes of traffic are expected, a two-lane entrance is appropriate.
Construction access shall be limited to locations as approved by the City of Rogers.
A stabilized construction entrance and a dunk or mechanical wheel wash are required on all sites.
Other methods of removing mud from vehicles may be acceptable such as rumble strips (cattle guard, logs, etc.).
A dunk wheel wash is a water filled, stabilized (1 inch or greater gravel or stone) pit. The water depth shall be at least two feet deep and the pit shall be at least 20 foot long. The pit shall be two vehicle lengths from the construction site exit and the entrance and exit to the pit shall be stabilized. These shall be provided on all sites. If there is not enough room to install a dunk wheel wash, a hand-operated pressure wash may be used instead with the approval of the city.
Limitations
In order to avoid puncturing tires, stabilized entrances shall not be constructed with sharp edge stones.
Maintenance Requirements
Stabilized entrances require periodic cleaning or addition of stone as the voids in the stones fill with mud and sediment.
Wheel wash facilities and rumble strips will need to be cleaned as the pits fill in order to provide more room to store new mud and sediment.
The street in front of the entrance shall be cleaned as required to remove sediment that has been tracked off site.
Whenever sediment is transported onto a public road, regardless of the size of the site, the road shall be cleaned immediately. Sediment shall be removed from roads by shoveling and sweeping and be transported to a controlled sediment disposal area. Washing of the street with a water hose or flushing the water downstream shall not be allowed.
8.21 BMP SC-2 Embedded Silt Fence
Description
Water flowing in sheet or shallow flow will carry sediment down a slope and off-site.
An embedded silt fence is a barrier made of geotextile fabric placed along a contour to capture water, slow the flowrate, trap sediment, and allow water to filter through the fabric.
Applications
Small drainage areas with sheet flow or shallow flow.
Design Criteria
The embedded silt fence shall be placed on a contour and designed to hold runoff from the 10 year storm from an area of 100 sq. ft for each foot of fence. The maximum depth of retained water on the upstream side of the fence shall be two (2) feet. The maximum slope length above the fence shall be no more than one hundred (100) feet. The maximum slope above the fence is 3:1.
The fabric shall be buried in a trench that is at least eight inch deep and eight inches wide. The fabric shall be place on the upstream side of the posts.
Post shall be made of metal (T-post) or wood (2”x2”) and placed no more than six feet apart.
All embedded silt fence shall be wire-backed except when used as inlet protection.
Limitations
Silt fence must be embedded or it will not function properly and should not be installed in rocky soil where it cannot be properly embedded.
Silt fence is not designed to hold back concentrated flow and therefore shall not be placed across channels, gullies, or streams.
Silt fence shall not be run down slopes as it will concentrate flow causing gully erosion and causing downstream BMPs to fail.
Maintenance Requirements
The embedded silt fence shall be inspected weekly and after one-half (1/2) inch or greater rainfalls for proper installation, defective fencing, erosion on the ends, and excessive sediment buildup behind the fence (half the fence height). Any sediment accumulated behind them must be removed and disposed of properly. Any defective measures shall be repaired or replaced within 24 hours.
8.22 BMP SC-3 Inlet Protection
Description
Runoff from a construction site often carries sediment into the stormwater sewer system, which discharges into local streams. Besides the problems caused by sediment, other pollutants (e.g. oil, grease, and nutrients) are often attached to the sediment.
Inlet Protection is the practice of placing gravel, sand bags, silt fence or other proprietary systems around or in an inlet to allow runoff to pond and sediment to settle out prior to entering the stormwater sewer system.
Applications
Any storm drain inlet that could receive runoff from the construction site.
8.23 BMP SC-4 Chemical Treatment
Description
Chemical treatment includes the application of chemicals to stormwater to aid in the reduction of turbidity caused by fine suspended solids.
Applications
Chemical treatment can reliably provide exceptional reductions of turbidity and associated pollutants and should be considered where turbid discharges to sensitive waters cannot be avoided using other BMPs. Typically, chemical use is limited to waters with numeric turbidity standards.
Implementation
Turbidity is difficult to control once fine particles are suspended in stormwater runoff from a construction site. Sedimentation ponds are effective at removing larger particulate matter by gravity settling, but are ineffective at removing smaller particulates such as clay and fine silt. Chemical treatment may be used to reduce the turbidity of stormwater runoff. Very high turbidities can be reduced to levels comparable to what is found in streams during dry weather.
Chemically treated stormwater discharged from construction sites must be non-toxic to aquatic organisms.
Maintenance
Chemical treatment systems must be operated and maintained by individuals with expertise in their use. Chemical treatment systems should be monitored continuously while in use.
(Source: California Stormwater BMP Handbook, January 2003)
8.24 BMP SC-5 Sediment Trap
Description
Water carrying sediment off-site can cause damage to neighboring property and local streams. Sediment Traps provide an area for sediment to settle out of the runoff prior to discharge from the site.
Applications
Sediment traps are well suited for sites that will be required to have a permanent stormwater control basin; but, should be used for any concentrated flow (culvert, pipe, swale, etc.) that could have sediment in the runoff leaving the site.
Design Criteria
The removal efficiency of sediment traps is a function of the total surface area of the pond, the shape of the pond, the influent flow rate, and the type of soil in the runoff. The maximum drainage area for a sediment trap shall be three (3 acres), for larger areas a sediment basin shall be used.
The minimum bottom area and spillway width for sediment traps are given in the Table 8.4 below. The berm or levee shall curve upstream to hold the water; the berm shall have 3:1 side slopes (maximum) and have a maximum depth of three (3) feet. The outlet spillway shall be made of six (6) inches of stone (6 inch diameter minimum) and be placed on a geotextile fabric, or approved equal, in lieu of rip rap.
8.25 BMP SC-6 Sediment Basin
Description
A sediment basin is a temporary basin formed by excavation or by constructing an embankment so that sediment-laden runoff is temporarily detained under quiescent conditions, allowing sediment to settle out before runoff is discharged.
Applications
Sediment basins should be considered for use when the drainage area is three (3) acres or more, for smaller areas a sediment trap shall be used.
Sediment basins should be considered where post construction detention basins are required.
Implementation
A sediment basin is a controlled stormwater release structure formed by excavation or by construction of an embankment of compacted soil across a drainage way, or other suitable location. It is intended to trap sediment before it leaves the construction site. The basin is a temporary measure and is to be maintained until the site area is permanently protected against erosion or a permanent detention basin is constructed.
Sediment basins shall be located at the stormwater outlet from the site, but not in a natural or undisturbed stream.
Limit the contributing area to the sediment basin to only the runoff from the disturbed soil areas. Use temporary concentrated flow conveyance controls to divert runoff from undisturbed areas away from the sediment basin.
The volume of the sediment basin shall be three-thousand (3,000) cubic feet per acre for property with average slope greater than five percent (5%), or fifteen-hundred (1,500) cubic feet per acre for property with an average slope less than five percent (5%). A properly sized sediment basin is required for each separate drainage area within the property being developed.
The outlet from a sediment basin shall be designed to empty its volume over an extended period of time. This is needed to permit the smaller sediment particles to settle to the bottom of the basin.
Maintenance
Sediment basins shall be inspected weekly and after one-half (1/2) inch or greater rainfalls for proper installation, erosion, and excessive sediment buildup and defective measures repaired or replaced within 24 hours.
Check inlet and outlet structures for any damage, obstructions, or erosion. Repair damage and remove obstructions as needed. The sediment basin must be maintained until final stabilization of the site.
8.26 BMP SC-7 Compost Filter Socks
Description
A compost filter sock is a type of contained compost filter berm. It is a mesh tube filled with composted material that is placed perpendicular to sheet flow runoff to control erosion and retain sediment in disturbed areas. The compost filter sock is oval to round in cross section, and it provides a three-dimensional filter that retains sediment and other pollutants while allowing the cleaned water to flow through. The filter sock can be used in place of a traditional sediment and erosion control tools, such as a silt fence.
Applications
Compost filter socks can be used on disturbed sites where stormwater runoff occurs as sheet flow.
Implementation
Compost filter socks are generally placed along the perimeter of a site, or at intervals along a slope, to capture and treat stormwater that runs off as sheet flow. They can be laid adjacent to each other, perpendicular to stormwater flow, to reduce flow velocity and soil erosion. They can be used on pavement as inlet protection.
No trenching is required; therefore, soil is not disturbed upon installation. Once the filter sock is filled and put in place, it shall be anchored to the slope. The preferred anchoring method is to drive stakes through the center of the sock at regular intervals; alternatively, stakes can be placed on the downstream side of the sock. The ends of the filter sock shall be directed upslope, to prevent stormwater from running around the end of the sock. The filter sock may be vegetated by incorporating seed into the compost prior to placement in the filter sock. Since compost filter socks do not have to be trenched into the ground, they can be installed on frozen ground or even pavement.
Limitations
The drainage areas for compost filter sock use shall not exceed 0.25 acre per 100 feet of device length and flow shall not exceed one (1) cubic foot per second. To ensure optimum performance for compost filter socks, heavy vegetation should be cut down or removed and extremely uneven surfaces should be leveled to ensure that the compost filter sock uniformly contacts the ground surface. Filter socks can be installed perpendicular to flow in areas where a large volume of stormwater runoff is likely, but should not be installed perpendicular to flow in perennial waterways and large streams.
Maintenance
Compost filter socks shall be inspected regularly, as well as after each rainfall event, to ensure that they are intact and the area behind the sock is not filled with sediment.
If there is excessive ponding behind the filter sock or accumulated sediments reach the top of the sock, an additional sock shall be added on top or in front of the existing filter sock.
If the filter sock was overtopped during a storm event, the operator should consider installing an additional filter sock on top of the original, placing an additional filter sock further up the slope, or using an additional BMP, such as a compost blanket.
(Source: US Environmental Protection Agency)
8.27 BMP SC-8 Fiber Rolls/Wattles
Description
Fiber rolls help reduce sediment loads to receiving waters by filtering runoff and capturing sediments.
Fiber rolls (also called fiber logs or straw wattles) are tube-shaped erosion control devices filled with straw, flax, rice or coconut fiber material. Each roll is wrapped with a UV-degradable polypropylene netting for longevity or with 100 percent biodegradable materials like burlap, jute, or coir. Fiber rolls also help to slow, filter, and spread overland flows. This helps to prevent erosion and minimizes rill and gully development. Fiber rolls also help reduce sediment loads to receiving waters by filtering runoff and capturing sediments.
8.28 BMP SC-9 Gravel Bag Berms
Description
A gravel bag berm is a series of gravel-filled bags placed on a level contour to intercept sheet flows. Gravel bags pond sheet flow runoff, allowing sediment to settle out. They also release runoff slowly to prevent erosion.
Applications
Gravel bag berms are suitable for sediment control when placed down slope of exposed soil areas, as sediment traps at pipe outlets, along the perimeter of a site, around temporary stockpiles, parallel to a roadway to keep sediment off paved areas, and along streams and channels.
Gravel bag berms are suitable for erosion control when placed at the top of slopes to divert runoff away from disturbed slopes, when placed along the face and at grade breaks of exposed and erodible slopes to shorten length and spread runoff as sheet flow, and as check dams across mildly sloped construction roads.
Implementations
Gravel bag berms are to be placed on level contours. For slopes between 20:1 and 2:1 (horizontal:vertical), gravel bags should be placed at a maximum interval of fifty (50) feet. For slopes 2:1 (horizontal:vertical) or steeper, gravel bags should be placed at a maximum interval of twenty-five (25) feet. Turn the ends of the gravel bag barriers up slope to prevent runoff from going around the berm. Allow sufficient space up slope from the gravel bag berm to allow ponding, and to provide room for sediment storage. Use a pyramid approach when stacking bags.
Limitations
Gravel bag berms may not be appropriate for drainage areas greater than five (5) acres.
Runoff will pond upstream of the berm, possibly causing flooding if sufficient space does not exist.
Installation can be labor intensive.
Maintenance
Gravel bag berms shall be inspected prior to forecasted rain, daily during extended rain events, after rain events, and at two (2) week intervals during the non-rainy season.
Gravel bags exposed to sunlight will need to be replaced every two (2) or three (3) months due to the degrading of the bags.
Sediment shall be removed when the sediment accumulation reaches one-third (1/3) of the barrier height.
Remove gravel bag berms when no longer needed.
(Source: California Stormwater BMP Handbook, January 2003)
8.29 BMP SC-10 Vegetative Buffers
Description
Vegetative buffers are areas of natural or established vegetation to protect the water quality of neighboring areas. Buffer zones slow stormwater runoff, provide an area where runoff can permeate the soil, contribute to ground water recharge, and filter sediment. Slowing runoff also helps to prevent soil erosion and stream bank collapse.
Applications
Vegetated buffers can be used in any area able to support vegetation. They are most effective and beneficial on floodplains, near wetlands, along stream banks, and on unstable slopes.
Implementations
Most vegetation will be removed from a construction site during clearing and grading operations. A perimeter buffer strip shall be temporarily maintained around disturbed areas for erosion control purposes and shall be kept undisturbed except for reasonable access for maintenance. The width of this strip shall be six percent (6%) of the lot width and depth. The minimum width shall be twenty-five (25) feet and the maximum shall be forty (40) feet. In no event shall these temporary buffer strips be less than the width of the permanent buffers required for the development.
Vegetative buffers shall be used along streams, creeks, rivers, lakes, and other water bodies. The stricter criteria should be used between the DEQ Construction General Permit buffer requirements and the following: A minimum strip twenty-five (25) feet wide, undisturbed except for reasonable access, shall be provided along each side of streams having a peak ten-year storm flow rate of greater than one hundred fifty (150) cubic feet per second. The twenty-five (25) foot strip shall be measured from the top of bank. An exception to this requirement is allowed where the only work being done on the site is public street construction.
Limitations
Adequate land and soil must be available for a vegetative buffer.
Maintenance
Once established, vegetated buffers do not require maintenance beyond the routine procedures and periodic inspections. Inspect them after heavy rainfall of 0.5-inch or greater and at least once every fourteen calendar days. Focus on encroachment, gully erosion, the density of the vegetation, evidence of concentrated flows through the areas, and any damage from foot or vehicular traffic. If more than six (6) inches of sediment has accumulated, remove it and restore vegetative buffer.
(Source: US Environmental Protection Agency)
8.30 BMP SC-11 Sediment Filters and Sediment Chambers
Description
Sediment filters are sediment-trapping devices typically used to remove pollutants (mainly particulates) from stormwater runoff. Sediment filters have four components: (1) inflow regulation, (2) pretreatment, (3) filter bed, and (4) outflow mechanism. Sediment chambers are one component of a sediment filter system.
Inflow regulation is diverting stormwater runoff into the sediment-trapping device. After runoff enters the filter system, it enters a pretreatment sedimentation chamber. This chamber is used as a preliminary settling area for large debris and sediments. It is usually no more than a wet detention basin. As water reaches a predetermined level, it flows over a weir into a bed of some filter medium. The medium is typically sand, but it can consist of sand, soil, gravel, peat, compost, or a combination. The filter bed removes small sediments and other pollutants from the stormwater as it percolates through the filter medium. Finally, treated flow exits the sediment filter system via an outflow mechanism. It returns to the stormwater conveyance system.
Sediment filter systems can be confined or unconfined, on-line or off-line, and aboveground or belowground. Confined sediment filters are constructed with the filter medium contained in a structure, often a concrete vault. Unconfined sediment filters are made without a confining structure. For example, sand might be placed on the banks of a permanent wet pond detention system to create an unconfined filter. On-line systems retain stormwater in its original stream channel or storm drain system. Off-line systems divert stormwater.
Applications
Sediment filters might be a good alternative for small construction sites where a wet pond is being considered as a sediment-trapping device. They are widely applicable, and they can be used in urban areas with large amounts of highly impervious area. Confined sand filters are man-made systems, so they can be applied to most development sites and have few constraining factors. However, for all sediment filter systems, the drainage area to be serviced shall be no more than ten (10) acres.
The available space is important to the design of sediment filters. Another important consideration is the amount of available head. Head is the vertical distance available between the inflow of the system and the outflow point. Because most filtering systems depend on gravity to move water through the system, if enough head is not available, the system will not be effective.
Limitations
For sediment filter systems, the drainage area to be serviced shall be no more than ten (10) acres.
Sediment filters are usually limited to removing pollutants from stormwater runoff. To provide flood protection, they have to be used with other stormwater management practices.
Sediment filters are likely to lose effectiveness in cold regions because of freezing conditions.
(Source: US Environmental Protection Agency)
8.31 BMP RC-1 Check Dams
Description
Excessive velocity of water in swales or channels causes erosion and transports the sediment downstream to local streams.
Check Dams (ditch check) slow water in channels and provide an area for sediment to settle out of the water before it flows over the dam.
Applications
Any unlined channel or any channel that the vegetative protection has not developed. Steeper slopes are more subject to erosion than flatter slopes.
Design Criteria
Place ditch checks such that the top of the downstream check is at the same elevation as the bottom of the next upstream check.
Checks must be constructed such that the top elevation of the center of the check is at least six (6) inches below the bottom elevation of both ends of the check. The dam must be excavated into the channel no less than six (6) inches as shown in the below figures.
Limitations
If improperly constructed, water will flow around or through the check dam and erode the banks of the channel. Large flows (less frequent storms) can washout the check dams, erode the banks at the end of the check dams, or cause excessive scour at the outfall of the check dam.
Maintenance Requirements
Sediment that collects behind a check dam shall be removed when the sediment reaches fifty percent (50%) of the depth to the spillway crest. Check Dams shall be inspected weekly and after one-half (1/2) inch or greater rainfalls for proper installation, erosion, and excessive sediment buildup and defects shall be repaired or replaced within 24 hours.
Check dams constructed in permanent swales shall be removed when perennial grasses have become established, or immediately prior to installation of a non-erodible lining. All of the rock and accumulated sediment shall be removed. The area shall be dressed to match surrounding grades, then seeded and mulched, or otherwise stabilized.
8.32 BMP RC-2 Triangular Silt Dike
Description
A triangular silt dike is a triangular-shaped foam block covered with geotextile fabric. When laid in a channel and placed perpendicular to the flow of water, it provides an area for sediment to settle out of the water. A triangular silt dike is a reusable alternative to rock check dams. It conforms to curves and rough terrain.
Applications
Any channel where the vegetative protection has not developed. Steeper slopes are more subject to erosion than flatter slopes.
Triangular silt dikes can also be used as diversion dikes and as inlet protection.
Design Criteria
Place ditch checks such that the top of the downstream check is at the same elevation as the bottom of the next upstream check.
A protective apron shall be installed on both sides of the dike to prevent erosion and failure and are secured using U-shaped wire staples.
A trench shall be excavated that is approximately three to six (3 to 6) inches deep on the upslope side of the dike. The trench shall then be backfilled and the soil compacted over the textile.
Limitations
If improperly constructed, water will flow around or the triangular silt dike and erode the banks of the channel. Large flows (less frequent storms) can washout the triangular silt dike, erode the banks at the end of the check dams, or cause excessive scour at the outfall of the check dam.
Maintenance Requirements
Triangular silt dikes shall be inspected weekly and after one-half (1/2) inch or greater rainfalls for proper installation, erosion, and excessive sediment buildup. Any damage shall be repaired immediately. Sediment must be removed when it reaches six (6) inches high on the dike. If the geotextile has deteriorated due to ultraviolet breakdown, it shall be replaced.
Triangular silt dikes constructed in permanent swales shall be removed when perennial grasses have become established, or immediately prior to installation of a non-erodible lining. All of the accumulated sediment shall be removed. The area shall be dressed to match surrounding grades, then seeded and mulched, or otherwise stabilized.
8.33 BMP RC-3 Grass-Lined Channels
Description
A grass-lined or sod-lined channel conveys stormwater runoff through a stable conduit. Vegetation lining the channel reduces the velocity of concentrated runoff and provides water quality benefits through filtration and infiltration. Because grassed channels are not usually designed to control peak runoff loads by themselves, they are often used with other BMPs, such as subsurface drains and riprap stabilization.
Where moderately steep slopes require drainage, grassed channels can include excavated depressions or check dams to enhance runoff storage, decrease flow rates, and improve pollutant removal. Peak discharges can be reduced by temporarily holding them in the channel. Pollutants can be removed from stormwater by filtration through vegetation, by deposition, or in some cases by infiltration of soluble nutrients into the soil. The degree of pollutant removal in a channel depends on how long the water stays in the channel and the amount of contact with vegetation and the soil surface. Local conditions affect the removal efficiency.
Applications
The first choice of lining should be grass or sod because this reduces runoff velocity and provides water quality benefits through filtration and infiltration. If the velocity in the channel would erode the grass or sod, riprap, concrete, or gabions can be used. Geotextile materials can be used in conjunction with either grass or riprap linings to provide additional protection at the soil-lining interface.
Use grassed channels in areas where erosion-resistant conveyances are needed, including areas with highly erodible soils and moderately steep slopes (though less than five (5%) percent). Install them only where space is available for a relatively large cross section.
Grassed channels have a limited ability to control runoff from large storms, so do not use them in areas where flow rates exceed five (5) feet per second.
Implementations
Site grass-lined channels in accordance with the natural drainage system. The channel should not receive direct sedimentation from disturbed areas and should be sited only on the perimeter of a construction site to convey relatively clean stormwater runoff. To reduce sediment loads, separate channels from disturbed areas by using a vegetated buffer or another BMP.
Consider using geotextiles to stabilize vegetation until it is fully established. Consider covering the bare soil with sod, mulches with netting, or geotextiles to provide reinforced stormwater conveyance immediately.
Use triangular channels with low velocities and small quantities of runoff; use parabolic grass channels for larger flows and where space is available; use trapezoidal channels with large, low-velocity flows (low slope).
Install outlet stabilization structures if the runoff volume or velocity might exceed the capacity of the receiving area.
Limitations
If grassed channels are not properly installed, they can change the natural flow of surface water and adversely affect downstream waters. And if the design capacity is exceeded by a large storm event, the vegetation might not be adequate to prevent erosion and the channel might be destroyed. Clogging with sediment and debris reduces the effectiveness of grass-lined channels for stormwater conveyance.
Grassed channels have a limited ability to control runoff from large storms, so do not use them in areas where flow rates exceed 5 feet per second.
Maintenance
The maintenance requirements for grass channels are relatively minimal. While vegetation is being established, inspect the channels after every rainfall. After vegetation is established, mow it, remove litter, and perform spot vegetation repair. The most important objective in grassed channel maintenance is to maintain a dense and vigorous growth of turf.
Periodically clean the vegetation and soil buildup in curb cuts so that water flow into the channel is unobstructed.
During the growing season, cut the channel grass no shorter than the level of the design flow.
(Source: US Environmental Protection Agency)
8.34 BMP RC-4 Interceptor and Diversion Dikes and Swales
Description
Water running onto the site will increase erosion and be a nuisance to construction activities. Additionally, runoff from the construction site can have excessive amounts of sediment that can end up in local streams.
Interceptor and Diversion Swales and Dikes are diversion systems used to divert runoff around a site or to direct runoff from a site to a pond in order to settle out sediment prior to discharge from the site.
Applicability
Any area that is subject to runoff from uphill drainage areas.
Design Criteria
There are two types of temporary slope diversion dikes:
- A diversion dike located at the top of a slope to divert upland runoff away from the disturbed area. The runoff from undisturbed upland areas may be directed by such dikes to a permanent channel or temporary diversion channel.
- A diversion dike located at the base or mid-slope of a disturbed area to divert sediment-laden water to a sediment basin. The discharge intercepted by these diversion dikes may be directed to a temporary slope drain and/or sediment basin.
Temporary diversion dikes shall be provided whenever:
S 2L > 2.5 for undisturbed tributary areas:
S 2L > 1.0 for disturbed tributary areas:
S 2L > 0.25 for paved tributary areas:
where: S = slope of the upstream tributary area (in feet/foot); and,
L = length of the upstream slope (in feet).
and
Undisturbed Tributary Area = area tributary to the temporary diversion dike that is, and will remain, in a natural condition undisturbed by development activities.
Disturbed Tributary Area = area tributary to the temporary diversion dike that has been disturbed by development activities, including removal of native vegetation and/or compaction of native soils.
Impervious Tributary Area = area tributary to the temporary diversion dike that is largely comprised of impervious surfaces, such as buildings and pavement.
The swale (channel) and dike shall be situated to capture runoff uphill of the work area with a vegetative buffer uphill of the swale to remove sediment before it enters the swale. The stabilized swale and ditch shall be in-place prior to all other earth work on the project. The channel shall be designed to handle the 10-year storm, with the bottom and sides protected for the anticipated water velocity. Typically, the ditch will be two (2) foot wide at the bottom and six (6) foot wide at the top. Maximum water velocity in the swale shall not exceed four (4) feet per second. Side slopes shall be no steeper than 3:1 (horizontal:vertical). Energy dissipation shall be provided at the exit from the swale as needed.
8.35 BMP RC-5 Rough-Cut Street Control
Description
Rough-cut street controls are dirt berms, sandbag dikes, or gravel filled geotextiles socks used to prevent rill, channel and gully erosion on unpaved streets.
Rough cut street controls are runoff barriers that are constructed at intervals down an unpaved road. These barriers are installed perpendicular to the longitudinal slope from the outer edge of the roadside swale to the crown of the road. The barriers are positioned alternately from the right and left side of the road to allow construction traffic to pass in the lane not barred. Refer to the rough-cut street control detail below.
Applicability
Rough-cut street controls shall be considered for roadways that are not paved for thirty (30) days of final grading and have not received an application of road base.
Maintenance
Rough-cut street controls shall be inspected immediately following the initial installation, once a week while the site is under active construction, and immediately following a rain event.
Accumulated sediment shall be removed when the sediment depth is a quarter (1/4) the height of the berm.
Rough-cut street control shall be repaired immediately following any sign of wear or alteration of the original shape and dimensions.
Rough-cut street control shall be kept in place and maintained until subgrade preparation begins for paving.
Figure CS-17 – Rough-Cut Street Control (Source: Orange County, CA)
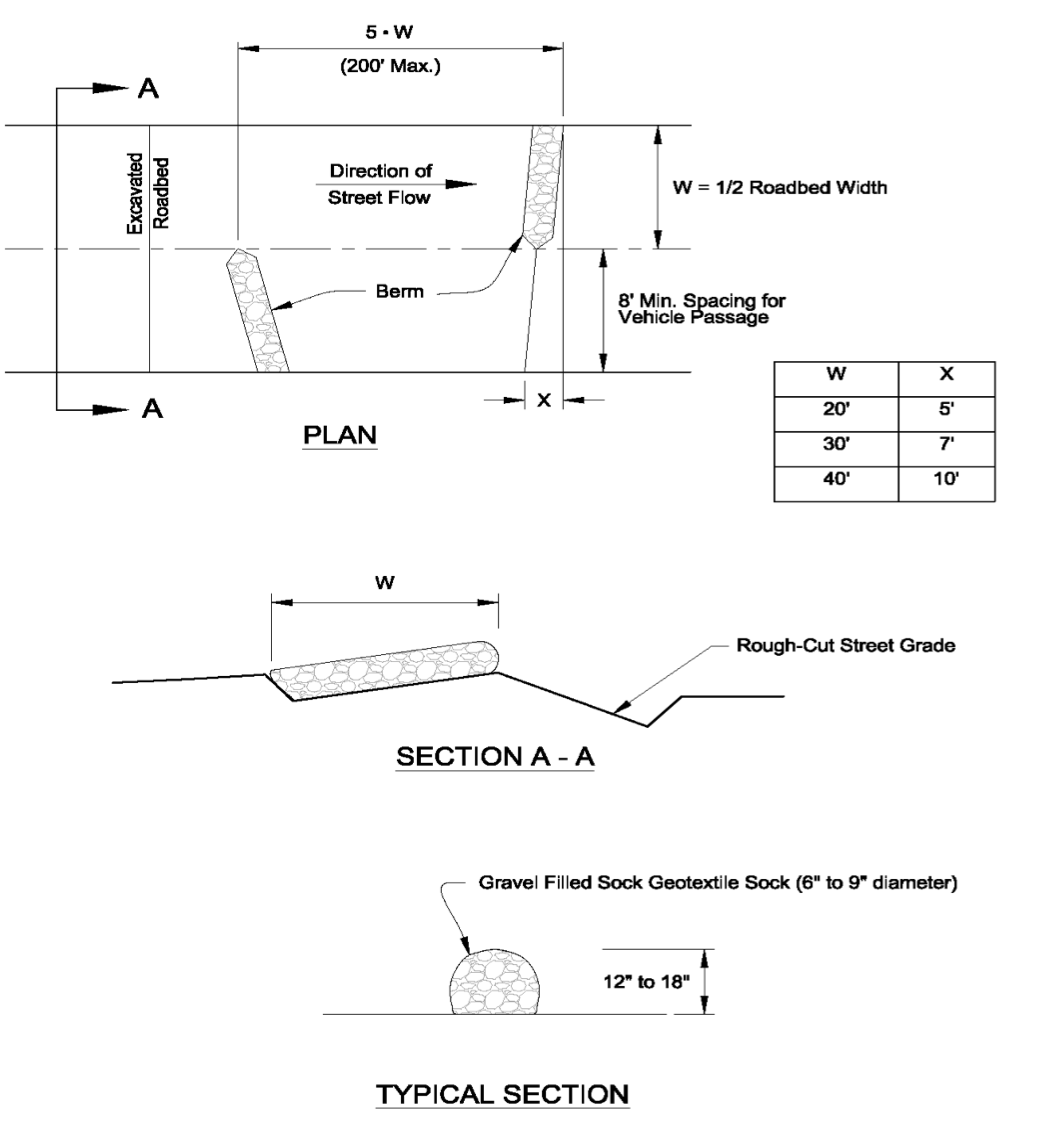
8.36 BMP RC-6 Water Bars
Description
A water bar is a ridge of compacted soil, loose rock, or gravel constructed diagonally across disturbed rights-of-way and similar sloping areas. The height and side slopes of the water bar are designed to divert water and allow vehicles to cross. Water bars are used to shorten the flow length within a long sloping right-of-way, thereby reducing the erosion potential by diverting storm runoff to a stabilized outlet or sediment trapping device.
Applications
Water bars can be used in areas where earthen diversions are applicable and where there will be little or no construction traffic within the right-of-way. Gravel structures are more applicable to roads and rights-of way which accommodate vehicular traffic.
Implementations
Construction of utility lines and roads often requires the clearing of long strips of right-of-way over sloping terrain. The volume and velocity of stormwater runoff tend to increase in these cleared strips and the potential for erosion is much greater since the vegetative cover is diminished or removed. To compensate for the loss of vegetation, it is usually a good practice to break up the flow length within the cleared strip so that runoff does not have an opportunity to concentrate and cause erosion. At proper spacing intervals, water bars can significantly reduce the amount of erosion which will occur until the area is permanently stabilized.
Limitations
Water bars shall not be used for drainage areas less than one (1) acre.
The water bar spacing must be close enough to dissipate water flow energy.
Water bars can be used where there will be little or no construction traffic within the right-of-way. Gravel structures are more applicable to roads and rights-of way which accommodate vehicular traffic.
Maintenance
Water bars shall be inspected after every rainfall and repairs made if necessary. Approximately once every week, whether a storm has occurred or not, the measure shall be inspected and repairs made if needed. Earth fill that is subject to damage by vehicular traffic shall be reshaped at the end of each working day.
(Source: NRCS Planning and Design Manual)
Purpose of the Chapter
The purpose of this chapter is to provide guidance for selecting, designing, and maintaining stormwater Best Management Practices (BMPs) to minimize potential adverse impacts on stormwater quality caused by urbanization in the City of Rogers. The City, along with many communities around the United States, encourages the widespread use of stormwater BMPs on all development sites.
To comply with the Federal Clean Water Act, the Arkansas Department of Energy & Environment Division of Environmental Quality (DEQ) issued Arkansas State Operating Permit ARR040041 to the City of Rogers to authorize discharges from the City’s Municipal Separate Storm Sewer System (MS4) to waters of the State. In accordance with the MS4 permit, the City is required to develop and implement a comprehensive Stormwater Management Program that includes controls to identify illicit discharges and reduce the discharge of pollutants from the MS4 to the Maximum Extent Practicable. The design tools provided in this chapter are intended to improve the quality of stormwater runoff from development sites in the City.
Chapter Summary
The historic, traditional approach for managing stormwater was to convey the water away from developed areas as quickly as possible. Today, sound stormwater management programs require new developments to be designed in a manner to reduce runoff volumes, runoff velocities and reduce pollutant loads. This can be achieved with properly designed, implemented, and maintained stormwater BMPs.
The City requirements for stormwater quality protection described in this chapter apply to:
- All development and additions to existing sites that increase the site’s impervious area by one tenth (0.1) of an acre or more, including projects that are less than one tenth (0.1) of an acre that are part of a larger common plan of development or sale;
- Sites that are being redeveloped; or
- Other developments, increasing the impervious area by less than one tenth (0.1) of an acre, that have been specifically identified by the City as having a significant potential to adversely impact the quality of stormwater runoff.
To achieve basic objectives related to stormwater quality such as protecting drinking water supplies, protecting human health and the environment, and complying with the federal National Pollutant Discharge Elimination System (NPDES) permit requirements, the City will require new developments to implement several fundamental principles with respect to stormwater management, including:
- Minimizing the amount of runoff from developed areas;
- Minimizing the amount of Directly Connected Impervious Area (DCIA);
- Maximizing the contact of runoff with grass and vegetated soil;
- Maximizing holding and settling times in detention basins;
- Designing BMPs for small, frequent storms;
- Utilizing BMPs in series where feasible;
- Incorporating both flood control and stormwater quality objectives in designs;
- Providing special treatment for runoff from fueling areas and other areas having a high concentration of pollutants; and
- Stabilizing drainageways downstream from developments.
The quantifiable objective of these principles is to capture and manage the Water Quality Capture Volume (WQCV) of each development site. To achieve this objective, specific types of BMPs that can be used are described in this chapter. These include:
- Extended Dry Detention Basin
- Extended Wet Detention Basin
- Constructed Wetland Basin
- Permeable Pavers
- Porous Landscape Detention
- Vegetated Filter Strip/Grass Buffer
- Grass Swale
For each of the BMPs listed above, a description is provided of design considerations, the design procedure and criteria, maintenance considerations, and a design example. Other BMPs are also discussed briefly, such as design considerations for material storage and handling areas, spill containment and control measures, and alternative structural BMPs (e.g., proprietary stormwater treatment units). Low Impact Development (LID), a design approach that incorporates many of the design elements described in this chapter, is also presented.
Other important considerations identified include restrictions imposed by the United States Fish and Wildlife Service (USFWS) on development in the Karst Formation/Cave Springs Recharge Area and regulatory requirements of the United States Army Corps of Engineers (USACE) associated with the development of constructed wetlands.
City Stormwater Protection Requirements
To comply with the City requirements for protection of stormwater quality, new developments or redevelopments must satisfy one of the following two requirements outlined below:
- The onsite or regional stormwater BMPs must store and treat the calculated Water Quality Capture Volume (WQCV) for the site.
or - A fee must be paid in lieu of implementing the onsite facilities necessary to store and treat the WQCV. The fee-in-lieu option is an alternative only when the development or redevelopment site disturbs between one tenth (0.1) and one half (0.5) of an acre, or the site has not been specifically identified by the City as having a significant potential to adversely impact the quality of stormwater runoff. Fees collected from this option are used for other stormwater quality protection projects throughout the City. Although the fee-in-lieu option eliminates the need to store and treat the WQCV on-site, it does not eliminate the need to provide water quality BMPs on the site upstream of the discharge point to the receiving stream or storm sewer.
For development sites that have been specifically identified by the City as having a significant potential to adversely impact stormwater quality (e.g., development on steep slopes or highly erosive soils), then the only acceptable option, regardless of the size of the site, is to capture and manage the WQCV calculated for the site. The fee-in-lieu option is not applicable to these sites.
1.1. Nature of Pollutants in Stormwater Runoff
Urban stormwater runoff can contain a variety of pollutants that can adversely impact waterbodies. The Nationwide Urban Runoff Program (USEPA 1983) and other studies widely document the types and concentrations of pollutants associated with various land use types. Urban runoff may contain contaminants such as metals, lubricants, solvents, pesticides, herbicides, fertilizers, pet waste, litter and suspended sediments.
The quality of stormwater runoff from the City is of particular importance given its location in the watersheds of Beaver Lake to the east and the Illinois River to the west. This chapter discusses specific engineering measures that can be implemented to improve stormwater quality.
1.2. Historic Engineering Approaches for Stormwater Management
Traditional engineering approaches for stormwater management historically focused on moving water away from people, structures, and transportation systems as quickly and efficiently as feasible. This was accomplished by creating conveyance networks of impervious storm sewers, roof drains, and lined channels, which concentrated runoff discharges to receiving waters.
While the historical focus on stormwater was not on water quality, the potential adverse effects of urban runoff on the physical, chemical, and biological characteristics of receiving waters have been widely documented (e.g., WEF/ASCE 1992, 1998; Debo and Reese 2002; Horner, et al. 1994; Schueler and Holland 2000). Potential water quality implications of the traditional approach to drainage design include the following:
- Introduction of new pollutant sources and types (e.g., sediment from streets and parking lots).
- Increased runoff temperature.
- Habitat damage and ecosystem disruption associated with increased runoff from impervious surfaces, resulting in streambed and bank erosion and associated sediment and pollutant transport.
- Channel widening and instability.
- Destruction of both aquatic and terrestrial physical habitats.
- Increased contaminant transport, leading to increased water quality degradation that often may result in regulatory consequences such as stream segments being listed as impaired on the State 303(d) list and requirements for Total Maximum Daily Load (TMDL) allocations for dischargers to the stream.
- Production of potentially toxic concentrations of contaminants in receiving waters and long-term accumulation of contaminants.
1.3. New Approach and Requirements for Stormwater Management
To comply with the Federal Clean Water Act, the Arkansas Department of Energy & Environment Division of Environmental Quality (DEQ) issued Arkansas State Operating Permit ARR040041 to the City of Rogers to authorize discharges from the City’s Municipal Separate Storm Sewer System (MS4) to waters of the State. In accordance with the MS4 permit, the City is required to develop and implement a comprehensive Stormwater Management Program that includes controls to identify illicit discharges and reduce the discharge of pollutants from the MS4 to the Maximum Extent Practicable. The design tools provided in this chapter are intended to improve the quality of stormwater runoff from development sites in the City.
To comply with the NPDES requirements and to minimize the potential adverse impacts of urbanization on water quality, the City, along with many communities around the United States, encourages the widespread use of stormwater BMPs on all development sites. The purpose of this chapter is to provide guidance for selecting, designing, and maintaining BMPs. This section is primarily targeted at protecting water quality in conjunction with development and redevelopment of residential and commercial areas. However, BMPs for light industrial areas and other types of land uses are also addressed.
Structural BMPs are constructed facilities designed to passively treat urban stormwater runoff, including practices such as detention basins (both dry basins and wet ponds), wetlands, permeable pavement, and designed vegetated zones, among others. Structural BMPs can be designed to treat small volumes of stormwater on development sites or to serve larger regional drainage areas.
Non-structural BMPs are practices and procedures that minimize or prevent pollution and control it at its source. Examples of non-structural BMPs include proper handling and storage of materials, minimizing directly connected impervious areas to reduce the transport of pollutants in runoff, and implementing public education programs to protect stormwater quality.
The design guidelines in this chapter represent current BMP technology and are anticipated to evolve as BMP technology is evaluated and refined, new BMPs are developed, or as new standards are promulgated by the State. This chapter significantly draws from the Denver Urban Drainage and Flood Control District (UDFCD) Urban Storm Drainage Criteria Manual (UDFCM), Volume 3,Best Management Practices, first published in 1992 and regularly updated since then. Volume 3 updates and other information are available from the UDFCD website (www.udfcd.org).
Design requirements are presented for both structural and non-structural water quality BMPs. General BMP descriptions, design considerations and criteria, maintenance considerations, design forms and completed examples are provided for each structural BMP. The discussion in this section is limited to permanent, post-development BMPs. For information on construction-phase erosion and sediment control BMPs, the Chapter 8 –Construction Site Stormwater Management shall be referenced.
3.1. Water Quality Design Principles
To achieve the stormwater quality design objectives for a new development, designs shall incorporate one or more of the following principles:
- Minimize the amount of runoff. The total quantity of pollutants transported to receiving waters can be minimized most effectively by minimizing the amount of runoff. Both the quantity of runoff and the amount of pollutant wash-off can be reduced by minimizing the Directly Connected Impervious Area (DCIA) at a site. Impervious areas are considered connected when runoff travels directly from roofs, driveways, pavement, and other impervious areas to street gutters, closed storm drains, and concrete or other impervious lined channels. Impervious areas are considered disconnected when runoff travels as sheet flow over grass areas or through properly designed BMPs, prior to discharge from the site.
Minimizing DCIA is a land development design philosophy that seeks to reduce paved areas and direct stormwater runoff to landscaped areas, grass buffer strips, and grass-lined swales to slow down the rate of runoff, reduce runoff volumes, attenuate peak flows, and facilitate the infiltration and filtering of stormwater. This approach increases the time of concentration for runoff, in contrast to the historic stormwater engineering approach that resulted in drainage systems with a relatively rapid, large peak runoff rate and increased runoff volumes, even for relatively small storms.
A design approach that minimizes DCIA can be integrated into the landscape and drainage planning for any development. Drainage from rooftop collection systems, sidewalks, and driveways can be directed to landscaped areas, infiltration areas such as porous landscape detention and permeable pavement, grassed buffer strips, or to grass swales. Instead of using traditional solid curbing, curbing can be eliminated in some areas or slotted curbing can be used along with stabilized grass shoulders and swales or can direct flows towards BMPs within street bulb-outs. Residential driveways can use permeable pavement or their runoff can be redirected to the lawn rather than the street. Large parking lots can minimize DCIA by using permeable pavement to capture runoff and encourage local infiltration or storage. Green roofs may also be used as a tool to minimize DCIA. - Maximize contact with grass and vegetated soil. The opportunity for pollutants to settle can be maximized by providing maximum contact with grass and vegetated soil. Directing runoff over vegetative filter strips and grass swales enhances settling of pollutants as the velocity of flow is reduced. Street bulb-outs must have plantings proposed within them in the design to be utilized as BMPs to capture and treat runoff from the impervious areas within the right-of-way.
- Maximize holding and settling time. The most effective runoff quality controls reduce both the runoff peak and volume. By reducing the rate of outflow and increasing the time of detention storage, settling of pollutants and infiltration of runoff are maximized.
- Design for small, frequent storms. Drainage stormwater systems for flood control are typically designed for large, infrequent storm events. In contrast, water quality controls shall be designed for small, frequent storm events. In Rogers, approximately 90 percent of all rainfall events are 1 inch or less. Studies indicate that many pollutants are frequently washed off in the “first flush,” typically considered the first ½ inch of runoff from directly connected impervious areas.
- Utilize BMPs in series where feasible. Performance monitoring of BMPs throughout the country has shown that the combined effect of several BMPs in series can be more effective in reducing the level of pollutants than just providing a single BMP at the point of discharge. To the extent practical, impervious areas shall be disconnected with runoff directed first to vegetative filter strips, then to grass swales or channels, and then to extended detention basins, etc.
- Incorporate both flood control and stormwater quality objectives in designs, where practical. Incorporating both flood control and water quality enhancement into a single stormwater management facility is encouraged whenever practical. Combining several objectives, such as water quality enhancement and flood control, maximizes the cost-effectiveness of stormwater management facilities.
- Provide special care for runoff from fueling areas and other areas having a high concentration of pollutants. Runoff from areas that pose a specific high hazard to the quality of runoff must be directed to a properly designed BMP that provides both filtration and settling prior to discharge to receiving waters.
3.2. Water Quality Capture Volume
Studies indicate that small-sized, frequently occurring storm events account for the majority of events that result in stormwater runoff from urban drainage basins. Consequently, these frequent storms also account for a significant portion of the annual pollutant loads. Capture and treatment of stormwater from these small and frequently occurring storms is the recommended design approach for water quality enhancement, as opposed to designs for flood control facilities that focus on larger, less frequent storm events. Incorporation of both sets of criteria (i.e., small, frequent storms for water quality purposes and larger storms for flood control) into a single stormwater management facility is encouraged, where practical. However, unless exempt from the requirement, no single BMP shall address more than 50 percent of the site’s calculated WQCV.
For sites where the water quality requirements apply, water quality BMPs shall be designed to capture and treat the WQCV of the site. The required WQCV (measured in cubic feet [ft3]) is a function of the total area tributary to the storage facility and the impervious percentage of the tributary area. The WQCV curves in Figure WQ-1 are calculated for the City of Rogers and are based on approximately the 85th percentile runoff event (i.e., the top 85 percent of storm events in Rogers that generate runoff) (WEF and ASCE, 1998). The required WQCV will need to be dispersed throughout the site. No single BMP can address more than 50 percent of the required WQCV unless a regional water quality BMP is present or if the site is within an industrial zone. The three curves represent the required WQCV for drain times of 12, 24, and 48 hours. Different drain times are required depending on the type of BMP and their relative effectiveness in removing suspended sediments and other contaminants. Storage and treatment of the WQCV can be achieved through the use of five BMPs described in Section 4.0. These BMPs and their respective drain times are:
- Extended dry detention basin 48 hour drain time
- Constructed wetland basin 24 hour drain time
- Permeable pavers 24 hour drain time
- Extended wet detention basin 12 hour drain time
- Porous landscape detention 12 hour drain time
*Refer to Chapter 5 – Detention Design for drain times associated with volumetric detention.
With an understanding of the type of BMP to be employed and the associated drain time, and the impervious percentage of the area tributary to the BMP, Figure WQ-1 graphically shows the WQCV (in cubic feet) per square foot of area tributary to the storage facility. The required WQCV shall be computed using the WQCV Worksheet in the BMP spreadsheet.
The required quantity of the WQCV can be reduced through the use of BMPs that minimize the DCIA at a site. Such BMPs promote infiltration and reduce the runoff volume from a site. These BMPs also serve to filter runoff that does leave the site. Three BMPs that can be used to reduce the necessary WQCV include:
- Permeable pavers
- Vegetated filter strip/grass swale
- Grass swale
As seen above, the use of permeable pavers can potentially store and treat the WQCV as well as reduce the necessary WQCV. The pavers’ function would depend on the design of the system. Sites that are increasing the overall impervious area, not including any building’s footprint, beyond 2,000 square feet must make at least 10 percent of that impervious area permeable pavement so as to minimize the DCIA. Areas where heavy vehicles or equipment are expected would be exempt of implementing permeable pavement for this purpose. The reduction in the amount of necessary WQCV provided by use of permeable pavement and these BMPs is described in Appendix A.
Figure WQ-1
Water Quality Capture Volume for Rogers, Arkansas
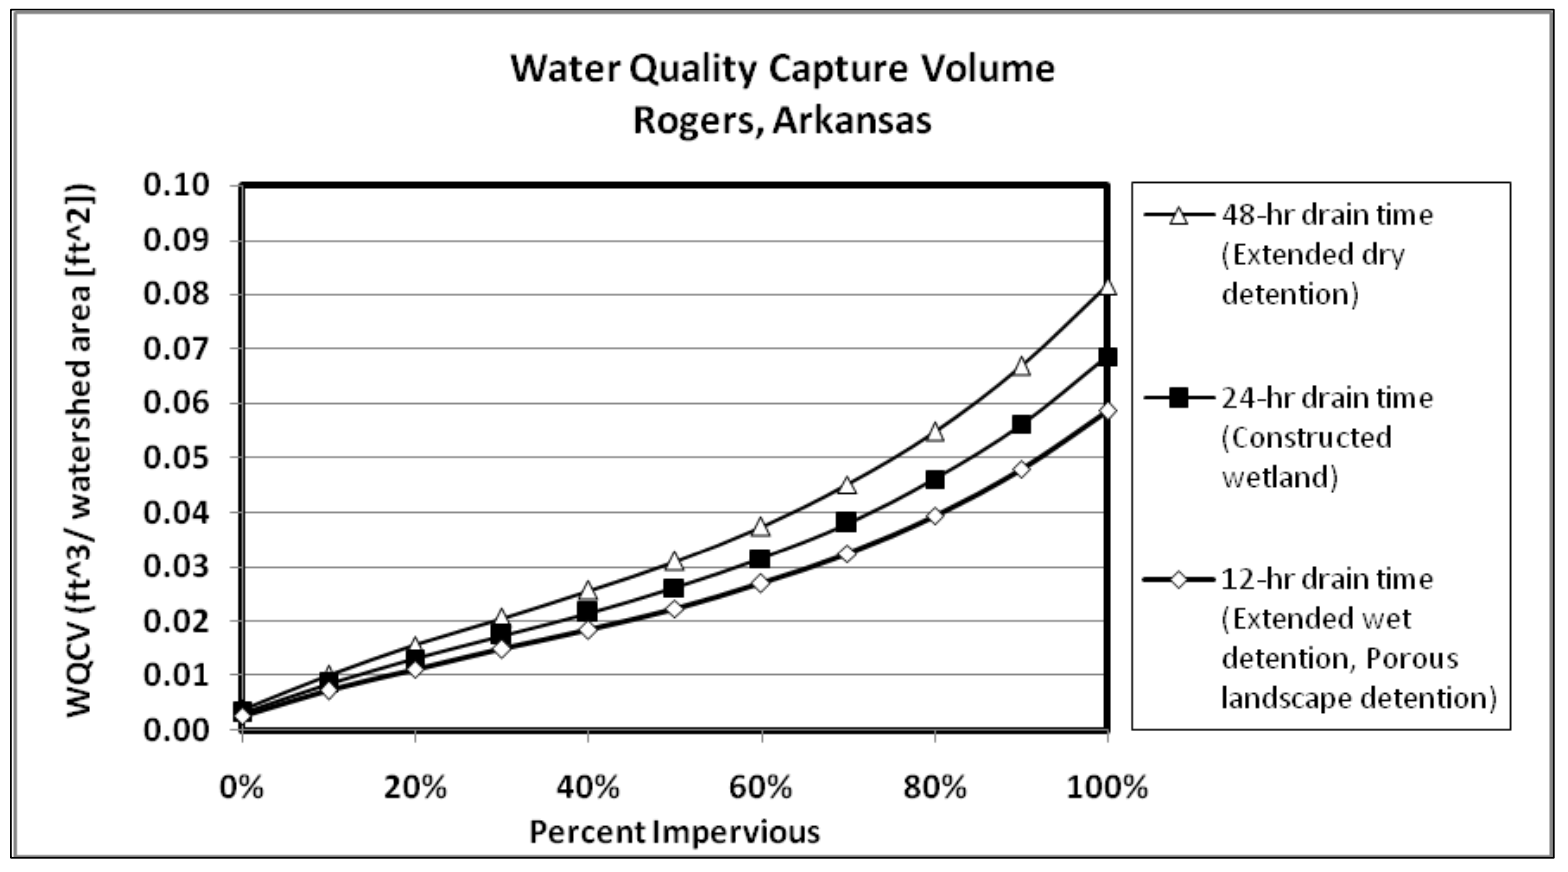
3.3. Fee-in-Lieu of Implementing Water Quality Measures
The City may allow the property owner to pay a fee in-lieu-of implementing the water quality control measures described in this section. The fee paid in-lieu-of water quality protection measures is an acceptable alternative only if the development site disturbs less than one half (0.5) an acre and the site has not been specifically identified by the City as having a significant potential to adversely impact the quality of stormwater runoff. Sites that have an existing regional water quality control facility with adequate capacity, as determined by the City, are exempt of having to pay a fee-in-lieu of water quality protection. Proceeds from fees collected from this option will be used by the City to fund regional stormwater facilities or other measures that will benefit the quality of stormwater in the community. The methodology for calculating the in-lieu-of fees is described in Appendix B.
3.4. Other Important Considerations for BMP Selection
In addition to the design considerations above, the following factors shall be considered when selecting BMPs for a site:
- Pollutants Controlled - The BMPs shall effectively control pollutants known to be associated with the tributary land use.
- Reliability/Sustainability - Measures shall be effective over an extended time and be able to be properly maintained over time.
- Public Acceptability - BMP selection shall consider the expected response from the public, particularly neighboring residential properties, if any.
- Agency Acceptability - BMP selection shall consider the expected response of agencies that will oversee the BMPs and their relationship to regulatory requirements.
- Public Safety - Control measures shall be evaluated in terms of public safety and the risks or liabilities that occur during implementation. Public safety is always one of the most important design considerations, not only for “traditional” drainage structures, but also for BMPs.
- Performance Verification – All hydrodynamic separators employed on a site with the intention of being utilized as a BMP for water quality mitigation will need to be listed on the most up to date list of New Jersey Department of Environmental Protection (NJDEP) Certified Stormwater Manufactured Treatment Devices (MTDs). MTDs must to be regularly maintained by the agency overseeing BMPs on a site.
- Mosquito Control - The potential for mosquito breeding and the spread of mosquito-borne illnesses in stormwater BMPs must be addressed. In general, the biggest concern is the creation of areas with shallow stagnant water and low dissolved oxygen that creates prime mosquito habitat. Other habitat characteristics that may enhance breeding include dense stands of vegetation that may protect larvae from natural predators and soils with high organic content. While stormwater BMPs such as detention ponds and constructed wetlands often include these features, careful design and proper management and maintenance of systems can effectively control mosquito breeding.
The key to minimizing breeding is to avoid creating, or allowing the formation of, areas of shallow standing water. Studies indicate that pools of deep water (≥ 5 feet) and pools with residence times less than 72 hours are less likely to breed mosquitoes. Stormwater BMPs with permanent pools are generally less of a concern than dry detention basins because of their greater depth. Therefore, dry detention basins must have outlets designed to drain within 48 hours.
Once the BMPs are implemented, it is necessary to ensure that structural BMPs are properly operated and maintained and that the relevant non-structural BMPs are also being implemented. This may involve requiring subdivision covenants, inspecting BMPs, designating individuals responsible for BMPs, and pollution prevention education. Modifications to BMPs over time may also be necessary if land uses or other factors change or if BMPs prove to be ineffective or a nuisance. For permeable paver systems, see the Annual Inspection and Maintenance Checklist.
4.8. Covering of Storage/Handling Areas
Covering of storage and handling facilities and proper handling of potential industrial or commercial pollutants, such as salt piles, oil products, pesticides, fertilizers, etc., is a requirement under the City’s Municipal Separate Storm Sewer System (MS4) discharge permit. A copy of the City’s MS4 discharge permit can be provided upon request. In addition, these practices reduce the likelihood of stormwater contamination and help prevent loss of material from wind or rainfall erosion. Development plans for these facilities must specify how potential pollutants will be covered and handled to prevent discharge of the pollutant into the City’s MS4. Covering is appropriate for areas where solids (e.g., gravel, salt, compost, building materials, etc.) or liquids (e.g., oil, gas, tar, etc.) are stored, prepared, or transferred. Coverings shall be permanent in nature and handling procedures must be carried through plans and policies in place at the operating facility.
4.9. Spill Containment and Control
Spill containment within industrial and some commercial sites includes berms, walls, and gates that control spilled material. Berms consist of temporary or permanent curbs or dikes that surround a potential spill site, preventing spilled material from entering surface waters or storm sewer systems. The berm or wall may be made of concrete, earthen material, metal, synthetic liners, or any material that will safely contain the spill. The containment area must have an impermeable floor (asphalt or concrete) or liner so that contamination of groundwater does not occur.
Two methods of berming can be used: 1) containment berming that contains an entire spill, or 2) curbing that routes spill material to a collection basin. Both methods shall be sized to safely contain a spill from the largest storage tank, rail car, tank truck, or other containment device located inside the possible spill area. A collection basin shall be provided to hold stormwater and spills until removal is possible.
6.1 Administration
Except as otherwise provided herein, the Department of Community Development shall administer, implement, and enforce the provisions of this section.
6.2 Prohibitions
The following prohibitions must be adhered to:
- No person shall release or cause to be released into the storm drainage system any discharge that is not composed entirely of uncontaminated stormwater, except as allowed herein. Common stormwater contaminants include trash, yard waste, lawn chemicals, pet waste, wastewater, oil, petroleum products, cleaning products, paint products, hazardous waste, and sediment;
- Any discharge shall be prohibited by this section if the discharge in question has been determined by the coordinator to be a source of pollutants to the storm drainage system;
- The construction, use, maintenance or continued existence of illicit connections to the storm drain system are prohibited. This prohibition expressly includes, without limitation, illicit connections made in the past, regardless of whether the connection was permissible under law or practices applicable or prevailing at the time of connection;
- No person shall connect a line conveying sanitary sewage, domestic sewage, or industrial waste to the storm drainage system, or allow such a connection to continue;
- No person shall maliciously destroy or interfere with BMPs implemented pursuant to this article.
6.3 Exemptions
The following nonstormwater discharges are deemed acceptable and not a violation of this chapter:
- A discharge authorized by an NPDES permit other than the NPDES permit for discharges from the MS4;
- Uncontaminated waterline flushing and other infrequent discharges from potable water sources;
- Infrequent uncontaminated discharge from landscape irrigation or lawn watering;
- Uncontaminated discharge from foundation, footing or crawl space drains, sump pumps, and air conditioning condensation drains;
- Uncontaminated groundwater, including rising groundwater, groundwater infiltration into storm drains, pumped groundwater and springs;
- Diverted stream flows and natural riparian habitat or wetland flows; and
- A discharge or flow of fire protection water that does not contain oil or hazardous substances or materials.
6.4 Requirements Applicable to Certain Dischargers
- Private drainage system maintenance - The owner of any private drainage system shall maintain the system to prevent or reduce the discharge of pollutants. This maintenance shall include, but is not limited to, sediment removal, bank erosion repairs, maintenance of vegetative cover, and removal of debris from pipes and structures.
- Minimization of irrigation runoff - A discharge of irrigation water that is of sufficient quantity to cause a concentrated flow in the storm drainage system is prohibited. Irrigation systems shall be managed to reduce the discharge of water from a site.
- Cleaning of paved surfaces required - The owner of any paved parking lot, street or drive shall clean the pavement as required to prevent the buildup and discharge of pollutants. In addition to any other criminal penalties that may be prescribed by state law, the visible buildup of mechanical fluid, waste materials, sediment or debris is a violation of this ordinance and is subject to the penalty provisions as outlined in Rogers City Code Section 1-5. Paved surfaces shall be cleaned by dry sweeping, wet vacuum sweeping, collection, and treatment of wash water or other methods in compliance with this Manual. This section does not apply to pollutants discharged from construction activities.
- Maintenance of equipment - Any leak or spill related to equipment maintenance in an outdoor, uncovered area shall be contained to prevent the potential release of pollutants. Vehicles, machinery, and equipment must be maintained to reduce leaking fluids.
- Materials storage - In addition to other requirements of this Code, materials shall be stored to prevent the potential release of pollutants. The uncovered, outdoor storage of unsealed containers of hazardous substances is prohibited.
- Pet waste - Pet waste shall be disposed of as solid waste or sanitary sewage in a timely manner in order to prevent discharge to the storm drainage system.
- Pesticides, herbicides and fertilizers - Pesticides, herbicides and fertilizers shall be applied in accordance with manufacturer recommendations and applicable laws. Excessive application shall be avoided.
- Prohibition on use of pesticides and fungicides banned from manufacture - Use of any pesticide, herbicide or fungicide, the manufacture of which has been either voluntarily discontinued or prohibited by the Environmental Protection Agency, or any federal, state, or city regulation is prohibited.
- Open drainage channel maintenance - Every person owning or occupying property through which an open drainage channel passes shall keep and maintain that part of the drainage channel within the property free of trash, debris, excessive vegetation, and other obstacles that would pollute, contaminate, or retard the flow of water through the drainage channel. In addition, the owner or occupant shall maintain existing privately owned structures adjacent to a drainage channel, so that such structures will not become a hazard to the use, function or physical integrity of the drainage channel.
6.5 Release Reporting and Cleanup
Any person responsible for a known or suspected release of materials which are resulting in or may result in illegal discharges to the storm drainage system shall take all necessary steps to ensure the discovery, containment, abatement and cleanup of such release. In the event of such a release of a hazardous material, said person shall comply with all state, federal, and local laws requiring reporting, cleanup, containment, and any other appropriate remedial action in response to the release. In the event of such a release of nonhazardous materials, said person shall notify the Department of Community Development no later than 5:00 p.m. of the next business day.
6.6 Authorization to Adopt and Impose BMPs
The City may adopt and impose requirements identifying the best management practices for any activity, operation, or facility, which may cause a discharge of pollutants to the storm drainage system. Where specific BMPs are required, every person undertaking such activity or operation, or owning or operating such facility shall implement and maintain these BMPs at their own expense.
6.7 Enforcement Personnal Authorized
The following personnel employed by the city/county shall have the power to issue notices of violations and implement other enforcement actions under this division as provided by the City:
- All authorized personnel under the supervision of the Department of Community Development;
- All inspectors and code enforcement officers under the supervision of the director of code enforcement; and
- All county health officers that are authorized representatives of the director of the county health department.
6.8 Right of Entry and Sampling
Whenever the stormwater coordinator has cause to believe that there exists, or potentially exists, in or upon any premises any condition which constitutes a violation of this article, the stormwater coordinator shall have the right to enter the premises at any reasonable time to determine if the discharger is complying with all requirements of this article. In the event that the owner or occupant refuses entry after a request to enter has been made, the City is hereby empowered to seek assistance from a court of competent jurisdiction in obtaining such entry. The Department of Community Development shall have the right to set up on the property of any discharger to the storm drainage system such devices that are necessary to conduct sampling of discharges.
6.9 Enforcement Procedures
This policy establishes a formal enforcement procedure to be followed by the City stormwater coordinator when enforcement action is necessary on sites that do not comply with the City's codes. Enforcement cases can be generated in any of three ways: through the construction review process; through complaints from individuals, groups, etc.; and through referrals from city/state agencies. Procedures to be followed for each of these methods are outlined in this section.
- Construction review - Every effort is made to use the construction review process to correct deficiencies in site compliance whenever possible. Should that process fail to achieve expected results or if the site reviewer feels that a violation is serious enough to warrant enforcement action, the following procedures shall be followed:
- Issuance of notice of violation - If site deficiencies are noted, the owner/developer or authorized agent shall be given a notice of violation. The notice of violation shall be specific as to the noted violation, corrective measures to be taken, and time frame allowed to complete the work.
- Compliance review - At the end of the time period specified above, a follow-up site inspection shall take place to determine whether compliance has been achieved. Depending on that determination, the following actions may occur:
- If all previous site violations have been corrected, the site reviewer shall issue an inspection report stating that fact and the site shall be returned to a normal construction review status.
- If previously noted violations have not been satisfactorily corrected, the further actions may be initiated.
- Submissions from the general public - Members of the general public may submit information pertaining to this article to the Department of Community Development. The stormwater coordinator will consider such submissions as they pertain to the implementation and enforcement of this article and will provide written or verbal response to the person submitting the information.
- Referrals from other agencies - Referrals from other agencies will be handled in the following manner:
- Cases will be referred directly to the stormwater coordinator. At this point the stormwater coordinator will determine if enforcement actions are warranted and if proper documentation has been obtained. If the stormwater coordinator determines that action is required, the enforcement process will be set into motion.
- Cases received by the stormwater coordinator will be handled on a first come, first served basis. All enforcement actions will be initiated by a site inspection to verify site conditions that caused the case to be referred. If conditions have been corrected or do not exist as stated in the referral, the case will be returned to file for documentation and reporting purposes. If conditions exist as stated in the referral, enforcement actions will proceed.
- Once site conditions have been verified and the site is determined to be in a state of noncompliance two avenues of enforcement can be pursued, one for the infrequent offender and one for the frequent offender.
- If an individual or company is being reviewed by the stormwater coordinator for the first time or it has been at least three years since the last violation (36 months has elapsed since last review), a notice to comply will be issued to the owner/developer informing them they are not in compliance with the City's codes, the steps needed to be taken to get into compliance, and that they have an established time frame to complete the work. At the end of the period the stormwater coordinator will reinspect to check for compliance. If all work has been satisfactorily completed the case will be returned to file for documentation and reporting purposes. If the work has not been satisfactorily completed within the established time frame a citation (ticket) will be issued to the owner/developer and follow-up will be done until the site is brought into compliance.
- If an individual or company has been reviewed by the stormwater coordinator at any time in the preceding 36 months they will be considered repeat offenders. Repeat offenders will be issued a citation (ticket) by the stormwater coordinator upon verification of noncompliance with the City's codes and after consulting with the Department of Community Development. Follow up will continue until the site has been brought into compliance.
- Enforcement options for failure to comply are as follows:
- The City stormwater coordinator in conjunction with the Department of Community Development may issue a stop work order to any persons violating any provision of this article by ordering that all site work stop except that necessary to comply with any administrative order.
- The City stormwater coordinator may request that the Department of Community Development or building inspections office refrain from issuing any further building or grading permits until outstanding violations have been remedied.
- The city stormwater coordinator may initiate penalties as stipulated herein. Complete information concerning enforcement and penalties is described below.
- Action without prior notice - Any person who violates a prohibition or fails to meet a requirement of this article will be subject, without prior notice, to one or more of the enforcement actions, when attempts to contact the person have failed and the enforcement actions are necessary to stop an actual or threatened discharge which presents or may present imminent danger to the environment, or to the health or welfare of persons, or to the storm drainage system.
- Enforcement actions are as follows:
- Recovery of costs - Within 30 days after abatement by City representatives, the Department of Community Development shall notify the property owner of the costs of abatement, including administrative costs, and the deadline for payment. The property owner may protest the assessment before the City Council. The written protest must be received by the Mayor's office within 15 days of the date of the notification. A hearing on the matter will be scheduled before the City Council. The decision of the City Council shall be final. If the amount due is not paid within the protest period or within ten days of the decision of the City Council, the charges shall become a special assessment against the property and shall constitute a lien on the property for the amount of the assessment. A copy of the resolution shall be turned over to the county clerk so that the clerk may enter the amounts of the assessment against the parcel as it appears on the current assessment roll, and the treasurer shall include the amount of the assessment on the bill for taxes levied against the parcel of land.
- Termination of utility services - If the Department of Community Development determines that the disconnection of utility services will remedy or mitigate a violation of this article that poses a public health hazard or environmental hazard, they shall notify Rogers Water Utilities and request the disconnection of city water, sanitary sewer, and/or sanitation services.
- Performance bonds - Where necessary for the reasonable implementation of this article, the Department of Community Development may, by written notice, order any owner of a construction site or subdivision development to file a satisfactory bond, payable to the City, in a sum not to exceed a value determined by the Department of Community Development to be necessary to achieve consistent compliance with this article. The City may deny approval of any building permit, subdivision plat, site development plan, or any other city permit or approval necessary to commence or continue construction or to assume occupancy, until such a performance bond has been filed. The owner may protest the amount of the performance bond before the City Council. The written protest must be received by the Mayor's office within 15 days of the date of the notification. A hearing on the matter will be scheduled before the City Council. The decision of the City Council shall be final.
- Criminal prosecution - Any person who violates or continues to violate a prohibition or requirement of this article shall be subject to criminal prosecution to the fullest extent of the law, and shall be subject to criminal penalties.
- Non-compliance with any provision of this article shall be deemed a violation. Any person violating this code shall, upon an adjudication of guilt or a plea of no contest, be fined according to the schedule of fines. Each separate day on which a violation is committed or continues shall constitute a separate offense.
- Notwithstanding any other remedies or procedures available to the City, if any person discharges into the storm drainage system in a manner that is contrary to the provisions of this code, the senior staff attorney may commence an action for appropriate legal and equitable relief including damages and costs in any court of competent jurisdiction. The senior staff attorney may seek a preliminary or permanent injunction or both which restrains or compels the activities on the part of the discharger.
1. Objectives
Primary objectives of the CSKRegulationsand this chapter include:
- Provide additional protection for the Cave Springs Recharge Area through the use of stream buffers, runoff reduction practices, filtration, source controls, construction practices and control measures, wastewater policies and practices, requirements for buried facilities that are potential contaminant sources, and spill prevention and control practices to protect the quality of water entering the groundwater system.
- Reduce the rate at which surface water is entering the shallow groundwater system that sustains the cavefish through disconnection of impervious area, detention and filtration.
- Provide a reasonable and practical framework for water quality protection that recognizes risk and vulnerabilities and how site-specific circumstances and mitigating factors including stormwater control measures/BMPs must be taken into account, building upon the technical foundation and recommendations made by OUL and The Nature Conservancy.
- Develop practical criteria and methods to enhance treatment of detained runoff in the Direct Recharge Area that will allow for development of the area in a responsible manner that protects water quality through implementation of BMPs.
2. Geographic Extent & Characteristics of Recharge Area
Exhibit 10-2 of the CSK Regulations illustrates the geographic extent of the Direct Recharge Area. Municipal boundaries of the Cities of Cave Springs, Rogers, Lowell, and Springdale are shown on Exhibit 10-1. In addition, Exhibit 10-2 illustrates the following key features of the Recharge Area:
- Losing Streams –These reaches were identified through hydrogeologic analysis and tracer studies by OUL (OUL 2015). Note that not all reaches of streams are identified as losing streams – upper reaches of some streams further east and north of Cave Springs are not identified as losing reaches.
- Cave Springs Groundwater Trough – The trough extends east from Cave Springs and is an area of rapid groundwater recharge and generally poor to fair soil treatment capability. The trough encompasses an area of approximately 1.8 square miles and is an area of heightened vulnerability for the karst system.
- Soil Treatment Capability – These ratings are based on soil gradation and infiltration characteristics. In general, soils with more rapid infiltration have lower treatment capability and higher potential for direct recharge to the karst system. Soils are classified as follows:
- Good Treatment Capability Soils - The major soil series in this group are Captina and Peridge. Captina and Peridge Series soils are in this group because they have a high percent of material that will pass through a Number 4 sieve (particle size less than 4.76 millimeters). These are loamy materials, excluding gravels and coarse materials that provide less filtration, and provide good natural cleansing. When constructing stormwater detention basins the upper horizons of these soils can be stockpiled and amended to create a media filtration layer to blanket the bottom of detention ponds to enhance contaminant removal.
- Fair Treatment Capability Soils - Major soil series that are in this group are the Nixa and Tonti soil series. Nixa soils are in this group because they have a relatively low percentage of material that will pass through a Number 4 sieve and because they have a fragipan typically located 17 to 30 inches below the surface. If undisturbed, soils above the fragipan become saturated during wet-weather conditions and appreciable lateral flow often occurs along preferential flow routes toward discrete recharge zones where the fragipan is breached or where other soil series lacking a fragipan exist. If the fragipan is breached in constructing stormwater detention ponds the low percentage of material that will pass through a Number 4 sieve and the moderate permeability of the soils above and below the fragipan provide ineffective natural cleansing for passing waters. Tonti Series soils are in this group because they have more fine textured material in their upper horizons than the Poor Treatment Capability Soils. However, below a depth of about a foot and a half the Tonti Series soils have characteristics similar to Poor Treatment Capability Soils.
- Poor Treatment Capability Soils - The major soil series in this group is the Noark soil series. These soils are classified as poor for treatment capability because they have high percolation rates and a relatively low percentage of material that will pass through a Number 4 sieve. The texture is too coarse to provide much of the natural cleansing present in soils.
- I-49 Corridor – The I-49 corridor lies in the southwestern portion of the Indirect Recharge Area. ARDOT and the USFWS have developed a plan for BMPs along this corridor that includes lined ponds and other practices. Because BMPs have already been developed for this area, this area is not addressed in the chapter.
Implementation of BMPs in accordance with the Drainage Criteria Manual is required throughout the Direct and Indirect Recharge Area. Conservation Regulations and criteria in this chapter, which provide for buffers and enhanced treatment methods, are required only in the Direct Recharge Area.
2. Risk-based Water Quality Protection Zones
Exhibit 10-2 of the CSK Regulations provides mapping of risk-based water quality protection zones for the Cave Springs Recharge Area. Zones are color-coded by the zone designations 1-4:
Zone 1 (Extremely High Vulnerability) represents the highest risk to the water quality and hydrology of the groundwater system. These are lands where the hydrobiological setting and existing and/or foreseeable land uses pose extremely high risks of groundwater impacts that could potentially adversely affect Ozark Cavefish and the associated biological community. Zone 1 includes areas that are mapped for:
- Poor soil treatment capability - highly permeable or karst soils at shallow depths that directly and rapidly recharge the groundwater system.
- Proximity to losing stream corridors and other sensitive features - areas within a zone of high vulnerability from losing streams (measured from center of stream), or other known direct/high- permeability recharge areas included in Zone 1.
- Areas within the Cave Springs Groundwater Trough are included in Zone 1.
Zone 2 (High Vulnerability) is an area that has a high risk to water quality of the groundwater system. These are lands where the hydrobiological setting and existing and/or foreseeable land uses pose high risks of groundwater impacts with potential to adversely affect Ozark Cavefish and the associated biological community. This area has some overlying soils that can provide filtration of stormwater; however, excavations for development projects, including utilities, building foundations, detention and water quality ponds have the potential to penetrate to highly permeable or karst layers.
Zone 3 (Moderate Vulnerability) is an area with moderate risk to the groundwater system water quality based on native soils that have good potential for filtration, greater thickness of overlying soil layers, and greater distance from sensitive features. These are lands where the hydrobiological setting and existing and/or foreseeable land uses pose moderate risks of groundwater impacts likely to adversely affect the Ozark Cavefish and the associated biological community. Within the Direct Recharge Area these are typically upland areas underlain by soils capable of removing many contaminants. They are remote from sinkholes or losing streams and are areas where land use does not include localized groundwater contamination hazards, such as suburban development utilizing on-site disposal of sewage or concentrated or confined animal operations (including poultry).
Zone 4 (Low Vulnerability, Indirect Recharge Area) is an area of relatively low risk to the groundwater system. These are areas that contribute relatively minor amounts of water to the groundwater system recharging Cave Springs cave and are unlikely to have significant deleterious impacts on water quality and cave fauna. Chapter 9 of the Drainage Criteria Manual is applicable to Zone 4. The I-49 corridor is a part of Zone 4. The existence of I-49 poses greater groundwater quality vulnerability than the Indirect Recharge Area lands located further to the east. Because ARDOT and USFWS have developed approved plans for BMPs for the corridor, the area is included in Zone 4.
For an amendment to the vulnerability zone designation, a property owner may apply to change the vulnerability zone designation from vulnerability zone 2 or zone 3 to vulnerability zone 3 or zone 4 pursuant to the procedures and review criteria set forth herein.
The application for an amendment to the vulnerability zone designation shall include the following minimum information:
- A site map or diagram depicting the following features:
- Delineation of inner buffer and outer buffer as determined by these CSK regulations.
- Slope study map that indicates the areas of less than three percent grade and areas of three percent or greater grade in the inner buffer and outer buffer areas.
- Areas of erosive soils.
- Areas with poor vegetative cover and areas of existing erosion.
- Unstable stream reaches.
- Storage areas for hazardous materials, fertilizers, or pesticides.
- Wetlands and waterbodies.
- Sanitary wastewater collection, storage, treatment, pumping facilities.
- A map or diagram separately depicting the boundaries of the Cave Springs groundwater trough, the boundaries of zone 1, zone 2, and zone 3 vulnerability areas, depicting the boundary of losing streams, and depicting the boundary of losing streams as defined on the Cave Springs direct recharge area vulnerability zone map as it affects the proposed development site.
- A detailed analysis that accurately depicts the soil and hydrogeological conditions on the subject property.
- The Director of the Department of Community Development or his or her designee or review authority may request additional information, studies, or peer review as deemed appropriate and relevant to providing sufficient information to evaluate the application for compliance with the applicable review criteria.
- The burden of proof shall be on the applicant to demonstrate that the existing vulnerability zone designation is not appropriate and that a new vulnerability zone designation is clearly warranted.
The Planning Commission shall review and make a recommendation and the City Council shall review and take final action to approve or disapprove an application to change the vulnerability zone designation on the subject property.
The review authority shall use the following review criteria as the basis for a decision on an application to change the vulnerability zone designation:
- The application clearly demonstrates and provides convincing evidence that the soil and hydrogeologic conditions on the entire subject property warrant inclusion in the requested vulnerability zone district; and
- The change of vulnerability zone district designation will not create a non-uniform or haphazard vulnerability zone district map, or result in vulnerability zone designations that split a property that will complicate administration and implementation of these CSK regulations on a property by property basis
1. Inner Restrictive Buffers
Inner restrictive buffers are generally “no development” zones. Planning for development should seek to preserve these areas and minimize impacts from utilities, roads and other features that must cross or encroach on the buffer area. Inner buffer widths vary by zone from 100 feet in the Extremely High Vulnerability zone to 50 feet in the High Vulnerability zone to 25 feet in the Moderate Vulnerability zone.
Allowable uses/activities within inner buffers include:
- Utility crossings – Buffer areas should not be viewed as preferred utility corridors but, if necessary, can be used for a development. In some cases utility crossings with enhanced BMPs may be required. When a crossing or encroachment cannot be avoided, it is allowable subject to the Drainage Criteria Manual erosion and sediment control requirements and additional BMPs listed herein. An approved Land Disturbance Permit from the City of Rogers is required prior to construction activities.
- Open space – Open space or park uses with heavy concentrations of animals (dog parks, horse paths, etc.) are not allowed in the inner buffer, but many other open space uses are compatible.
- Trails, biking/hiking paths – Pedestrian paths also provide benefit of maintenance access along stream corridors.
- Herbicide use in native landscaped areas should be as limited as possible within the buffer zone to small spot treatments. No utility corridor spraying is allowed. Herbicides must not be used when there is ponded or flowing water on the surface, all labeled instructions must be followed.
- Road and bridge crossings constructed in accordance with applicable water quality regulations – the number of crossings should be minimized to the extent practical through land planning.
- Wetland mitigation and stream stabilization/restoration projects.
- Projects to enhance or restore functions of the buffer or stream. Buffer restoration is one of the factors that can be used to reduce the width of the outer buffer.
- Stormwater BMPs that cannot feasibly be located in the outer buffer or that must be located in the inner buffer to achieve desired functions.
- Maintenance activities associated with these allowable uses.
- Uses and activities that are determined by the Director of the Department of Community Development or his or her designee to be similar to the uses and activities described above.
Prohibited and restricted use/activities within inner buffers include:
- Grading, stripping, or other soil-disturbing practices should be minimized to the extent practical.
- Filling or dumping or storage of material not related to a permitted use or activity.
- Draining the buffer area by ditching, underdrains, or other systems, or any grading or excavation work which has the effect of draining that buffer area which is not related to a permitted use or activity.
- Use, storage, or application of pesticides, herbicides (except as permitted), fertilizers, or hazardous/toxic materials.
- Fueling facilities and bulk storage of fuel or petroleum products above or below ground.
- Storage, repair, or operation of motorized vehicles other than for maintenance or emergency use.
- Structures or impervious surfaces, with the case-by-case exception of paved trails (preferred for maintenance) and associated facilities such as picnic tables/sitting areas subject to the requirements of a Land Disturbance Permit.
- Land application of biosolids.
- Other activities or land uses that are determined by the Director of the Department of Community Development or his or her designee to pose an unacceptable risk to water quality of the receiving waters and cave system.
2. Outer Variable-width Buffer
The outer variable-width buffer (outer buffer) is in addition to the inner buffer. The outer buffer can be reduced, as described below, to a minimum width for each zone. Inner and/or outer buffers are not required for Zone 4. The outer buffer, with a maximum width of 300 feet in Zone 1 (inclusive of restrictive inner buffer), is intended to encompass sensitive site features including high-permeability recharge areas, karst features, losing streams, and areas that have high potential to contribute to contaminant loading. Areas within the outer buffer that pose high risks to water quality including erodible soils, areas of erosion/poor vegetative cover, steep slopes, existing areas of hazardous material, or waste storage shall be mapped. To the extent that these or other known risk factors to water quality exist outside of the outer buffer on a site, these areas must be mapped by the applicant as a part of the Land Disturbance Permit Application, and BMPs must be provided to mitigate potential water quality impacts.
Allowable activities and land uses in the outer buffer are the same as those allowed in the inner buffer and also include BMPs associated with a project that provide similar functions to the buffer or enhance functions of the buffer. Additional land uses, including those that consist of mostly pervious areas, can be incorporated within the buffer, depending on site-specific conditions, BMPs, and other factors that justify reductions in the maximum extent of the outer buffer, as determined by an Arkansas-registered Professional Engineer.
The width of the outer buffer may be reduced depending on site-specific conditions, BMPs, and other factors including the following:
- Soil treatment capability
- Land use characteristics
- Losing stream corridors
- Average ground slope
- Buffer zone filtration characteristics
- Stormwater detention and stormwater treatment practices
- Wastewater disposal quantities and quality
- Proximity to Cave Springs Groundwater Trough
BMPs that are designed that provide similar functions to the buffer upon which they encroach in terms of water quality may be used to justify reductions in the outer buffer width. Site-specific conditions, which justify a variance, may be used to support a reduction in the outer buffer width. Restoration activities within degraded buffers to improve function are encouraged and can be used to reduce the overall outer buffer width while stabilizing degraded areas adjacent to streams.
3. Buffer Area Maintenance
Inner buffers are to be maintained in a “natural” condition that promotes dense and diverse vegetation. Periodic maintenance may involve removing fallen trees, repairing areas of erosion, weed control and vegetation management. A “manicured” turf appearance is generally undesirable in the inner buffer and landscaping and maintenance practices such as less frequent mowing can help to discourage foot traffic and other urban/suburban activities in this area.
The outer buffer may be used for a broader set of activities than the inner buffer, and maintenance should be performed to keep a dense vegetated cover. Typical activities include mowing, weed control, clearing of debris/fallen trees, spot revegetation, and aeration.
Inner and outer buffer areas should be maintained in accordance with BMP SC-10 Vegetative Buffers in Chapter 9. Given the extent of buffers used in the Direct Recharge Area it will generally only be necessary to perform sediment removal in portions of buffers adjacent to disturbed and/or developed areas. Areas should be revegetated to match adjacent buffer areas following sediment removal.
1. Non-Structural BMPs
Non-structural source control BMPs are required in all zones and are important for keeping sources of pollution from getting into the karst system. Education on source control BMPs is key to ensuring that BMPs are implemented and that the public is aware of the water quality concerns with practices such as petroleum and chemical storage, etc. Preservation of buffers is one of the most effective non-structural BMPs and is a major component of the water quality protection strategy for the Cave Springs Recharge Area. Chapters 8 and 9 of the Drainage Criteria Manual provide guidance on many non-structural practices that are applicable to the Direct Recharge Area. The following lists additional requirements related to selected practices:
- BMP CM-1 Construction Sequencing and Phasing – The Land Disturbance Permit Application and Report should describe how disturbances within buffer areas are minimized or avoided. Disturbances in buffer areas should be promptly revegetated and mulched to provide cover. Phasing is limited to 20 acres of disturbance in Zone 1 and 40 acres of disturbance in Zone 2.
- BMP CM-2 Hazardous Waste Management and Chemical Storage – All requirements of CM-2 apply both to construction and post-construction activities involving hazardous wastes and chemical storage. In addition, storage of hazardous materials and chemicals that are potential contaminants is not allowed within the inner or outer buffer areas. These requirements apply to construction activities as well as the long-term use of the site.
- BMP CM-3 Solid Waste Management – Solid and liquid wastes should not be stored within buffer areas and areas/containers for liquid waste disposal should be watertight and covered. For commercial, industrial and office sites, waste storage areas and other activities that generate waste should be located on a portion of the site outside of the buffer area.
- BMP CM-4 Concrete Washouts – Concrete washouts are not allowed in buffer areas. Concrete washouts should be avoided in Zone 1 to the extent practical, and those installed in Zones 1 and 2 should be lined with a 30-mil plastic liner. A 10-mil liner may be used in Zone 3.
- BMP CM-5 Construction Staging and Access – Construction staging is not allowed in buffer areas and access to buffer areas where work is occurring should occur at limited, controlled access points. Vehicle maintenance and fueling must occur outside of buffer areas.
In general, land uses requiring Spill Prevention, Containment, and Control (SPCC) Plans (SPCC Regulations in Title 40 Code of Federal Regulation Part 112) for bulk storage of fuel or other sites for storage of waste (junkyards, landfills, transfer stations, etc.) are not allowed in the Direct Recharge Area. To the extent that a project is proposed requiring creation or modification of a SPCC Plan within the Recharge Area, the City will review the SPCC Plan and may add requirements as appropriate for protection of the karst groundwater system.
2. Construction BMPs
Construction BMPs in Chapter 8 of the Drainage Criteria Manual apply throughout the Cave Springs Recharge Area. In the Direct Recharge Area, special care should be taken with construction BMPs because of the adverse affects of sediment and turbidity in discharges to karst areas. The BMPs identified in Section 4.1 Working in or Crossing a Waterway should be followed for any construction activities within the inner buffer, including work on utilities, roads and bridges.
The following requirements apply in addition to the criteria in Chapter 8:
- Disturbances in inner and outer buffer areas should be minimized to the extent practical.
- Topsoil and soil that is rated as having “good” treatment capability must be segregated and stockpiled for use in revegetation and/or as a primary component of the filtration media mix for enhanced treatment in detention facilities.
- Redundant perimeter controls are required between areas of disturbance and designated undisturbed buffer areas (double row of silt fence, double row of wattle, berm and wattles, etc.) in Zones 1 and 2.
- Construction should be phased to limit the maximum area of disturbance at a given time to 20 acres in Zone 1 and 40 acres in Zone 2.
- If a karst feature (spring, sinkhole or other direct recharge feature associated with karst hydrology) is encountered during construction, construction in the vicinity should be halted and the area protected with redundant perimeter controls. An Arkansas-registered Professional Geologist or Engineer should evaluate to recommend design modifications to limit impacts and direct recharge of runoff.
- Construction dewatering discharges must receive treatment prior to discharge to buffer areas. Treatment methods including filter bags, sedimentation basins and/or sheet flow/infiltration are required upgradient of buffer areas. Criteria in Chapter 8 BMP CM6 Construction Dewatering Dischargesapply.
3. Structural BMPs (post-construction)
The minimum requirements applicable to all zones are those in Chapter 9 of the Drainage Criteria Manual. These BMPs include runoff reduction measures, providing the water quality capture volume (WQCV), implementing source controls, and stabilizing drainageways. Additional requirements apply in Zones 1, 2, and 3.
4. Retention/Containment Standards for Highway Runoff
Future state and/or federal highway projects within the Cave Springs Direct Recharge Area must provide BMP treatment systems comparable to or exceeding the system that has been approved for the I-49 corridor. These systems may include lined ponds, filtration practices and other BMPs.
1. Pressure and Gravity Sewer Lines
The need for a gravity sewer collection system is paramount in the City of Cave Springs especially, but also in the City of Lowell as it relates to vulnerability of the Direct Recharge Area groundwater quality. Based on data from the Northwest Arkansas Conservation Authority (NACA) studies and rough sewer interceptor plans, preliminary cost to bring a 24” interceptor from NACA to the Osage Creek crossing of Highway 264 just west of Cave Springs involves 25,800 linear feet at $350+ per linear foot or $9,000,000±. Several million dollars more will be required to tie in existing subdivisions currently using pumped effluent systems. STEPP systems should be avoided. Meanwhile, recommended policy for sewer service in new subdivisions will be to require gravity sewer systems to each lot with a “drainage basin” type lift station installed to collect sewage that when gravity sewer is available would provide one point for connection to said new gravity sewer.
With exception of service lines, all public and privately maintained pressure and gravity sewer lines located within 300 feet of a losing stream, anywhere in Zone 1 or the Cave Springs Groundwater Trough, must meet all criteria and design standards of the Cities of Rogers or Springdale (which are based on the Ten State Standards) and Cave Springs pumped effluent systems until a gravity sewer system is available. As shown in Exhibit 10-5, these sewer lines must be constructed using geomembranes installed in the bottom of the sewer trench under the pipe bedding up the sides of the trench to 12” above the top of the pipe. Trench dams shall be installed at 400’+/- intervals and at mainline branches. These trench dams shall extend 6” into undisturbed soil on the bottom and sides of the trench and must extend to within 12” of finished grade. Trench dams may be composed of bentonite clay, flowable concrete fill, manufactured anti-seep collars, or other widely accepted materials and methods of practice.
An 8” PVC monitoring well shall be installed on the upstream side of each trench dam from the surface down to the sewer pipe flow line designed to intercept any flow along or immediately beneath the sewer pipe. Each monitoring well shall be sampled annually for dye that will be introduced into the upstream sewer main to check for sewer leakage. As an alternative to dye tracing, the utility owner may implement a monitoring program to test annual samples for the presence of wastewater by commonly accepted laboratory practice or implement an annual inspection program capable of detecting defects and exfiltration points in sewer mains.
All pressure and gravity sewers in Zones 1, 2, 3 & 4 must meet all criteria and design standards of Rogers or Springdale Water Utilities.
2. Sewage Lift Stations
All wastewater lift stations shall be equipped with two or more pumps such that the wastewater lift station is capable of pumping the total rated capacity with one pump out of service.
A control system with remote transmission of data or equivalent shall be implemented at wastewater lift stations. Graphical display screens shall show, and the control system shall be capable of transmitting, the instantaneous station discharge, wet well water level, pump run times, pump starts, pump status (such as running, off, or alarm conditions), power status, and standby generator status. Wastewater lift station alarm systems shall transmit and identify alarm conditions to a municipal facility that is staffed 24 hours a day. If such a facility is not available, the alarm shall be transmitted to municipal offices during normal working hours and to the home of the responsible person(s) in charge of the lift station during off- duty hours. The control system and communication method shall be coordinated with the local municipal agency for integration with their SCADA system and operational procedures.
Fuel or gas standby generators with appropriate fuel storage containers, or an approved alternative secondary power supply, shall be provided as a backup power source for wastewater lift stations. In the event of a power failure, the redundant power system shall automatically operate the wastewater lift station, shall have sufficient capacity to start up and maintain the total rated running capacity of the station. A portable pump connection to the force main with rapid connection capabilities and appropriate valving shall be provided outside the dry well and wet well, similar to Exhibit 10-6.
1. Industrial & Commercial Contaminant Sources
Industrial and commercial land uses are not allowable in Zones 1 or 2 of the Direct Recharge Area per zoning without a variance, and discharges requiring permitting under DEQ industrial stormwater and/or wastewater discharge permits are prohibited in these zones. Under special circumstances, these types of land uses may be allowed when there is not a feasible location outside of Zone 1 or Zone 2; however, this would require a special Land Disturbance Permit review process to identify BMPs that would adequately protect water quality given the nature of the discharge and the proximity to direct recharge areas. In cases where a variance is allowed the applicant must demonstrate that, with BMPs, the proposed land use will pose no higher risk to water quality than permitted land uses.
For commercial and industrial land uses or other land uses requiring a permit from DEQ and/or a federal agency in Zone 3, the requirements of Chapter 9 and this chapter apply. Any potential stormwater, wastewater, SPCC or other plans and associated permits must be submitted as a part of the Land Disturbance Permit Application.
2. Bulk Storage of Fuel and Hazardous Materials
Bulk storage of fuel and other hazardous materials is discouraged in the Direct Recharge Area because of the threat that spill and leaks pose to groundwater quality. Bulk storage of fuel and similar substances must comply with SPCC regulations and hazardous materials and waste must be managed in accordance with the Resource Conservation and Recovery Act (RCRA).
The following additional restrictions apply:
- Underground storage tanks are prohibited in Zones 1 and 2.
- Aboveground storage of bulk fuel or other hazardous materials is also prohibited in Zones 1 and 2.
- Underground storage tanks are allowed in Zone 3; however, any such underground storage tanks must have secondary containment.
- Aboveground storage of bulk fuel or other hazardous material is allowed in Zone 3 with appropriate secondary containment, spill prevention, control and countermeasure BMPs and appropriate federal, state and local regulations.
1.1 Plan Sheets
The plan sheets for improvements shall be submitted on 22”x34” sheets with all sheets in a plan set being the same size. Plan drawings shall be of an appropriate scale to be legible; the suggested scale is typically 1”=100’. Legibility will be determined by the City’s engineer or planning staff. Profile drawings shall be provided for all storm sewers and drainage ditches at a suggested scale of 1”=20’ horizontal and 1”=5’ (minimum) vertical.
Plan sheets shall conform to generally accepted engineering practices; special conditions may require additional information.
1.1.1 Title Sheet
The title sheet shall include:
- Project name, nature of the project, city and state.
- Index of sheets.
- A location or vicinity map showing the project in relation to existing streets, railroads and physical features. The location map shall have a north arrow and appropriate scale.
- A project control benchmark identified and referenced to the City of Rogers GPS control monuments.
- The name and address of the owner of the project and the engineer preparing the plans.
- Engineer’s seal, signature and date.
1.1.2 Layout Sheets
In general, layout sheets shall contain to the following:
- North arrow and scale.
- Legend of symbols.
- Name of project.
- Boundary line or project area.
- Location and description of existing major drainage facilities within or adjacent to the project area.
- Location of proposed drainage facilities, including cross sections or reference to detail sheets.
- Location and description of utilities within or adjacent to the project area.
- Provide match lines if more than one sheet is necessary.
- The date, registration seal and signature of the Engineer of Record.
- Elevations shown in the plans shall be based on City of Rogers GPS control monuments.
- The top of each page shall be either north or west. The stationing of street plans and profiles shall be from left to right and downstream to upstream for channels.
- Show topography a minimum of 20’ beyond the project area; 50’ for channel improvements.
- Show existing and proposed property and easement lines with dimensions.
- Minimum finish floor elevations shall be shown a minimum of 3-feet above the 100-year water surface elevation on each lot when located in a designated floodplain, areas adjacent to a designated floodplain and in areas where flooding is known to occur. All occupied buildings, whether in or out of a designated floodplain shall have the finished floor elevation a minimum of 12-inches above the land immediately surrounding the building and all buildings in a subdivision are required to be have the finish floor 12” above the curb per the Subdivision Ordinance.
- Include current City of Rogers Standard Details as needed.
Table SWP-1 – Incentives to Preserve Floodplains during Rezoning and/or LSDP
Incentives (to be used at City’s discretion) | Description/Incentive Criteria |
|---|---|
1. City takes deed of undeveloped floodplain… |
|
2. Reduction in greenspace requirements… | |
Commercial area | 1.00% reduction in greenspace requirement per every 1-acre of floodplain preserved not to exceed 10%. |
3. Increase in allowable densities… | |
Residential area | 1/2-unit per acre of floodplain preserved. |
4. Reduction in required road improvements… | |
Residential area | 26-ft (Back-to-Back curb) typical section allowed |
Commercial area | Suggestions/requests to be reviewed on a case by case basis |
3.3.1 Floodplain Management Goals
There are two major goals with respect to floodplain management:
Floodplain Management Goal 1 - Reduce the vulnerability of the residents in the City of Rogers to the danger and damage of floods.
Floodplain Management Goal 2 - Preserve and enhance the natural characteristics of the City’s floodplains.
These two goals are achievable through appropriate management shared by the agencies involved. A multi-pronged approach to achieve the floodplain management goals described above is summarized below:
- Adopt effective floodplain regulations.
- Appropriately modify local land use practices, programs, and regulations in flood-prone areas.
- Provide a balanced program of measures to reduce losses from flooding.
- Foster the preservation and/or creation of greenbelts, with associated wildlife and other ecological benefits, in urban areas.
Floodplain management practices must be implemented to be of value. Although hydrologic data are critical to the development of a floodplain management program, the program is largely dependent on a series of policy, planning, and design decisions.
3.3.2 National Flood Insurance Program
Flood insurance should be an integral part of a strategy to manage flood losses. The City is a participant in the National Flood Insurance Program (NFIP), which is administered by the Federal Emergency Management Agency (FEMA). As a participant, the City must maintain and enforce regulations meeting minimum requirements of the NFIP and restricting development in designated flood hazard areas shown on FEMA Flood Insurance Rate Maps (FIRMs). Federal requirements mandate that flood insurance be purchased for mortgaged properties within a FEMA flood hazard area. Because the City is an NFIP participant in good standing, all property owners in the City are able to obtain flood insurance for their property with premiums based on the flood hazard zones shown on the FIRM. For additional information related to flood hazard zones, refer to the City of Rogers Code of Ordinances Chapter 22 FLOODS(http://library.municode.com/).
3.3.3 Floodplain Filling
While floodplain management includes some utilization of the flood fringe (i.e., areas outside of the formal floodway), the planner and engineer should proceed cautiously when planning facilities on lands below the expected elevation of the 100-year flood. Flood peaks from urbanized watersheds are high and short-lived, and filling the flood fringe tends to increase downstream peaks. Per Chapter 22 – Floodplain Administration – any fill material introduced within the boundaries of the 100-year flood and below the expected elevation of the 100-year flood will be required to be mitigated with an equal amount of cut somewhere else onsite within the floodplain boundary.
3.3.4 Floodplain Mapping
The following type of maps can be referenced to identify flood-prone areas in the City of Rogers for use in drainage planning. (FEMA) Flood Insurance Rate Maps (FIRM) are an important tool to assist with good floodplain management. The National Flood Insurance Act of 1968 established the National Flood Insurance Program (NFIP), which included a national floodplain mapping effort. Certain areas in the City of Rogers have been designated as floodplains and are regulated as required by the NFIP. While these maps were created to indicate risk factors for determining appropriate flood insurance rate premiums, they are also useful for designating flood prone areas. Anyone considering developing property in the City of Rogers should obtain a copy of the FEMA FIRM panels and understand the effects any floodplain may have on a proposed development. Refer to Map Panel ID No. 05007CIND0A for an Index Map of the FIRM panels in the City of Rogers area (FEMA 2009).
Table RO-1 –– Watershed Size Applicability for Peak Runoff Calculations
Watershed Size (acres) | Applicable Drainage Method |
|---|---|
0 to 30 | Rational Method |
30 to 2000 | SCS Method |
2000 + | Computer models (such as HEC-HMS, TR-20, or equivalent) |
2.5.1 Soil Type
The runoff coefficient, C, in the Rational Formula is also dependent on the character of the surface soil. The type and condition of the soil determines its ability to absorb precipitation. The rate at which a soil absorbs rainfall typically decreases if the rainfall continues for an extended period of time. The soil absorption or infiltration rate during a rainfall event is also influenced by the degree of soil saturation before a rain (antecedent moisture condition), the rainfall intensity, the proximity of ground water, the degree of soil compaction, the porosity of the subsoil, vegetation, ground slopes, and surface topography (or relief). Detailed soil information is described in Section 3.3.1 – Hydrologic Soil Group.
2.5.2 Selection of Runoff Coefficients, C
The runoff coefficient, C, is the variable of the Rational Method which is most difficult to precisely determine. Proper selection requires judgment and experience on the part of the design engineer, and its use in the formula implies a fixed ratio for any given drainage area over the course of a rainfall event, which in reality is not the case. A reasonable runoff coefficient must be chosen in order to determine accurate volumes for runoff.
To standardize City design computations, Table RO-2 provides standard runoff coefficient values based on current zoning and land use designations. However, if the designer chooses, Table RO-3 provides runoff coefficient values for specific types of land/surface areas that can be used to evaluate a composite analysis that may provide a more accurate runoff coefficient value for an area.
Additionally, the values in Table RO-2 and Table RO-3 are typical for design storms with recurrence intervals of 1 to 10 years. For less frequent recurrence intervals (i.e., larger storm events), the runoff coefficient, C, must be adjusted upward using the correction factors shown in Table RO-4 due to saturated soil conditions that typically increase the runoff during larger storm events. Table RO-4 contains correction factors for the 1-, 5-, 10-, 25-, 50-, and 100-year events. To determine the appropriate runoff coefficient for these events, the runoff coefficient from either Table RO-2 or Table RO-3 shall be multiplied by the appropriate factor in Table RO-4.
Table RO-2 –– Runoff Coefficients, C, for Specific City of Rogers Zoning
| Rogers Zoning | Description | Runoff Coefficient, C |
|---|---|---|
| T2 | Agricultural | 0.4 |
| T3.1 | Residential Estate | 0.45 |
| T3.1 | Residential Single Family | 0.55 |
| T3.2;T4.1 | Residential Affordable Housing | 0.6 |
| T3.2;T4.1 | Residential Duplex and Patio Home | 0.65 |
| T4.2;T5.1 | Residential MultiFamily | 0.75 |
| T3.2;T4.1 | Neighborhood Residential | 0.6 |
| T4.2 | Manufactured Home Community | 0.7 |
| T4.2 | Residential Office | 0.8 |
| T5.1 | Office | 0.9 |
| T5.1;T5.2;T6.1 | Highway Commercial | 0.9 |
| T4.2;T5.1 | Neighborhood Commercial | 0.8 |
| HC | Open Display Commercial | 0.9 |
| HC | Warehouse Office | 0.9 |
| I-1 | Light Industrial | 0.9 |
| I-2 | Heavy Industrial | 0.95 |
| Church | 0.8 | |
| School | 0.8 | |
| Park | 0.4 | |
| Cemetery | 0.4 |
Table RO-3 –– Runoff Coefficient, C, for Composite Land/Surface Areas in the City of Rogers (City of Rogers – Drainage Study 1993)
Character of Surface | Description | Runoff Coefficient, C |
|---|---|---|
UNDEVELOPED AREAS | Historic Flow Analysis, Greenbelts, Agricultural, Natural Vegetation | |
Clay Soil | ||
Flat, 2% slopes . . . . . . . . . . . . . . . . . . . . | 0.30 | |
Average, 2 - 7% slopes . . . . . . . . . . . . . . | 0.40 | |
Steep, 7% slopes . . . . . . . . . . . . . . . . . . | 0.50 | |
Sandy Soil | ||
Flat, 2% slopes . . . . . . . . . . . . . . . . . . . . | 0.12 | |
Average, 2 - 7% slopes . . . . . . . . . . . . . . | 0.20 | |
Steep, 7% slopes . . . . . . . . . . . . . . . . . . | 0.30 | |
STREETS | Paved . . . . . . . . . . . . . . . . . . . . . . . . . . . . . . . . | 0.98 |
Gravel . . . . . . . . . . . . . . . . . . . . . . . . . . . . . . . | 0.60 | |
DRIVES & WALKS | 0.98 | |
ROOFS | 0.98 | |
LAWNS | Clay Soil | |
Flat, 2% slopes . . . . . . . . . . . . . . . . . . . . | 0.18 | |
Average, 2 - 7% slopes . . . . . . . . . . . . . . | 0.22 | |
Steep, 7% slopes . . . . . . . . . . . . . . . . . . | 0.35 | |
Sandy Soil | ||
Flat, 2% slopes . . . . . . . . . . . . . . . . . . . . | 0.10 | |
Average, 2 - 7% slopes . . . . . . . . . . . . . . | 0.15 | |
Steep, 7% slopes . . . . . . . . . . . . . . . . . . | 0.20 |
Table RO-4 –– Frequency Factor Multipliers for Runoff Coefficients (Debo and Reese 2002)
Recurrence Interval (years) | Adjustment Multiplier ( ki ) |
|---|---|
1 to 10 | 1.0 |
25 | 1.1 |
50 | 1.2 |
100 | 1.25 |
A convenient tool that complements the City’s Manual is the RDM-Rational Method spreadsheet. The Weighted C tab within this spreadsheet calculates the area-weighted runoff coefficient given the collective areas and corresponding runoff coefficients for subareas within the watershed being analyzed. Refer to Section 4.0 for additional information on using this spreadsheet. All composite analyses shall be completed using the Weighted C spreadsheet and included in the drainage report.
Table RO-5 –– Rainfall Intensity-Duration-Frequency Chart for the City of Rogers, Arkansas
Duration (min) | 1 Year (in/hr) | 2 Year (in/hr) | 5 Year (in/hr) | 10 Year (in/hr) | 25 Year (in/hr) | 50 Year (in/hr) | 100 Year (in/hr) |
|---|---|---|---|---|---|---|---|
5 | 4.88 | 5.54 | 6.58 | 7.34 | 8.46 | 9.35 | 10.22 |
6 | 4.89 | 5.35 | 6.34 | 7.07 | 8.15 | 9.00 | 9.85 |
7 | 4.78 | 5.10 | 6.09 | 6.80 | 7.80 | 8.68 | 9.50 |
8 | 4.63 | 4.92 | 5.85 | 6.54 | 7.52 | 8.34 | 9.14 |
9 | 4.47 | 4.72 | 5.64 | 6.30 | 7.29 | 8.06 | 8.80 |
10 | 4.31 | 4.58 | 5.45 | 6.08 | 7.06 | 7.78 | 8.50 |
11 | 4.15 | 4.41 | 5.28 | 5.88 | 6.78 | 7.50 | 8.25 |
12 | 4.00 | 4.27 | 5.10 | 5.70 | 6.55 | 7.25 | 7.92 |
13 | 3.86 | 4.12 | 4.92 | 5.50 | 6.32 | 7.00 | 7.70 |
14 | 3.72 | 4.00 | 4.78 | 5.34 | 6.15 | 6.81 | 7.45 |
15 | 3.60 | 3.88 | 4.65 | 5.18 | 6.00 | 6.61 | 7.24 |
16 | 3.48 | 3.78 | 4.52 | 5.04 | 5.84 | 6.45 | 7.05 |
17 | 3.37 | 3.67 | 4.38 | 4.91 | 5.69 | 6.30 | 6.90 |
18 | 3.27 | 3.55 | 4.29 | 4.80 | 5.55 | 6.15 | 6.73 |
19 | 3.18 | 3.47 | 4.17 | 4.70 | 5.43 | 6.00 | 6.55 |
20 | 3.09 | 3.38 | 4.06 | 4.59 | 5.32 | 5.88 | 6.43 |
21 | 3.00 | 3.29 | 3.98 | 4.49 | 5.20 | 5.76 | 6.30 |
22 | 2.92 | 3.20 | 3.89 | 4.39 | 5.10 | 5.65 | 6.27 |
23 | 2.85 | 3.13 | 3.80 | 4.30 | 4.98 | 5.52 | 6.08 |
24 | 2.78 | 3.05 | 3.73 | 4.20 | 4.89 | 5.43 | 5.93 |
25 | 2.71 | 2.99 | 3.66 | 4.12 | 4.80 | 5.32 | 5.85 |
26 | 2.65 | 2.93 | 3.58 | 4.06 | 4.72 | 5.24 | 5.75 |
27 | 2.59 | 2.87 | 3.50 | 3.96 | 4.62 | 5.13 | 5.65 |
28 | 2.53 | 2.80 | 3.44 | 3.90 | 4.54 | 5.05 | 5.55 |
29 | 2.47 | 2.73 | 3.37 | 3.83 | 4.47 | 4.97 | 5.46 |
30 | 2.42 | 2.69 | 3.30 | 3.76 | 4.40 | 4.90 | 5.38 |
31 | 2.37 | 2.62 | 3.24 | 3.70 | 4.31 | 4.80 | 5.30 |
32 | 2.32 | 2.58 | 3.19 | 3.64 | 4.25 | 4.74 | 5.20 |
33 | 2.28 | 2.52 | 3.12 | 3.57 | 4.18 | 4.67 | 5.12 |
34 | 2.24 | 2.48 | 3.07 | 3.51 | 4.11 | 4.60 | 5.04 |
35 | 2.19 | 2.42 | 3.02 | 3.46 | 4.06 | 4.51 | 4.98 |
36 | 2.15 | 2.40 | 2.97 | 3.40 | 3.99 | 4.45 | 4.90 |
37 | 2.12 | 2.37 | 2.92 | 3.33 | 3.92 | 4.40 | 4.83 |
38 | 2.08 | 2.30 | 2.89 | 3.28 | 3.87 | 4.33 | 4.78 |
39 | 2.04 | 2.28 | 2.82 | 3.24 | 3.81 | 4.28 | 4.70 |
40 | 2.01 | 2.23 | 2.79 | 3.18 | 3.76 | 4.20 | 4.62 |
41 | 1.98 | 2.20 | 2.75 | 3.13 | 3.70 | 4.15 | 4.58 |
42 | 1.95 | 2.16 | 2.70 | 3.10 | 3.65 | 4.10 | 4.50 |
43 | 1.91 | 2.12 | 2.67 | 3.07 | 3.60 | 4.05 | 4.43 |
44 | 1.89 | 2.10 | 2.63 | 3.01 | 3.56 | 3.97 | 4.40 |
45 | 1.86 | 2.07 | 2.60 | 2.97 | 3.51 | 3.92 | 4.33 |
46 | 1.83 | 2.04 | 2.55 | 2.94 | 3.46 | 3.87 | 4.28 |
47 | 1.80 | 2.00 | 2.52 | 2.90 | 3.42 | 3.82 | 4.22 |
48 | 1.78 | 1.98 | 2.49 | 2.86 | 3.37 | 3.78 | 4.18 |
49 | 1.75 | 1.97 | 2.47 | 2.82 | 3.33 | 3.72 | 4.12 |
50 | 1.73 | 1.96 | 2.42 | 2.79 | 3.29 | 3.69 | 4.08 |
51 | 1.70 | 1.90 | 2.40 | 2.74 | 3.25 | 3.63 | 4.03 |
52 | 1.68 | 1.88 | 2.36 | 2.71 | 3.20 | 3.60 | 3.98 |
53 | 1.66 | 1.86 | 2.33 | 2.69 | 3.17 | 3.55 | 3.92 |
54 | 1.64 | 1.84 | 2.31 | 2.65 | 3.14 | 3.50 | 3.88 |
55 | 1.62 | 1.82 | 2.29 | 2.62 | 3.10 | 3.46 | 3.83 |
56 | 1.60 | 1.80 | 2.26 | 2.59 | 3.06 | 3.44 | 3.80 |
57 | 1.58 | 1.79 | 2.23 | 2.56 | 3.02 | 3.39 | 3.75 |
58 | 1.56 | 1.76 | 2.21 | 2.54 | 2.98 | 3.35 | 3.70 |
59 | 1.54 | 1.74 | 2.19 | 2.50 | 2.96 | 3.30 | 3.67 |
60 | 1.52 | 1.73 | 2.17 | 2.48 | 2.90 | 3.26 | 3.62 |
70 | 1.36 | 1.57 | 1.96 | 2.24 | 2.66 | 2.94 | 3.31 |
80 | 1.24 | 1.45 | 1.84 | 2.07 | 2.43 | 2.71 | 3.08 |
90 | 1.14 | 1.34 | 1.70 | 1.93 | 2.28 | 2.53 | 2.86 |
100 | 1.05 | 1.24 | 1.59 | 1.81 | 2.11 | 2.37 | 2.67 |
110 | 0.98 | 1.19 | 1.49 | 1.70 | 1.98 | 2.22 | 2.49 |
120 | 0.92 | 1.12 | 1.41 | 1.61 | 1.86 | 2.09 | 2.32 |
140 | 0.82 | 1.02 | 1.25 | 1.43 | 1.67 | 1.86 | 2.08 |
160 | 0.74 | 0.90 | 1.14 | 1.29 | 1.50 | 1.68 | 1.89 |
180 | 0.68 | 0.79 | 1.04 | 1.20 | 1.37 | 1.53 | 1.72 |
360 | 0.39 | 0.48 | 0.62 | 0.73 | 0.84 | 0.93 | 1.03 |
720 | 0.24 | 0.29 | 0.37 | 0.44 | 0.50 | 0.56 | 0.62 |
1,440 | 0.14 | 0.17 | 0.22 | 0.25 | 0.29 | 0.33 | 0.36 |
Source: 2-, 5-, 10-, 25-, 50-, 100-Year Design Storm 5-60 min. NOAA HYDRO-35 60-120 min. interpolated 120-1,440 min. Technical Paper No. 40 1-Year Design Storm 5-160 min. calc’d from logarithmic trend line from 5,10,15,30,60,&120-min. T.P.-40 180-,360-,720-, and 1440-min. Technical Paper No. 40 | |||||||
2.8.1 Overland Flow Time, to
Overland flow occurs over plane surfaces. With overland flow, the effective roughness coefficient (Manning’s n value) includes the effect of raindrop impact; drag over the plane surface; obstacles such as litter, crop ridges, and rocks; and erosion and transportation of sediment. Table RO-6 gives Manning’s n values for sheet flow for various surface conditions. These n values are for overland flow depths of approximately 0.1 foot.
The overland flow time, to, may be calculated using Equation RO-3:
(Equation RO-3)
in which:
to = overland flow time (minutes)
n = Manning’s roughness coefficient (Table RO-6)
L = length of overland flow in feet (300-ft maximum in non-urban areas; 100-ft maximum in urban areas)
P2= 2-year, 24-hour rainfall (inches) calculated from Table RO-5 (or obtained from Table RO-9)
S = average basin slope (feet-per-feet) expressed as a decimal
Equation RO-3 is a simplified form of the Manning’s kinematic solution, taken from TR-55(1986), and is based on the following assumptions:
- shallow steady uniform flow
- constant intensity of rainfall excess (that part of a rain event available for runoff)
- rainfall duration of 24 hours, and
- minor effect of infiltration on travel time
Rainfall depth can be calculated from Table RO-5 (and/or can be obtained directly from Table RO-9). Engineering judgment should be used when determining the maximum overland flow distance. For example, in non-urban, gently sloping areas, with ground cover in good condition a maximum overland flow distance of 300-feet can be used. But in urban areas, where more impervious areas exist and ground cover condition is poor a maximum length of 100-feet shall be used. The engineer needs to be aware under what conditions and in what areas overland flow transitions to shallow concentrated or channelized flow when determining the overland flow distance. If the overland flow time is calculated to be in excess of 20 minutes, the designer should check to be sure that the time is reasonable considering the projected ultimate development of the area.
Table RO-6 –– Roughness Coefficients (Manning’s n) for Overland Flow (USDA NRCS – TR-55 1986)
Surface Description | n1 |
|---|---|
Smooth surfaces (concrete, asphalt, | |
gravel, or bare soil) . . . . . . . . | 0.011 |
Fallow (no residue) . . . . . . . . . . . . . | 0.05 |
Cultivated Soils: | |
Residue cover ≤ 20% . . . . . . | 0.06 |
Residue cover > 20% . . . . . . | 0.17 |
Grass: | |
Short grass prairie . . . . . . . . | 0.15 |
Dense grasses 2 . . . . . . . . . | 0.24 |
Bermuda grass . . . . . . . . . . | 0.41 |
Range (natural) . . . . . . . . . . . . . . . | 0.13 |
Woods: 3 | |
Light underbrush . . . . . . . . . | 0.40 |
Dense underbrush . . . . . . . . | 0.80 |
1 The n values are a composite of information compiled by Engman (1986). 2 Includes species such as weeping lovegrass, bluegrass, buffalo grass, blue grama grass, and native grass mixtures. 3 When selecting n, consider cover to a height of about 0.1 ft. This is the only part of the plant cover that will obstruct sheet flow. | |
2.8.2 Shallow Concentrated Flow Time, ts
After a maximum of 300- or 100-feet (depending on non-urban or urban conditions), overland flow usually becomes shallow concentrated flow. The shallow concentrated flow time, ts, may be calculated using Equation RO-4.
Travel time ( ts ) within a watershed is the ratio of flow length to flow velocity:
(Equation RO-4)
in which:
ts= travel time (minutes) for shallow concentrated flow
L = flow length (feet)
V = average velocity (feet per second)
60 = conversion factor from seconds to minutes.
The average velocity for shallow concentrated flow can be determined from Equation RO-5 and Equation RO-6 for paved and unpaved areas, respectively. The average velocity can then be substituted into Equation RO-4 to calculate ts.
(Paved Areas) (Equation RO-5)
and
(Unpaved Areas) (Equation RO-6)
The velocity equations presented above are based on the solution of the Manning’s Equation (Equation RO-8) with different assumptions for n and R for paved and unpaved areas. For unpaved areas, n is 0.05 and R is 0.4; for paved areas, n is 0.025 and R is 0.2 (USDA NRCS – TR-55 1986).
2.8.3 Channelized Flow Time, tt
Channelized flow is that part of the flow path which is neither overland sheet flow, nor shallow concentrated flow. Channelized flow paths may consist of storm sewers, gutters, swales, ditches, or natural drainageways in any combination. The channelized flow time, tt, may be calculated using Equation RO-7.
(Equation RO-7)
in which:
tt = travel time (minutes) for channelized flow
L = flow length (feet)
V = average velocity (feet per second). Refer to Equation RO-8
60 = conversion factor from seconds to minutes.
And where:
(Manning’s Equation) (Equation RO-8)
in which:
V = average velocity (feet per second)
n = Manning’s roughness coefficient
R = hydraulic radius (feet) and is equal to A/Pw
A = cross-sectional flow area (square-feet)
Pw = wetted perimeter (feet)
S = average channel slope (feet-per-feet) expressed as a decimal
Manning’s n values for open channel flow can be obtained from Table RO-7. After average velocity is computed using Equation RO-8, tt for the channel segment can be estimated from Equation RO-7.
Table RO-7 –– Manning's Values of Roughness Coefficient n for Open Channels (Bedient and Huber 2002)
Type of Channel and Description | Minimum | Normal | Maximum | |
|---|---|---|---|---|
Lined or built-up channels | ||||
Concrete, float finish | 0.013 | 0.015 | 0.016 | |
Concrete, concrete bottom | 0.020 | 0.030 | 0.035 | |
Gravel bottom with riprap | 0.023 | 0.033 | 0.036 | |
Brick, glazed | 0.011 | 0.013 | 0.015 | |
Excavated or dredged canal | ||||
Earth, straight and uniform - short grass | 0.022 | 0.027 | 0.033 | |
Earth, winding, sluggish - dense weeds | 0.030 | 0.035 | 0.040 | |
Rock cuts, jagged and irregular | 0.035 | 0.040 | 0.050 | |
Channels not maintained, weeds and brush uncut | 0.050 | 0.080 | 0.120 | |
Natural Streams | ||||
Clean, straight, full stage | 0.025 | 0.030 | 0.033 | |
Clean, winding, some pools and shoals | 0.033 | 0.040 | 0.045 | |
Sluggish reaches, weedy, deep pools | 0.050 | 0.070 | 0.080 | |
Mountain stream steep banks; gravel and cobbles | 0.030 | 0.040 | 0.050 | |
Mountain stream steep banks; cobbles with large | 0.040 | 0.050 | 0.070 | |
Floodplains | ||||
Pasture, no brush, high grass | 0.030 | 0.035 | 0.050 | |
Brush, scattered brush, heavy weeds | 0.035 | 0.050 | 0.070 | |
Brush, medium to dense brush in summer | 0.070 | 0.100 | 0.160 | |
Trees, dense willows, summer, straight | 0.110 | 0.150 | 0.200 | |
Trees, heavy stand of timber | 0.080 | 0.100 | 0.120 | |
2.8.4 Minimum Time of Concentration
In non-urban watersheds, should the calculations result in a tc of less than 10-minutes, a minimum value of 10-minutes shall be used. In urban watersheds, the minimum tc shall not be less than 5-minutes; if calculations indicate a lesser value, use 5-minutes instead.
2.8.5 Common Errors in Calculating Time of Concentration
A common error is to not check the runoff peak resulting from only part of the watershed. In some cases, a lower portion of the watershed or a localized highly impervious area may produce a larger peak flow rate than the entire watershed. In such a case, the time of concentration should be calculated for the smaller area that produces the higher peak flow rate. Failing to recognize this condition will result in calculating a longer time of concentration than is appropriate which results in a lower rainfall intensity value. This error is most often encountered when the watershed is long (and narrow presumably) or the upper portion contains rural parkland areas and the lower portion is developed urban land. Such an error can result in the undersizing of stormwater infrastructure.
Figure RO-1 –– Solution of Runoff Equation (USDA NRCS – TR-55 1986)
Table RO-8 –– Runoff Depths for Selected CNs and Rainfall Amounts (USDA NRCS – TR-55 1986)
Rainfall (P) (inches) | Curve Number (CN 1) | ||||||||||||
|---|---|---|---|---|---|---|---|---|---|---|---|---|---|
40 | 45 | 50 | 55 | 60 | 65 | 70 | 75 | 80 | 85 | 90 | 95 | 98 | |
Inches | |||||||||||||
1.0 | 0.00 | 0.00 | 0.00 | 0.00 | 0.00 | 0.00 | 0.00 | 0.03 | 0.08 | 0.17 | 0.32 | 0.56 | 0.79 |
1.2 | 0.00 | 0.00 | 0.00 | 0.00 | 0.00 | 0.00 | 0.03 | 0.07 | 0.15 | 0.27 | 0.46 | 0.74 | 0.99 |
1.4 | 0.00 | 0.00 | 0.00 | 0.00 | 0.00 | 0.02 | 0.06 | 0.13 | 0.24 | 0.39 | 0.61 | 0.92 | 1.18 |
1.6 | 0.00 | 0.00 | 0.00 | 0.00 | 0.01 | 0.05 | 0.11 | 0.20 | 0.34 | 0.52 | 0.76 | 1.11 | 1.38 |
1.8 | 0.00 | 0.00 | 0.00 | 0.00 | 0.03 | 0.09 | 0.17 | 0.29 | 0.44 | 0.65 | 0.93 | 1.29 | 1.58 |
2.0 | 0.00 | 0.00 | 0.00 | 0.02 | 0.06 | 0.14 | 0.24 | 0.38 | 0.56 | 0.80 | 1.09 | 1.48 | 1.77 |
2.5 | 0.00 | 0.00 | 0.02 | 0.08 | 0.17 | 0.30 | 0.46 | 0.65 | 0.89 | 1.18 | 1.53 | 1.96 | 2.27 |
3.0 | 0.00 | 0.02 | 0.09 | 0.19 | 0.33 | 0.51 | 0.71 | 0.96 | 1.25 | 1.59 | 1.98 | 2.45 | 2.77 |
3.5 | 0.02 | 0.08 | 0.20 | 0.35 | 0.53 | 0.75 | 1.01 | 1.30 | 1.64 | 2.02 | 2.45 | 2.94 | 3.27 |
4.0 | 0.06 | 0.18 | 0.33 | 0.53 | 0.76 | 1.03 | 1.33 | 1.67 | 2.04 | 2.46 | 2.92 | 3.43 | 3.77 |
4.5 | 0.14 | 0.30 | 0.50 | 0.74 | 1.02 | 1.33 | 1.67 | 2.05 | 2.46 | 2.91 | 3.40 | 3.92 | 4.26 |
5.0 | 0.24 | 0.44 | 0.69 | 0.98 | 1.30 | 1.65 | 2.04 | 2.45 | 2.89 | 3.37 | 3.88 | 4.42 | 4.76 |
6.0 | 0.50 | 0.80 | 1.14 | 1.52 | 1.92 | 2.35 | 2.81 | 3.28 | 3.78 | 4.30 | 4.85 | 5.41 | 5.76 |
7.0 | 0.84 | 1.24 | 1.68 | 2.12 | 2.60 | 3.10 | 3.62 | 4.15 | 4.69 | 5.25 | 5.82 | 6.41 | 6.76 |
8.0 | 1.25 | 1.74 | 2.25 | 2.78 | 3.33 | 3.89 | 4.47 | 5.04 | 5.63 | 6.21 | 6.81 | 7.40 | 7.76 |
9.0 | 1.71 | 2.29 | 2.88 | 3.49 | 4.10 | 4.72 | 5.33 | 5.95 | 6.57 | 7.18 | 7.79 | 8.40 | 8.76 |
10.0 | 2.23 | 2.89 | 3.56 | 4.23 | 4.90 | 5.56 | 6.22 | 6.88 | 7.52 | 8.16 | 8.78 | 9.40 | 9.76 |
11.0 | 2.78 | 3.52 | 4.26 | 5.00 | 5.72 | 6.43 | 7.13 | 7.81 | 8.48 | 9.13 | 9.77 | 10.39 | 10.76 |
12.0 | 3.38 | 4.19 | 5.00 | 5.79 | 6.56 | 7.32 | 8.05 | 8.76 | 9.45 | 10.11 | 10.76 | 11.39 | 11.76 |
13.0 | 4.00 | 4.89 | 5.76 | 6.61 | 7.42 | 8.21 | 8.98 | 9.71 | 10.42 | 11.10 | 11.76 | 12.39 | 12.76 |
14.0 | 4.65 | 5.62 | 6.55 | 7.44 | 8.30 | 9.12 | 9.91 | 10.67 | 11.39 | 12.08 | 12.75 | 13.39 | 13.76 |
15.0 | 5.33 | 6.36 | 7.35 | 8.29 | 9.19 | 10.04 | 10.85 | 11.63 | 12.37 | 13.07 | 13.74 | 14.39 | 14.76 |
1 - To obtain runoff depths for CNs and other rainfall amounts not shown in this Table, use arithmetic interpolation. | |||||||||||||
Table RO-9 –– Rainfall Depth-Duration-Frequency Chart for the City of Rogers, Arkansas (Inches)
Duration (min) | 1 Year (in) | 2 Year (in) | 5 Year (in) | 10 Year (in) | 25 Year (in) | 50 Year (in) | 100 Year (in) |
|---|---|---|---|---|---|---|---|
5 | 0.41 | 0.46 | 0.55 | 0.61 | 0.71 | 0.78 | 0.85 |
6 | 0.49 | 0.54 | 0.63 | 0.71 | 0.82 | 0.90 | 0.99 |
7 | 0.56 | 0.60 | 0.71 | 0.79 | 0.91 | 1.01 | 1.11 |
8 | 0.62 | 0.66 | 0.78 | 0.87 | 1.00 | 1.11 | 1.22 |
9 | 0.67 | 0.71 | 0.85 | 0.95 | 1.09 | 1.21 | 1.32 |
10 | 0.72 | 0.76 | 0.91 | 1.01 | 1.18 | 1.30 | 1.42 |
11 | 0.76 | 0.81 | 0.97 | 1.08 | 1.24 | 1.38 | 1.51 |
12 | 0.80 | 0.85 | 1.02 | 1.14 | 1.31 | 1.45 | 1.58 |
13 | 0.84 | 0.89 | 1.07 | 1.19 | 1.37 | 1.52 | 1.67 |
14 | 0.87 | 0.93 | 1.12 | 1.25 | 1.44 | 1.59 | 1.74 |
15 | 0.90 | 0.97 | 1.16 | 1.30 | 1.50 | 1.65 | 1.81 |
16 | 0.93 | 1.01 | 1.21 | 1.34 | 1.56 | 1.72 | 1.88 |
17 | 0.96 | 1.04 | 1.24 | 1.39 | 1.61 | 1.79 | 1.96 |
18 | 0.98 | 1.07 | 1.29 | 1.44 | 1.67 | 1.85 | 2.02 |
19 | 1.01 | 1.10 | 1.32 | 1.49 | 1.72 | 1.90 | 2.07 |
20 | 1.03 | 1.13 | 1.35 | 1.53 | 1.77 | 1.96 | 2.14 |
21 | 1.05 | 1.15 | 1.39 | 1.57 | 1.82 | 2.02 | 2.21 |
22 | 1.07 | 1.17 | 1.43 | 1.61 | 1.87 | 2.07 | 2.30 |
23 | 1.09 | 1.20 | 1.46 | 1.65 | 1.91 | 2.12 | 2.33 |
24 | 1.11 | 1.22 | 1.49 | 1.68 | 1.96 | 2.17 | 2.37 |
25 | 1.13 | 1.25 | 1.53 | 1.72 | 2.00 | 2.22 | 2.44 |
26 | 1.15 | 1.27 | 1.55 | 1.76 | 2.05 | 2.27 | 2.49 |
27 | 1.16 | 1.29 | 1.58 | 1.78 | 2.08 | 2.31 | 2.54 |
28 | 1.18 | 1.31 | 1.61 | 1.82 | 2.12 | 2.36 | 2.59 |
29 | 1.20 | 1.32 | 1.63 | 1.85 | 2.16 | 2.40 | 2.64 |
30 | 1.21 | 1.35 | 1.65 | 1.88 | 2.20 | 2.45 | 2.69 |
31 | 1.23 | 1.35 | 1.67 | 1.91 | 2.23 | 2.48 | 2.74 |
32 | 1.24 | 1.38 | 1.70 | 1.94 | 2.27 | 2.53 | 2.77 |
33 | 1.25 | 1.39 | 1.72 | 1.96 | 2.30 | 2.57 | 2.82 |
34 | 1.27 | 1.41 | 1.74 | 1.99 | 2.33 | 2.61 | 2.86 |
35 | 1.28 | 1.41 | 1.76 | 2.02 | 2.37 | 2.63 | 2.91 |
36 | 1.29 | 1.44 | 1.78 | 2.04 | 2.39 | 2.67 | 2.94 |
37 | 1.30 | 1.46 | 1.80 | 2.05 | 2.42 | 2.71 | 2.98 |
38 | 1.32 | 1.46 | 1.83 | 2.08 | 2.45 | 2.74 | 3.03 |
39 | 1.33 | 1.48 | 1.83 | 2.11 | 2.48 | 2.78 | 3.06 |
40 | 1.34 | 1.49 | 1.86 | 2.12 | 2.51 | 2.80 | 3.08 |
41 | 1.35 | 1.50 | 1.88 | 2.14 | 2.53 | 2.84 | 3.13 |
42 | 1.36 | 1.51 | 1.89 | 2.17 | 2.56 | 2.87 | 3.15 |
43 | 1.37 | 1.52 | 1.91 | 2.20 | 2.58 | 2.90 | 3.17 |
44 | 1.38 | 1.54 | 1.93 | 2.21 | 2.61 | 2.91 | 3.23 |
45 | 1.39 | 1.55 | 1.95 | 2.23 | 2.63 | 2.94 | 3.25 |
46 | 1.40 | 1.56 | 1.96 | 2.25 | 2.65 | 2.97 | 3.28 |
47 | 1.41 | 1.57 | 1.97 | 2.27 | 2.68 | 2.99 | 3.31 |
48 | 1.42 | 1.58 | 1.99 | 2.29 | 2.70 | 3.02 | 3.34 |
49 | 1.43 | 1.61 | 2.02 | 2.30 | 2.72 | 3.04 | 3.36 |
50 | 1.44 | 1.63 | 2.02 | 2.33 | 2.74 | 3.08 | 3.40 |
51 | 1.45 | 1.62 | 2.04 | 2.33 | 2.76 | 3.09 | 3.43 |
52 | 1.46 | 1.63 | 2.05 | 2.35 | 2.77 | 3.12 | 3.45 |
53 | 1.47 | 1.64 | 2.06 | 2.38 | 2.80 | 3.14 | 3.46 |
54 | 1.47 | 1.66 | 2.08 | 2.39 | 2.83 | 3.15 | 3.49 |
55 | 1.48 | 1.67 | 2.10 | 2.40 | 2.84 | 3.17 | 3.51 |
56 | 1.49 | 1.68 | 2.11 | 2.42 | 2.86 | 3.21 | 3.55 |
57 | 1.50 | 1.70 | 2.12 | 2.43 | 2.87 | 3.22 | 3.56 |
58 | 1.51 | 1.70 | 2.14 | 2.46 | 2.88 | 3.24 | 3.58 |
59 | 1.51 | 1.71 | 2.15 | 2.46 | 2.91 | 3.25 | 3.61 |
60 | 1.52 | 1.73 | 2.17 | 2.48 | 2.90 | 3.26 | 3.62 |
70 | 1.59 | 1.83 | 2.29 | 2.61 | 3.10 | 3.43 | 3.86 |
80 | 1.65 | 1.93 | 2.45 | 2.76 | 3.24 | 3.61 | 4.11 |
90 | 1.70 | 2.01 | 2.55 | 2.90 | 3.42 | 3.80 | 4.29 |
100 | 1.75 | 2.07 | 2.65 | 3.02 | 3.52 | 3.95 | 4.45 |
110 | 1.79 | 2.18 | 2.73 | 3.12 | 3.63 | 4.07 | 4.57 |
120 | 1.83 | 2.24 | 2.82 | 3.22 | 3.72 | 4.18 | 4.64 |
140 | 1.90 | 2.38 | 2.92 | 3.34 | 3.90 | 4.34 | 4.85 |
160 | 1.96 | 2.40 | 3.04 | 3.44 | 4.00 | 4.48 | 5.04 |
180 | 2.05 | 2.37 | 3.12 | 3.60 | 4.11 | 4.59 | 5.16 |
360 | 2.36 | 2.88 | 3.72 | 4.38 | 5.04 | 5.58 | 6.18 |
720 | 2.83 | 3.48 | 4.44 | 5.28 | 6.00 | 6.72 | 7.44 |
1,440.00 | 3.32 | 4.08 | 5.28 | 6.00 | 6.96 | 7.92 | 8.64 |
Source: 2-, 5-, 10-, 25-, 50-, 100-Year Design Storm | |||||||
5-60 min. NOAA HYDRO-35 | |||||||
60-120 min. interpolated | |||||||
120-1,440 min. Technical Paper No. 40 | |||||||
1-Year Design Storm | |||||||
5-160 min. calc’d from logarithmic trend line from 5,10,15,30,60,&120-min. T.P.-40 | |||||||
180-,360-,720-, and 1440-min. Technical Paper No. 40 | |||||||
3.3.1 Hydrologic Soil Group
Soils are classified as one of four (A, B, C, or D) hydrologic soil groups (HSG). A soil’s HSG indicates the minimum rate of infiltration obtained for bare soil after prolonged wetting. Group A soils have the highest infiltration rates while Group D soils have the lowest. The infiltration rate is the rate at which water enters the soil at the soil surface and is controlled by the surface’s cover type. The four HSGs are defined in TR-55 (USDA NRCS – TR-55 1986) as follows:
- Group A – (Sand, loamy sand, or sandy loam)soils have low runoff potential and high infiltration rates even when thoroughly wetted. They consist chiefly of deep, well to excessively drained sand or gravel and have a high rate of water transmission (greater than 0.30 in/hr).
- Group B – (Silt loam or loam)soils have moderate infiltration rates when thoroughly wetted and consist chiefly of moderately deep to deep, moderately well to well drained soils with moderately fine to moderately coarse textures. These soils have a moderate rate of water transmission (0.15- 0.30 in/hr).
- Group C – (Sandy clay loam)soils have low infiltration rates when thoroughly wetted and consist chiefly of soils with a layer that impedes downward movement of water and soils with moderately fine to fine texture. These soils have a low rate of water transmission (0.05-0.15 in/hr).
- Group D – (Clay loam, silty clay loam, sandy clay, silty clay, or clay) soils have high runoff potential. They have very low infiltration rates when thoroughly wetted and consist chiefly of clay soils with a high swelling potential, soils with a permanent high water table, soils with a claypan or clay layer at or near the surface, and shallow soils over nearly impervious material. These soils have a very low rate of water transmission (0-0.05 in/hr).
It should be noted that any disturbance of a soil profile can significantly change its infiltration characteristics. With urbanization, native soil profiles may be mixed or removed or fill material from other areas may be introduced. Therefore, for areas where the soil profile has been disturbed, the HSG shall be adjusted up one level (i.e., from A to B, B to C, or C to D) unless it can be shown to the City’s satisfaction that the predevelopment soil profile has been reestablished.
The predominant HSG in the City of Rogers is Group C. However, the soils in the area of interest for any project should be identified from a soil survey report, which can be obtained from local SCS offices, soil and water conservation district offices, or online resources such as the “Web Soil Survey” provided by USDA NRCS (http://websoilsurvey.nrcs.usda.gov).
3.3.2 Cover Type and Hydrologic Condition
Table RO-10 and Table RO-11 address most cover types, such as vegetation, bare soil, and impervious surfaces. There are several methods for determining cover type, but the most common are field reconnaissance, aerial photographs, and land use maps. It should be noted that anticipated cover types shall also be considered in runoff analysis based on the City’s current zoning and future master plan for the area of interest being analyzed.
Hydrologic conditionindicates the effects of cover type on infiltration and runoff for a particular HSG and is generally estimated from plant density on sample areas, with higher plant density resulting in higher rates of infiltration. “Good”hydrologic condition indicates that the soil usually has a low runoff potential for that specific HSG and cover type. Some factors to consider in estimating the effect of cover on infiltration and runoff are (a) canopy or density of lawns, crops, or other vegetative areas; (b) amount of year-round cover; (c) amount of grass or close-seeded legumes in rotations; and (d) degree of surface roughness.
3.3.3 Antecedent Moisture Condition
Antecedent moisture condition (AMC) is the index of runoff potential before a storm event. The AMC accounts for the existing degree of soil saturation at the beginning of a rainfall, therefore adjusting the CN to reflect more accurate runoff conditions. All values given in Table RO-10 and Table RO-11 represent AMC II (median moisture conditions) and shall be used for design. Adjustments for AMC I (dry conditions) and AMC III (wet conditions) can be made if appropriate (refer to USDA NRCS – NEH-4 1985), but will need to be approved by the City prior to their use.
3.3.4 Impervious Area Drainage Paths – Connected or Unconnected
When determining CN values it is important to consider how runoff from impervious areas is conveyed to the drainage system. For example, do the impervious areas connect directly to the drainage system, or are they disconnected and outlet onto lawns or other pervious areas where infiltration can occur?
3.3.4.1 Connected impervious areas
An impervious area is considered connected if runoff from the area flows directly into the drainage system. It is also considered connected if runoff from the area occurs as concentrated shallow flow that runs over an impervious area and then into the drainage system.
Urban Area CNs (Table RO-10) were developed for typical land use relationships based on specific assumed percentages of impervious area. These CN values were developed on the assumptions that (a) pervious urban areas are equivalent to pasture in good hydrologic condition and (b) impervious areas have a CN of 98 and are directly connected to the drainage system. Some assumed percentages of impervious area are shown in Table RO-10.
If all of the impervious area at a site is directly connected to the drainage system, but the impervious area percentages or the pervious land use assumptions in Table RO-10 are not applicable, use Figure RO-2 to compute a composite CN. For example, Table RO-10 gives a CN of 70 for a 1/2-acre lot in HSG B, with assumed impervious area of 25 percent. However, if the lot has 20 percent impervious area and a pervious area CN of 61, the composite CN obtained from Figure RO-2 is 68. The CN difference between 70 and 68 reflects the difference in percent impervious area. If composite values are used, their calculation shall be supplied in the Drainage Report.
3.3.4.2 Unconnected impervious areas
Runoff from unconnected impervious areas is spread over a pervious area as sheet flow. To determine the CN when all or part of the impervious area is not directly connected to the drainage system, (1) use Figure RO-3 if total impervious area is less than 30 percent, or (2) use Figure RO-2 if the total impervious area is equal to or greater than 30 percent, because the absorptive capacity of the remaining pervious areas will not significantly affect runoff.
When impervious area is less than 30 percent, obtain the composite CN by referring to the right half of Figure RO-3 and identifying the intersection point of the horizontal axis value (percentage of total impervious area) with the vertical axis value (ratio of total unconnected impervious area to total impervious area). From that intersection point, refer to the left portion of Figure RO-3 to the appropriate pervious CN and read down to find the composite CN. For example, for a 1/2-acre lot with 20 percent total impervious area (75 percent of which is unconnected) and pervious CN of 61, the composite CN from Figure RO-3 is 66. If all of the impervious area is connected, the resulting CN (from Figure RO-2) would be 68.
Table RO-10 –– Runoff Curve Numbers (CN) for Urban Areas (Antecedent Moisture Condition II, and Ia = 0.2*S) (USDA NRCS – TR-55 1986)
COVER DESCRIPTION | CN FOR HYDROLOGIC SOIL GROUP | ||||
|---|---|---|---|---|---|
COVER TYPE | AVERAGE PERCENT IMPERVIOUS AREA 3 | A | B | C | D |
Open Spaces (lawns, parks, golf courses, cemeteries, etc.) | |||||
Poor Condition (grass cover <50%) . . . . . . . . . . . . . . . . | - | 68 | 79 | 86 | 89 |
Fair condition: grass cover on 50% to 75% of the area . | - | 49 | 69 | 79 | 84 |
Good condition: grass cover on 75% or more of the area 1 | - | 39 | 61 | 74 | 80 |
Impervious Areas: | |||||
Paved Parking Lots, Roofs, Driveways, etc. | |||||
(excluding right-of-way) . . . . . . . . . . . . . . . . . . . . . . | - | 98 | 98 | 98 | 98 |
Streets and Roads: | |||||
Paved; curbs and storm sewers (excluding R.O.W) | - | 98 | 98 | 98 | 98 |
Paved; open ditches (including right-of-way) . . . . . . | - | 83 | 89 | 92 | 93 |
Gravel (including right-of-way) . . . . . . . . . . . . . . . . . | - | 76 | 85 | 89 | 91 |
Dirt (including right-of-way) . . . . . . . . . . . . . . . . . . . | - | 72 | 82 | 87 | 89 |
Urban Districts: | |||||
Commercial and Business . . . . . . . . . . . . . . . . . . . . . . . | 85 | 89 | 92 | 94 | 95 |
Industrial . . . . . . . . . . . . . . . . . . . . . . . . . . . . . . . . . . . . | 72 | 81 | 88 | 91 | 93 |
Residential Districts by Average Lot Size: 2 | |||||
1/8 acre or less (town houses) . . . . . . . . . . . . . . . . . . . . | 65 | 77 | 85 | 90 | 92 |
1/4 acre . . . . . . . . . . . . . . . . . . . . . . . . . . . . . . . . . . . . . | 38 | 61 | 75 | 83 | 87 |
1/3 acre . . . . . . . . . . . . . . . . . . . . . . . . . . . . . . . . . . . . . | 30 | 57 | 72 | 81 | 86 |
1/2 acre . . . . . . . . . . . . . . . . . . . . . . . . . . . . . . . . . . . . . | 25 | 54 | 70 | 80 | 85 |
1 acre . . . . . . . . . . . . . . . . . . . . . . . . . . . . . . . . . . . . . . | 20 | 51 | 68 | 79 | 84 |
2 acres . . . . . . . . . . . . . . . . . . . . . . . . . . . . . . . . . . . . . | 12 | 46 | 65 | 77 | 82 |
Developing Urban Areas | |||||
Newly Graded Areas (pervious areas only, no vegetation) . . . . . . . . . . . . . . . . . . . . . . . . . . . . . . . . . . . . . . | - | 77 | 86 | 91 | 94 |
1 Good cover is protected from grazing and litter and brush cover soil. | |||||
2 Curve numbers are computed assuming that the runoff from the house and driveway is directed toward the street with a minimum of roof water directed to lawns where additional infiltration could occur. | |||||
3 The remaining pervious areas (lawn) are considered to be in good pasture condition for these curve numbers. | |||||
Table RO-11 – Runoff Curve Numbers (CN) for Non-Urban Areas (Antecedent Moisture Condition II, and Ia = 0.2*S) (USDA NRCS – TR-55 1986)
COVER DESCRIPTION | CN FOR HYDROLOGIC SOIL GROUP | |||||||
|---|---|---|---|---|---|---|---|---|
COVER TYPE AND HYDROLOGIC CONDITION | A | B | C | D | ||||
Idle Lands (not yet developed) | ||||||||
Pasture, Grassland, or Range ---- continuous | Poor | 68 | 79 | 86 | 89 | |||
forage for grazing. 1 | Fair | 49 | 69 | 79 | 84 | |||
Good | 39 | 61 | 74 | 80 | ||||
Meadow ---- continuous grass, protected from | ---- | 30 | 58 | 71 | 78 | |||
grazing and generally mowed for hay. | ||||||||
Brush ---- brush-weed-grass mixture with brush | Poor | 48 | 67 | 77 | 83 | |||
the major element. 2 | Fair | 35 | 56 | 70 | 77 | |||
Good | 30 3 | 48 | 65 | 73 | ||||
Woods ---- grass combination (orchard | Poor | 57 | 73 | 82 | 86 | |||
or tree farm). 4 | Fair | 43 | 65 | 76 | 82 | |||
Good | 32 | 58 | 72 | 79 | ||||
Woods 5 | Poor | 45 | 66 | 77 | 83 | |||
Fair | 36 | 60 | 73 | 79 | ||||
Good | 30 3 | 55 | 70 | 77 | ||||
Farmsteads ---- buildings, lanes, driveways, | ---- | 59 | 74 | 82 | 86 | |||
and surrounding lots. | ||||||||
1Poor: <50% ground cover or heavily grazed with no mulch. | ||||||||
Fair: 50 to 75% ground cover and not heavily grazed. | ||||||||
Good: >75% ground cover and lightly or only occasionally grazed. | ||||||||
2Poor: <50% ground cover. | ||||||||
Fair: 50 to 75% ground cover. | ||||||||
Good: >75% ground cover. | ||||||||
3 If actual CN is less than 30; use CN = 30 for runoff calculations | ||||||||
4 CNs shown were computed for areas with 50% woods and 50% grass (pasture) cover. Other combinations of conditions may be computed from the CNs for woods and pasture. | ||||||||
5Poor: Forest litter, small trees, and brush are destroyed by heavy grazing or regular burning. | ||||||||
Fair: Woods are grazed but not burned, and some forest litter covers the soil | ||||||||
Good: Woods are protected from grazing, and litter and brush adequately cover the soil. | ||||||||
Figure RO-2 –– Composite CN with Connected Impervious Area (USDA NRCS – TR-55 1986)
Figure RO-3 –– Composite CN with Unconnected Impervious Areas and Total Impervious Areas Less than 30% (USDA NRCS – TR-55 1986)
Table RO-12 –– Computer Modeling Software
Available Computer Models | Computer model is useful in calculating … | Link to Download Computer Program |
|---|---|---|
HEC-HMS | SCS method | |
TR-55 | SCS method, Tc | |
TR-20 | SCS method, Tc |
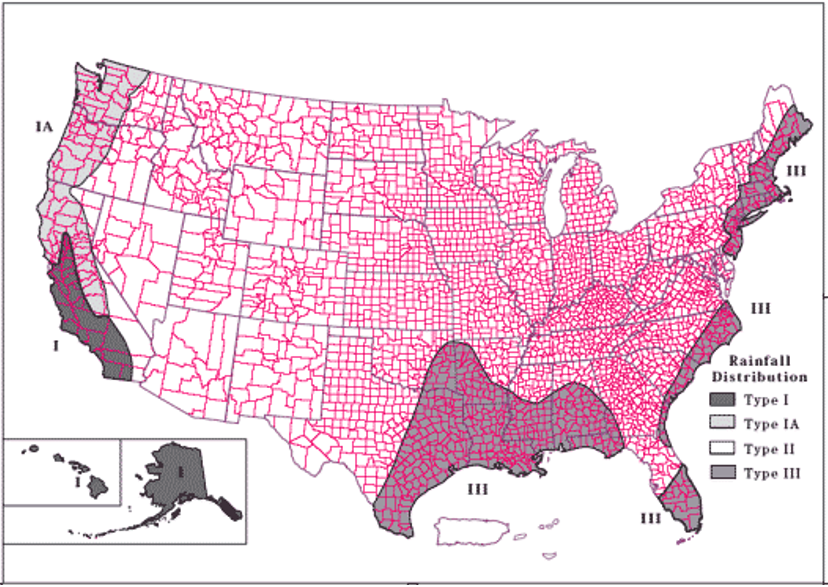
Figure RO-4 – SCS Geographic Boundaries for Rainfall Distribution
(USDA NRCS – TR-55 1986)
Stormwater Flow – Pavement Encroachment and Curb Depth Standards for the Minor Storm, 10-yr Return Frequency
- Refer to Section 1.2 for more detailed information/explanation/derivation
- Refer to Table ST-1 for more detailed information/explanation
- Refer to Section 1.3.1 for allowable gutter flow.
Stormwater Flow – Curb Depth and Street Inundation Standards for the Major Storm, 100-yr Return Frequency.
- Refer to Section 1.2 for more detailed information/explanation
- Refer to Table ST-2 for more detailed information/explanation
Street Class | Maximum Depth and Inundated Area |
|---|---|
Minor & Collector | - Residential dwellings and public, commercial, and industrial buildings ≥ 12-inches above the 100-year flood at the ground line or lowest water entry of the building. - Depth of water at curb ≤ 18-inches. - Min. F.F.E. ≥ 1-foot above top of curb. |
Minor Arterial Major Arterial Boulevard | - Residential dwellings and public, commercial, and industrial buildings ≥ 12-inches above the 100-year flood at the ground line or lowest water entry of the building. - The depth of water shall not exceed the street crown to allow operation of emergency vehicles. Depth of water at curb ≤ 12-inches. - Min. F.F.E. ≥ 1-foot above top of curb. |
Allowable Stormwater Flow Through Cross-Street/Intersection
- Refer to Section 1.2 for more detailed information/explanation
- Refer to Table ST-3 for more detailed information/explanation
Street Class | Minor (10-yr) Storm Flow Depth | Major (100-yr) Storm Flow Depth |
|---|---|---|
Local | ≤ 6-inches in cross pan | ≤ 12-inches above gutter flow line. |
Collector | Where cross pans allowed, ≤ 4-inches in cross pan | ≤ 12-inches above gutter flow line. |
Minor Arterial | None | No cross flow through intersection or across a street. Max depth at upstream gutter ≤ 12-inches |
Major Arterial | None | No cross flow through intersection or across a street. Max depth at upstream gutter ≤ 12-inches |
Boulevard | None | No cross flow through intersection or across a street. Max depth at upstream gutter ≤ 12-inches |
Physical Constraints for Curb and Gutter
- Minimum Longitudinal Grade = 0.005-ft/ft
- Minimum Cross Slope = 0.02-ft/ft
- Maximum Velocity of Curb Flow ≤ 7-ft/sec at ≤ 3-inches of depth
- Typical Manning’s n-value = 0.015 (see pg. ST-13)
- Refer to Section 1.3.2 for more detailed information/explanation
Physical Constraints for Roadside Swales
- Maximum 10-year flow velocity ≤ 4-ft/sec
- Maximum Longitudinal Grade of a Grass-lined Swale ≤ 0.02-ft/ft. Use grade control checks if adjacent street is steeper to limit the swale’s flow.
- Maximum Flow Depth ≤ 1.0-ft
- Maximum Side Slope ≤ 3H:1V
- Refer to Section 1.3.3 for more detailed information/explanation
Inlet Types and Applicable Settings
- Refer to Section 2.1 for more detailed information/explanation
- See Table ST-5 for more detailed information/explanation
Inlet Type | Applicable Setting | Advantages | Disadvantages |
|---|---|---|---|
Grate | Sumps and continuous grades (must be bicycle safe) | Perform well over wide range of grades | Can become clogged Lose some capacity with increasing grade |
Curb-opening | Sumps and continuous grades (but not steep grades) | Do not clog easily Bicycle safe | Lose capacity with increasing grade |
Combination | Sumps and continuous grades (must be bicycle safe) | High capacity Do not clog easily | More expensive than grate or curb-opening acting alone |
Slotted | Locations where sheet flow must be intercepted. | Intercept flow over wide section | Susceptible to clogging |
Area Inlet | Sumps or a lower point on a site where runoff can be efficiently collected | Do not clog easily Bicycle safe | Protrude above ground and are limited to certain locations (such as yards, etc.) |
Physical Constraints for Storm Drain Inlets / Junction Boxes
- Refer to Section 3.3.2 for more detailed information/explanation
- Inlets / junction boxes shall have 24” lids w/City of Rogers logo and fish. Rings and lids shall be heavy duty, traffic rated when in traffic areas or ROW
- Inlet curb-opening lengths shall be in 4-foot increments. The one exception shall be that curb inlets with a 5-foot interior diameter may have a 5-foot opening if they do not have extensions.
- Inlets / junction boxes shall be sized as shown in the following table (same as Table ST-11).
- Inlets / junction boxes shall be HL-93 traffic rated if in ROW or traffic areas
Inlet / Junction Box Sizing
Storm Sewer Pipe Diameter at Outlet End (inches) | Inlet / Junction Box Min. Interior Diameter / Width (feet) |
|---|---|
18 | 4 |
21 to 42 | 5 |
48 to 54 | 6 |
60 and larger | To be approved by City |
Multiple STS pipes entering structure | Provide 1-foot (min.) between each STS and 1-foot (min.) between the outside edge of the STS and interior wall of the inlet/junction box |
Inlet Spacing
- Refer to Section 3.3.2 for more detailed information/explanation
- Space inlets so as not to exceed the allowable encroachment widths as defined in Table ST-1
- Space inlets so that a carryover flow between 20- to 40-percent occurs at each inlet on grade
- Inlets / junction boxes shall be spaced at a maximum as shown in the following table (same as Table ST-10).
Inlet / Junction Box Spacing Based on Storm Sewer Pipe Size
Vertical Dimension of Pipe (and equivalent Box Culvert Height) (inches) | Maximum Allowable Distance Between Inlet / Junction Boxes and/or Cleanout Points (feet) |
|---|---|
18 to 36 | 400 |
42 and larger | 500 |
Inlets Located in Sumps and “Flat” Grades
- Refer to Section 2.3.5 for more detailed information/explanation
- Inlets located on grades ≤ 1.0% and at sumps:
- …shall not have a grate inlet acting as the sole inlet.
- …shall have a minimum curb opening of 12-feet.
- …shall have positive drainage in some form provided to convey/collect any ponded water that could result from a 100% clogged inlet.
Inlet Clogging Factors
- Refer to Section 2.3.6 for more detailed information/explanation
- Inlets in a Sump:
- Single Grate Inlet – 50% reduction
- Combination-Curb Inlet – 30% reduction
- Single Curb-Opening Inlet – 20% reduction
- Multiple-Unit Street Inlet – use clogging coefficient(s)/factor(s) and methodology as defined in Table ST-8 in Section 2.3.6
- Inlets on Grade:
- Single Grate Inlet – 25% reduction
- Combination-Curb Inlet – 25% reduction
Storm Sewer Pipe Shape
- Refer to Section 3.3.1 for more detailed information/explanation
- Circular – preferred shape
- Horizontal elliptical – must be hydraulically equivalent to the round pipe size
- Arch – must be hydraulically equivalent to the round pipe size
- Box
Storm Sewer Pipe Material
- Refer to Section 3.3.1 for more detailed information/explanation
- Reinforced Concrete Pipe (RCP)
- RCP shall be used in all street right-of-way areas and under all traffic areas (including parking lots, driveways, etc. that are outside of right-of-way).
- RCP shall conform to:
- Circular pipe - AASHTO M 170/ASTM C-76
- Arch pipe - AASHTO M 206/ASTM C-506
- Elliptical Pipe - AASHTO M 207/ASTM C507
- All STS pipe having a diameter of 18-inches or greater shall be RCP.
- Minimum 2-foot cover in traffic areas.
- Minimum 1-foot cover in all other areas.
- RCP must meet ASTM Class III specifications
- Flared end sections must meet ASTM Class II or higher specifications
- The joint seal shall be either cement mortar, three parts sand and one part cement, or cold applied performed plastic gaskets conforming to the latest applicable AASHTO designation.
- Corrugated Metal Pipe (CMP) [including Smooth Lined (SLCMP)]
- CMP may not be used:
- …in City right-of-way
- …under traffic areas
- …in City drainage easements
- …to convey water through a development from properties upstream
- …on properties where drainage structures are maintained by a residential POA
- All STS pipe having a diameter of 18-inches or greater shall be RCP.
- CMP up to 18-inches can be used in areas outside of the right-of-way and outside of city drainage easements if it meets all other criteria herein.
- CMP shall conform to:
- Galvanized Steel - AASHTO M218/ASTM A929; AASHTO M36/ASTM A760 and AASHTO Section 12/ASTM A796
- Aluminized Steel Type 2 – AASHTO M274/ASTM A929; AASHTO M36/ASTM A760 and AASHTO Section 12/ASTM A796
- Aluminum – AASHTO M197/ASTM B744; AASHTO M196/ASTM B745 and AASHTO Section 12/ASTM B790
- CMP shall have a minimum cover of 2-foot.
- Flared end sections shall be of the same material as the culvert pipe for a given installation, and shall be fabricated from steel sheets having a thickness of 0.064 inches or more.
- Coupling bands and other hardware for corrugated metal pipe shall conform to the latest applicable AASHTO designation and shall be made of the same base metal and coating as the pipe. Band widths shall be as specified in the latest applicable AASHTO designation.
- CMP may not be used:
- Corrugated Polyethylene Pipe (CPP) [including Smooth Lined (SLCPP)]
- CPP may not be used:
- …in City right-of-way
- …under traffic areas
- …in City drainage easements
- …to convey water through a development from properties upstream
- …on properties where drainage structures are maintained by a residential POA
- All STS pipe having a diameter of 18-inches or greater shall be RCP.
- CPP up to 18-inches can be used in areas outside of the right-of-way and outside of city drainage easements if it meets all other criteria herein.
- CPP shall conform to AASHTO M 294, Type S specification / ASTM F2648, ASTMD3350 and ASTMF2306.
- CPP shall have a minimum cover of 2-foot.
- CPP may not be used:
Storm Sewer Pipe Physical and Operational Constraints
- Refer to Section 3.3.1 for more detailed information/explanation
- All STS pipe having a diameter ≥ 18-inches must be RCP.
- Minimum Pipe Size = 18-inches
- Minimum Pipe Slope = 0.004-ft/ft
- Design storm frequency = 10-year design storm
- Maximum design flow capacity at Design Storm Frequency (10-yr) = 80% full flow capacity
- 2 feet cover from ground surface (gutterline) to Hydraulic Grade Line (HGL).
- Design shall manage 100-year storm runoff so that it is contained within the R.O.W. or a drainage easement and adjacent properties are protected from damage.
- Minimum Flow Velocity flowing under Design Storm (10-yr) Capacity = 3.0-ft/sec
- Maximum Flow Velocity flowing under any design storm and capacity = 12-ft/sec
- Maximum Pipe Cover shall be per Manufacturer’s recommendation or ARDOT standards, whichever is more restrictive.
- Assume full flow conditions for discharge into an existing storm sewer system or ditch for which no design information exists.
1.3.1 Evaluation Procedures
The hydraulic evaluation of street capacity includes the following steps:
- Calculate the theoretical street gutter flow capacity to convey the minor storm based upon the allowable spread defined in Table ST-1.
- Calculate the theoretical street gutter flow capacity to convey the minor storm based upon the allowable depth defined Table ST-1.
- Calculate the allowable street gutter flow capacity by multiplying the theoretical capacity (calculated in number 2) by a reduction factor (see Figure ST-3). This reduction factor is used for safety considerations. The lesser of the capacities calculated in step 1 and this step is the allowable street gutter capacity.
- Calculate the theoretical major storm conveyance capacity based upon the road inundation criteria in Table ST-2. Reduce the major storm capacity by a reduction factor to determine the allowable storm conveyance capacity. (see Figure ST-3)
1.3.2 Curb and Gutter
1.3.2.1 Physical Constraints for Longitudinal Slope and Cross Slope
Streets are characterized with two different slope components: longitudinal slope and cross slope. A gutter’s longitudinal slope will match the street’s longitudinal slope. The hydraulic capacity of a gutter increases as the longitudinal slope increases. To ensure cleaning velocities at very low flows, the gutter shall have a minimum slope of 0.005 feet per foot (0.5%). The allowable flow capacity of the gutter on steep slopes (≥ 6%) is limited to provide for public safety and as such the maximum velocity of curb flow shall be ≤ 7-feet per second and limited to 3-inches of depth.
The cross slope of a street represents the slope from the street crown to the gutter section. The City requires a minimum cross slope of 2% for pavement drainage. Typically, a gutter’s cross slope matches the street’s cross slope. However, composite gutter sections are often used with gutter cross slopes being steeper than street cross slopes to increase the hydraulic capacity of the gutter.
1.3.2.2 Gutters With Uniform Cross Slopes (i.e., Where Gutter Cross Slope = Street Cross Slope)
Gutter flow is assumed to be uniform for design purposes; therefore Manning’s equation is appropriate with a slight modification to account for the effects of a small hydraulic radius. For a triangular cross section (Figure ST-1), the Manning formula for gutter flow is written as:
 (Equation ST-1)
in which:
Q = calculated flow rate for the street (cfs)
n= Manning’s roughness coefficient, (typically = 0.013). Refer to Table ST-4 for other gutter and pavement types
Sx= street cross slope (ft/ft)
SL= street longitudinal slope (ft/ft)
T= top width of flow spread (ft)
Figure ST-1 –– Typical Gutter Section – Constant Cross Slope (VDOT Drainage Manual 2010)
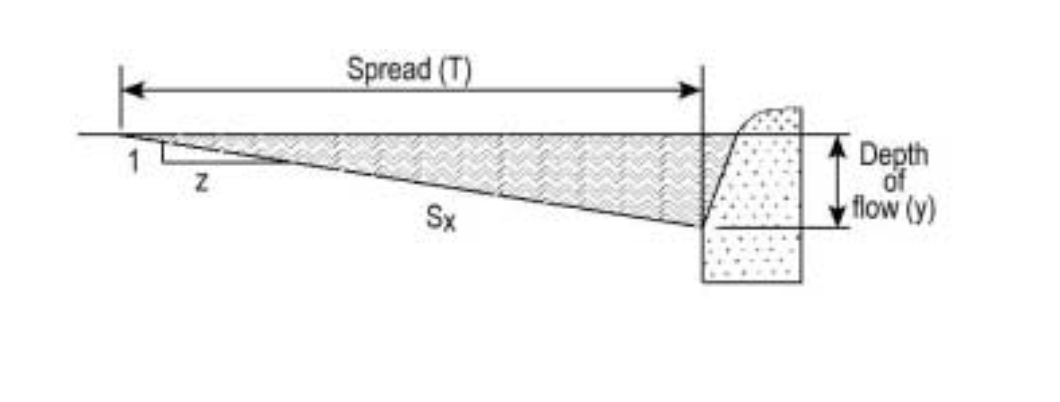
Table ST-4 –– Manning’s n Values For Street and Pavement Gutters (FHWA – HDS-3 1961)
Type of Gutter or Pavements | Manning’s n |
|---|---|
Concrete gutter, troweled finished . . . . . . . . . . . . | 0.012 |
Asphalt pavement: | |
Smooth texture . . . . . . . . . . . . . . . . . . . . . . | 0.013 |
Rough texture . . . . . . . . . . . . . . . . . . . . . . . | 0.016 |
Concrete gutter with asphalt pavement: | |
Smooth . . . . . . . . . . . . . . . . . . . . . . . . . . . . | 0.013 |
Rough . . . . . . . . . . . . . . . . . . . . . . . . . . . . . | 0.015 |
Concrete pavement: | |
Float finish . . . . . . . . . . . . . . . . . . . . . . . . . | 0.014 |
Broom finish . . . . . . . . . . . . . . . . . . . . . . . . | 0.016 |
For gutters with small slopes, where sediment | |
may accumulate, increase above values of n by | 0.002 |
The depth of flow, y, at the curb can be found using:
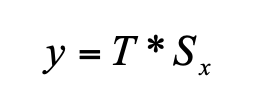 (Equation ST-2)
Note that the flow depth must be less than the curb height during the minor storm based on Table ST-1. Manning’s equation can be written in terms of the flow depth, as:
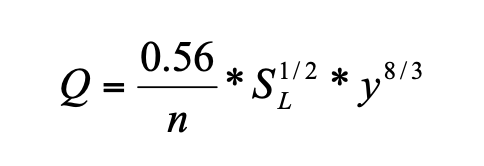 (Equation ST-3)
The cross-sectional flow area, A, can be expressed as:
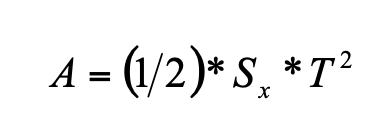 (Equation ST-4)
The gutter velocity at peak capacity may be found from the continuity equation (V = Q/A).
1.3.2.3 Gutters With Composite Cross Slopes (i.e., Where Gutter Cross Slope ≠ Street Cross Slope)
Gutters with composite cross slopes (Figure ST-2) can be used to increase the gutter capacity.
Figure ST-2 –– Typical Gutter Section – Composite Cross Slope (VDOT Drainage Manual 2010)
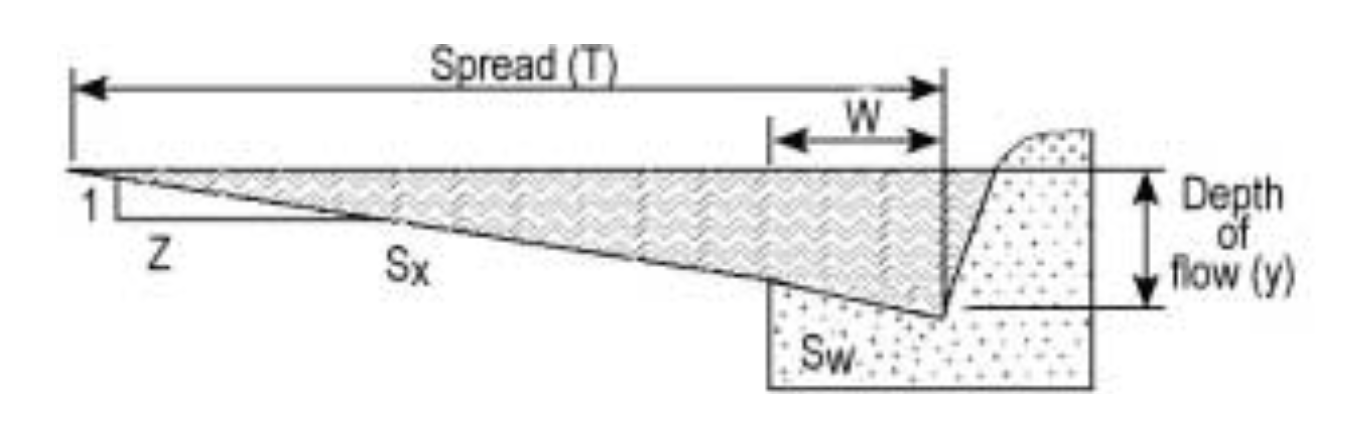
For a composite gutter section:
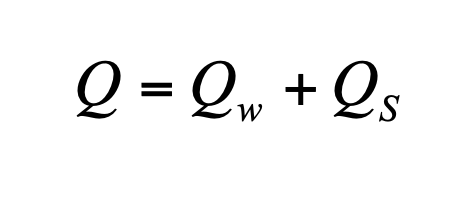 (Equation ST-5)
in which:
Qw = flow rate in the depressed section of the gutter (cfs)
Qs = discharge in the section that is above the depressed section (cfs)
The Federal Highway Administration’s HEC-22 (2001) provides the following equations for obtaining the flow rate in gutters with composite cross slopes. The theoretical flow rate, Q, is:
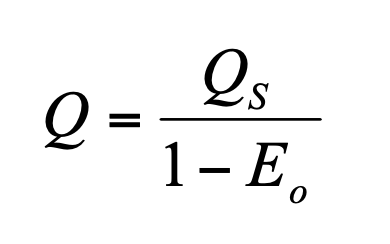 (Equation ST-6)
in which:
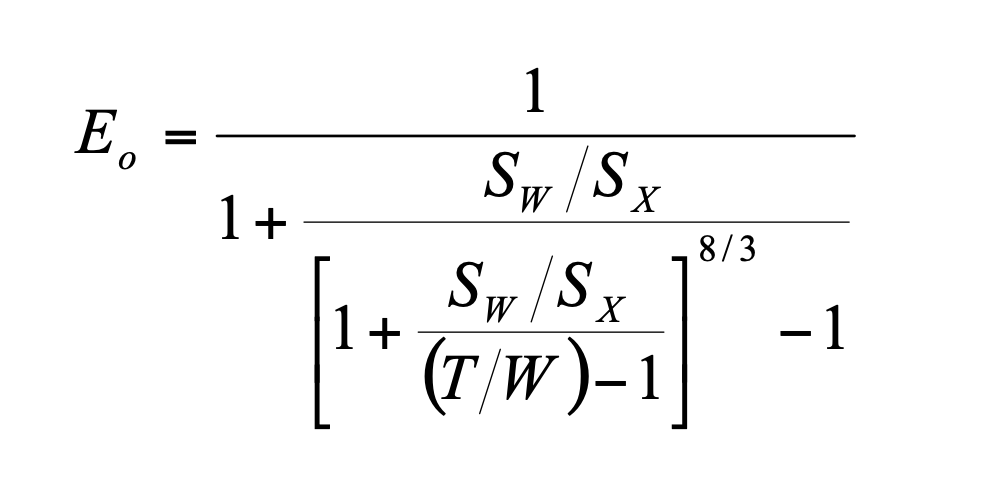 (Equation ST-7)
in which Swis the gutter cross slope (ft/ft), and,
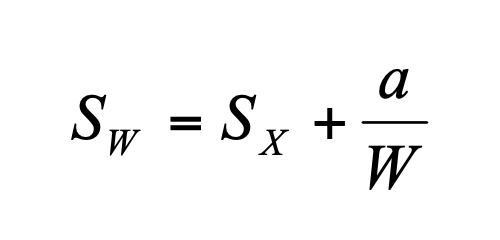 (Equation ST-8)
in which a is the gutter depression (feet) and W is width of the gutter (ft).
Figure ST-2 depicts all geometric variables. From the geometry, it can be shown that:
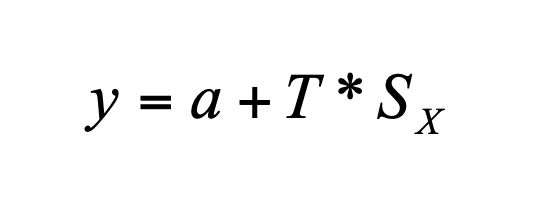 (Equation ST-9)
and,
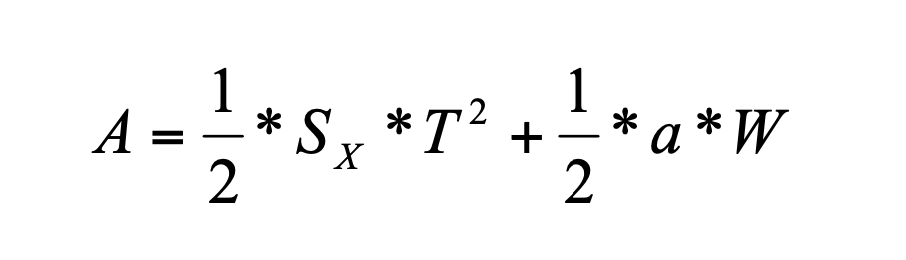 (Equation ST-10)
in which yis the flow depth (at the curb) and Ais the flow area.
1.3.2.4 Allowable Gutter Hydraulic Capacity
As stormwater flows along streets, it encounters obstructions and other limiting street conditions that decrease the gutter’s hydraulic capacity. These conditions include street overlays, parked vehicles, debris and hail accumulation, and deteriorated pavement. Due to the negative impact these street conditions have on the stormwater flow in the gutter, a reduction factor is applied to the theoretical gutter capacity. The reduction factor also is used to minimize damaging gutter flow velocities and depths. Utilizing the reduction factor, the allowable gutter hydraulic capacity is determined as the lesser of:
 (Equation ST-11)
or
 (Equation ST-12)
in which QA= allowable street hydraulic capacity, QT = street hydraulic capacity limited by the maximum water spread, R= reduction factor (see Figure ST-3), and QF= gutter capacity when flow depth equals allowable depth.
There are two sets of reduction factors developed for the City of Rogers based on the reduction factor equation(s) discussed in Urban Hydrology and Hydraulics Design (Guo 2000b). One is for the minor event, and another is for the major event. Figure ST-3 shows that the reduction factor remains constant for a street slope <1.5%, and then decreases as the street slope increases.
It is important for street drainage designs that the allowable street hydraulic capacity be used instead of the calculated gutter-full capacity. Thus, wherever the accumulated stormwater amount on the street is close to the allowable capacity, a street inlet shall be installed.
Figure ST-3 — Reduction Factor for Allowable Gutter Capacity
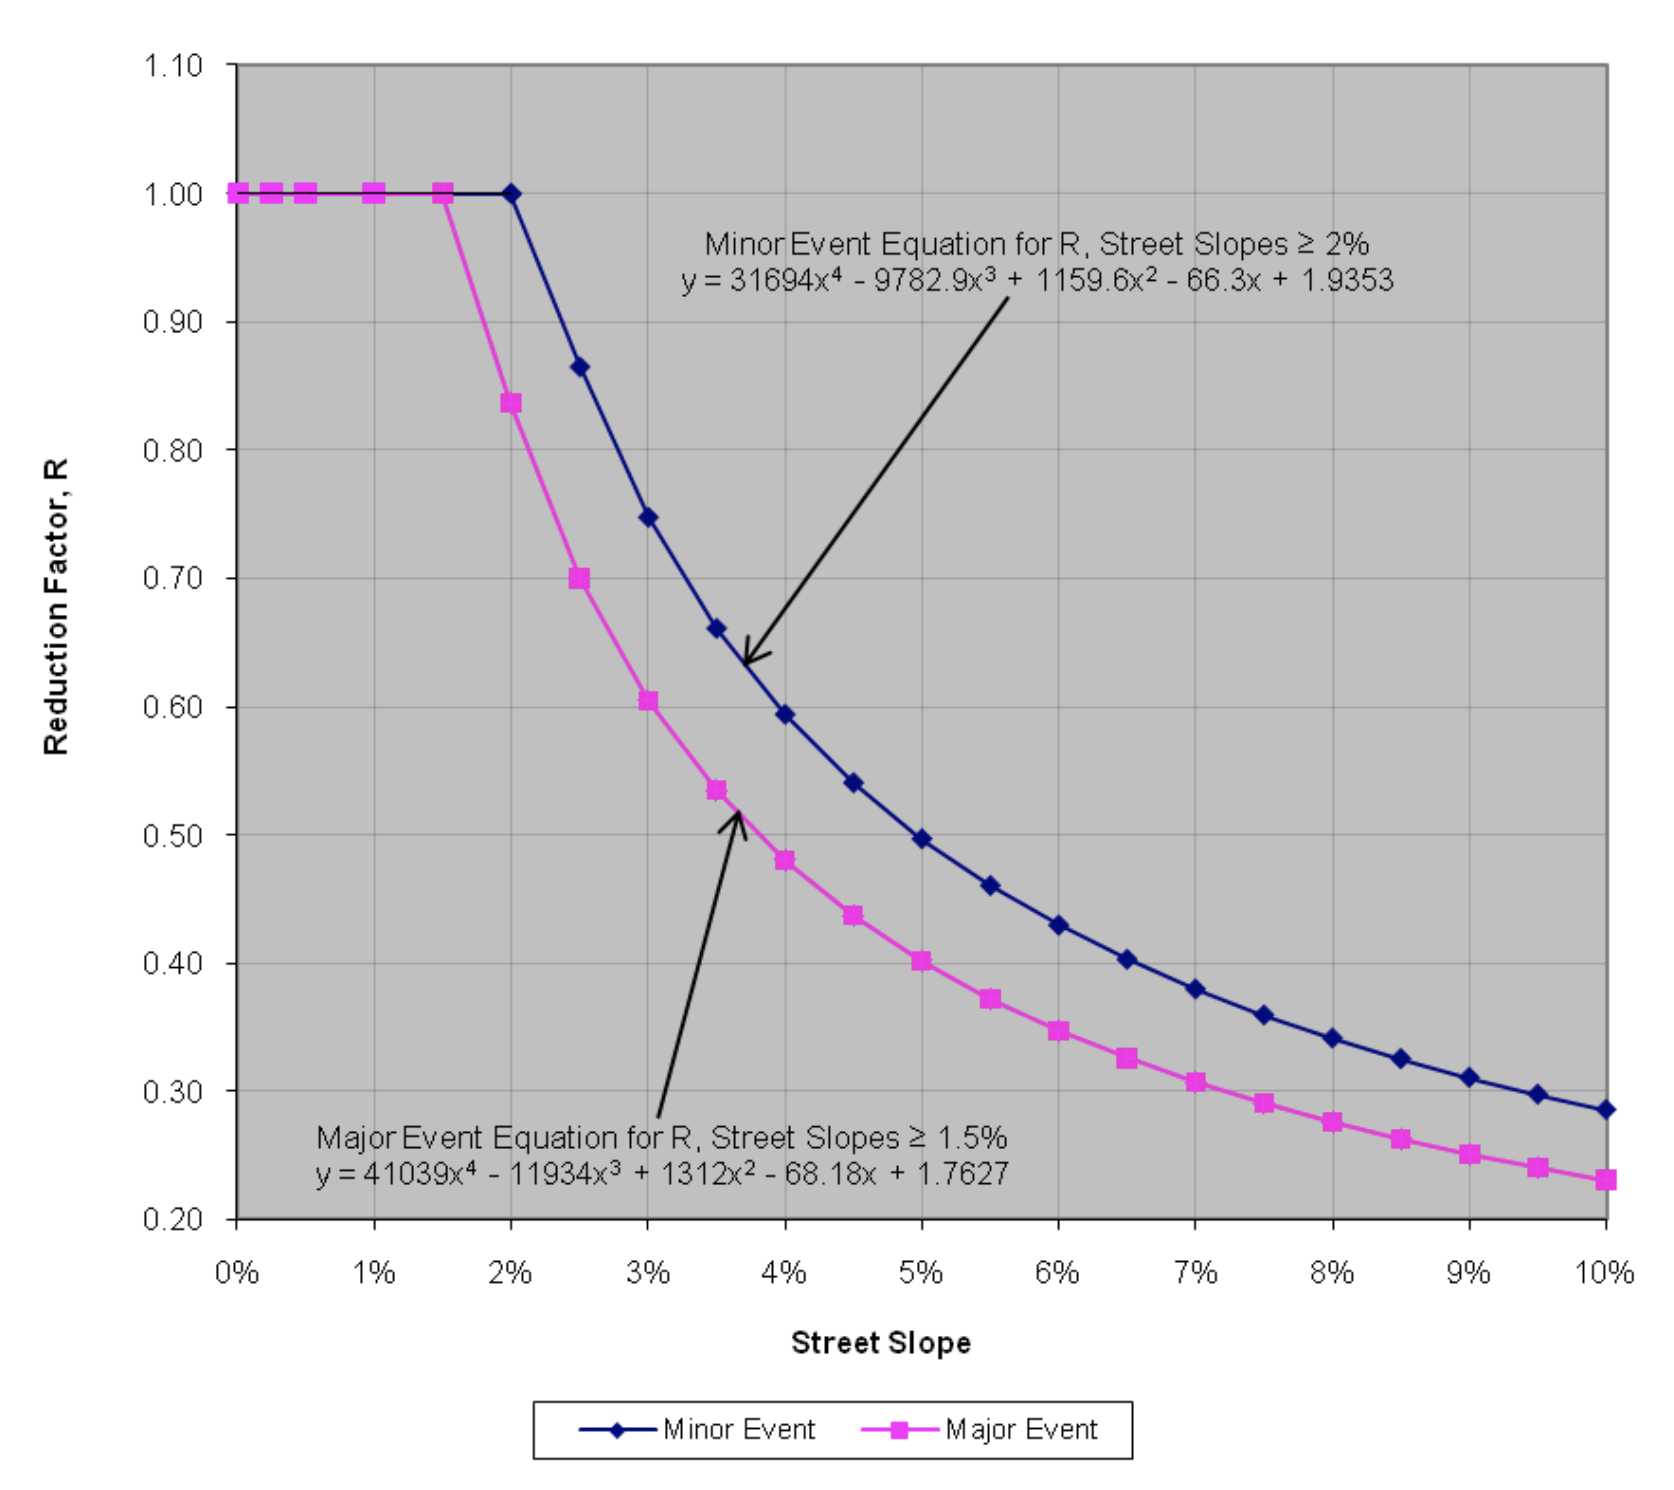
1.3.3 Swale Sections (V-Shaped With the Same or Different Side Slopes)
Swales are often used to convey runoff from pavement where curb and gutter sections are not used. It is very important that swale depths and side slopes be as shallow as possible for safety and maintenance reasons. Street-side swales serve as collectors of initial runoff and transport it to the nearest inlet or major drainageway. To be effective, they need to be limited to the velocity, depth, and cross-slope geometries considered acceptable. The following limitations shall apply to street-side swales:
- Maximum flow velocity ≤ 4 ft/sec for grass-lined swales for 10-year event.
- Longitudinal grade of a grass-lined swale ≤ 2%. Use grade control checks if adjacent street is steeper to limit the swale’s flow.
- Maximum flow depth (d) ≤ 1.0 ft. for 10-year event.
- Maximum side slope of each side (Sx1and Sx2) ≤ 3H:1V.*
* Note: Use of flatter side slopes is strongly recommended.
Swales generally have V-sections (Figure ST-4). Equation ST-1 can be used to calculate the flow rate in a V-section (if the section has a constant Manning’s nvalue) with an adjusted slope found using:
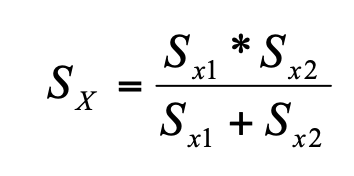 (Equation ST-13)
in which:
Sx1 = adjusted side slope (ft/ft)
Sx1 = right side slope (ft/ft)
Sx2 = left side slope (ft/ft)
Figure ST-4 shows the geometric variables.
Figure ST-4 — Typical Street-Side Swale Sections—V-Shaped (UDFCD USDCM 2002)
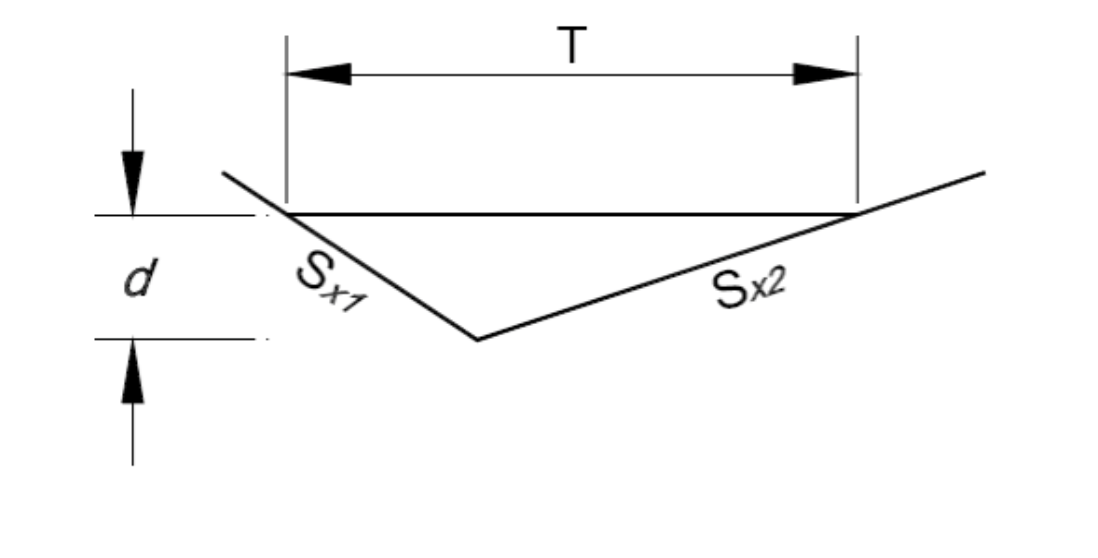
Note that the slope of swales is often different than the adjacent street. The hydraulic characteristics of the swale can therefore change from one location to another on a given swale. The flow depth and spread limitations of Table ST-2 and Table ST-3 are also valid for swales. There is no capacity reduction for safety considerations for roadside swales.
Manning’s equation can be used to calculate flow characteristics.
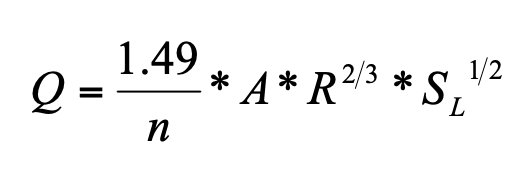 (Equation ST-14)
in which:
Q= flow rate (cfs)
n= Manning’s roughness coefficient (see Table ST-4)
A= flow area (ft2)
R = A/P (ft)
P= wetted perimeter (ft)
SL= longitudinal slope (ft/ft)
2.3.1 Grate Inlets (On a Continuous Grade)
The capture efficiency of a grate inlet is highly dependent on the width and length of the grate and the velocity of gutter flow. Ideally, if the gutter velocity is low and the spread of water does not exceed the grate width, all of the flow will be captured by the grate inlet. However, the spread of water often exceeds the grate width and the flow velocity can be high. Thus, some water gets by the inlet and because of this the inlet efficiency must be determined in order to evaluate the impact the bypass gutter flow will have on the efficiency and encroachment at the next inlet downstream of the bypassed inlet.
In order to determine the efficiency of a grate inlet, gutter flow is divided into two parts: frontal flow and side flow. Frontal flow is defined as that portion of the flow within the width of the grate. The portion of the flow outside the grate width is called side flow. By using Equation ST-1, the frontal flow can be evaluated and is expressed as:
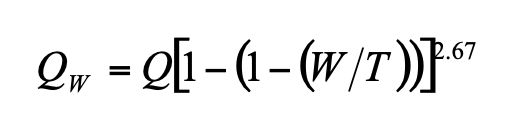 (Equation ST-17)
in which:
QW= frontal discharge (flow within width W) (cfs)
Q= total gutter flow (cfs) found using Equation ST-1
W= width of grate (ft)
T= total spread of water in the gutter (ft)
It should be noted that the grate width is generally equal to the depressed section in a composite gutter section. By definition:
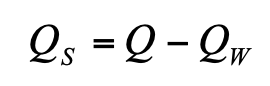 (Equation ST-18)
in which:
QS= side discharge (i.e., flow outside the depressed gutter or grate) (cfs)
The ratio of the frontal flow intercepted by the inlet to total frontal flow, Rf, is expressed as:
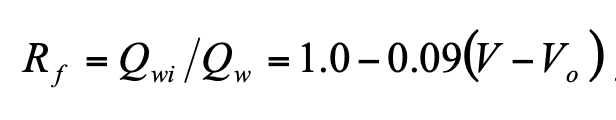 for V ≥ Vo, otherwise Rf = 1.0 (Equation ST-19)
in which:
Qwi= frontal flow intercepted by the inlet (cfs)
V= velocity of flow in the gutter (ft/sec)
V0= splash-over velocity (ft/sec)
Figure ST-6 provides a graphical solution to Equation ST-19.
Figure ST-6 –– Grate Inlet Frontal Flow Interception Efficiency
(FHWA – HEC-22 2009)
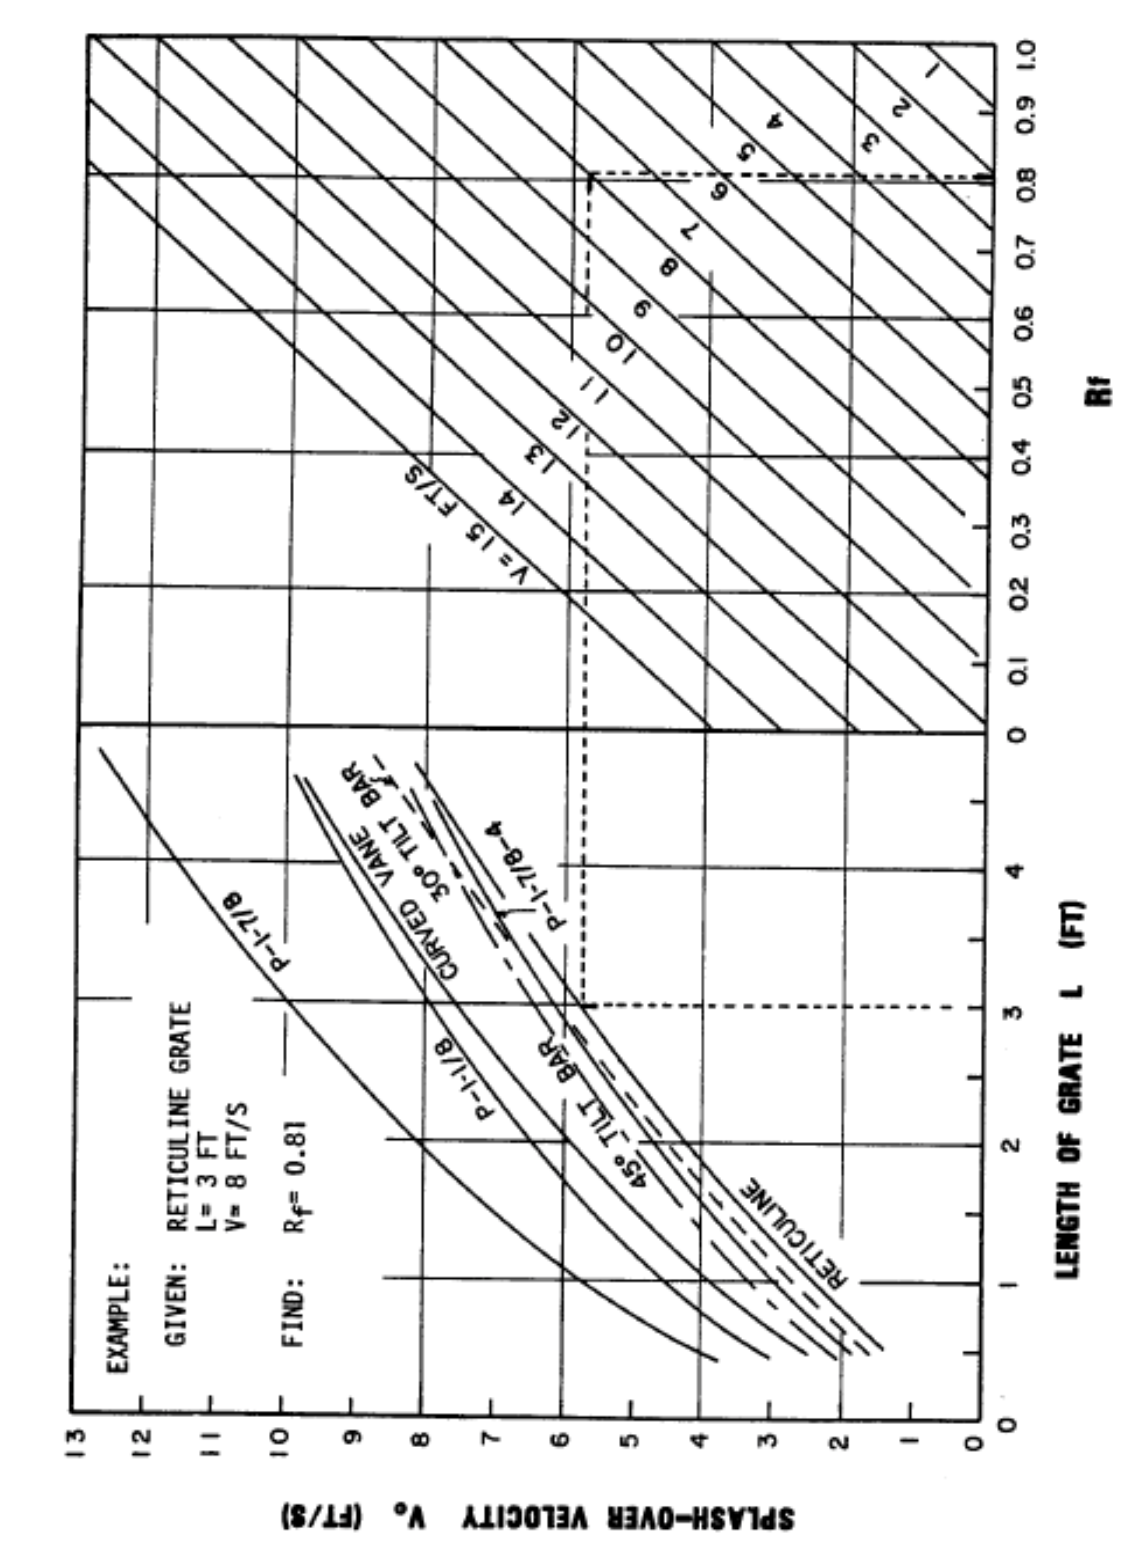
The splash-over velocity is defined as the minimum velocity causing some water to shoot over the grate. This velocity is a function of the grate length and type.
The splash-over velocity can be determined using the empirical formula (Guo 1999):
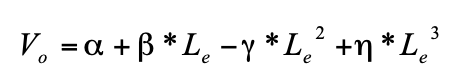 (Equation ST-20)
in which:
V0= splash-over velocity (ft/sec)
Le= effective unit length of grate inlet (ft)
α, β, γ, η = constants from Table ST-6
Table ST-6 — Splash Velocity Constants for Various Types of Inlet Grates
(UDFCD USDCM 2002)
Type of Grate | α | β | γ | η |
|---|---|---|---|---|
Bar P-1-7/8 | 2.22 | 4.03 | 0.65 | 0.06 |
Bar P-1-1/8 | 1.76 | 3.12 | 0.45 | 0.03 |
Vane Grate | 0.30 | 4.85 | 1.31 | 0.15 |
45-Degree Bar | 0.99 | 2.64 | 0.36 | 0.03 |
Bar P-1-7/8-4 | 0.74 | 2.44 | 0.27 | 0.02 |
30-Degree Bar | 0.51 | 2.34 | 0.20 | 0.01 |
Reticuline | 0.28 | 2.28 | 0.18 | 0.01 |
The ratio of the side flow intercepted by the inlet to total side flow, Rs, is expressed as:
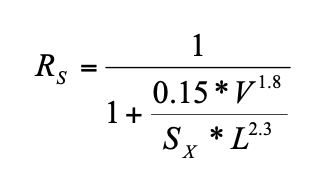 (Equation ST-21)
in which:
V= velocity of flow in the gutter (ft/sec)
Sx= street cross slope (ft/ft)
L= length of grate (ft)
Figure ST-7 below provides a graphical solution to Equation ST-21.
Figure ST-7 –– Grate Inlet Side Flow Interception Efficiency
(FHWA – HEC-22 2009)
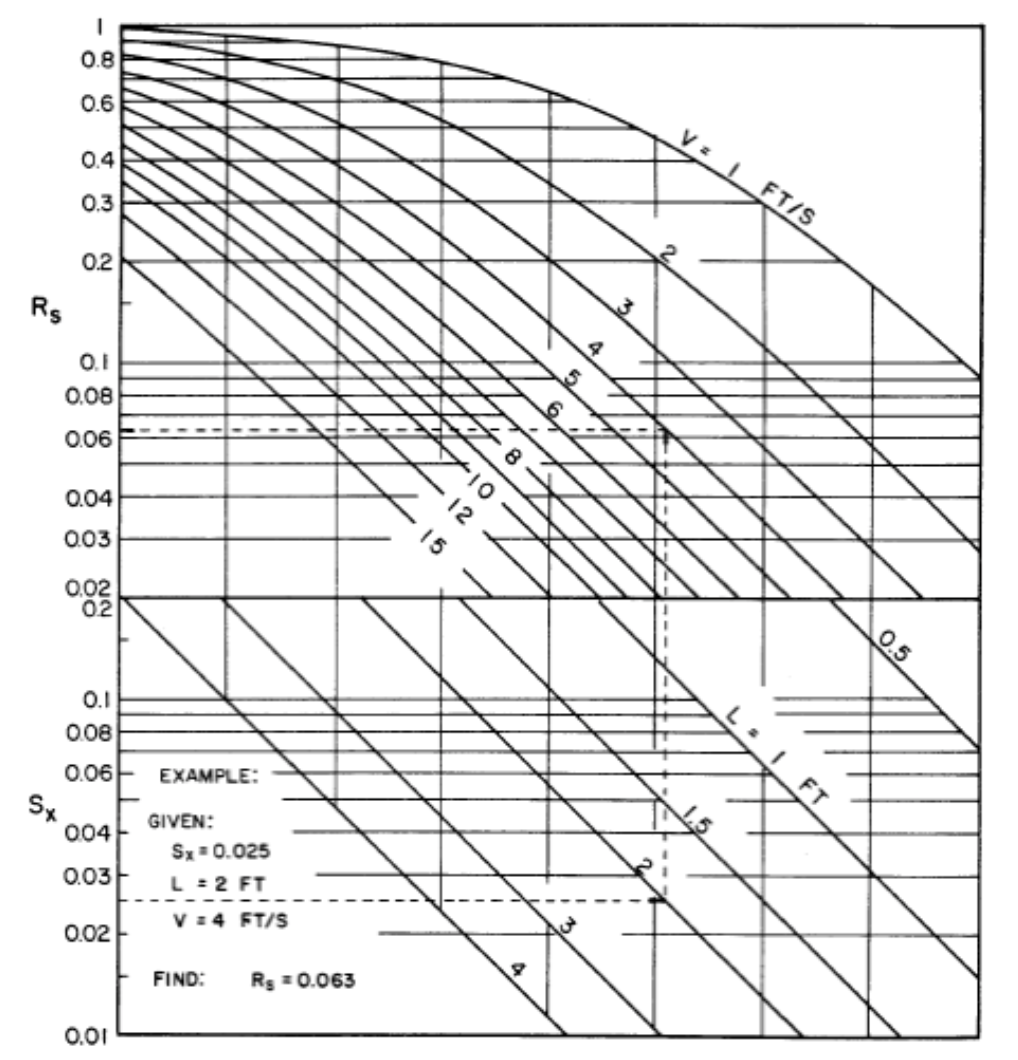
The capture efficiency, E, of the grate inlet may now be determined using:
![]() (Equation ST-22)
(Equation ST-22)
2.3.2 Curb-Opening Inlets (On a Continuous Grade)
The capture efficiency of a curb-opening inlet is dependent on the length of the opening, the depth of flow at the curb, street cross slope and the longitudinal gutter slope. Ideally, if the curb opening is long, the flow rate is low, and the longitudinal gutter slope is small, all of the flow will be captured by the inlet. However, it is uneconomical to install a curb opening long enough to capture all of the flow for all situations and as a result some water gets by the inlet. Therefore, the inlet efficiency needs to be determined in order to evaluate the impact the bypass gutter flow will have on the efficiency and encroachment at the next inlet downstream of the bypassed inlet.
The efficiency, E, of a curb-opening inlet is calculated as:
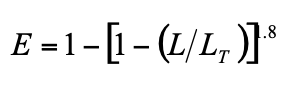 for L < LT, otherwise E = 1.0 (Equation ST-23)
in which:
L= installed (or designed) curb-opening length (ft)
LT= curb-opening length required to capture 100% of gutter flow (ft)
Design curb-opening length shall be in 4-foot increments.
Figure ST-8 below provides a graphical solution to Equation ST-23 once LT is known.
Figure ST-8 –– Curb-Opening and Slotted Drain Inlet Interception Efficiency (FHWA – HEC-22 2009)
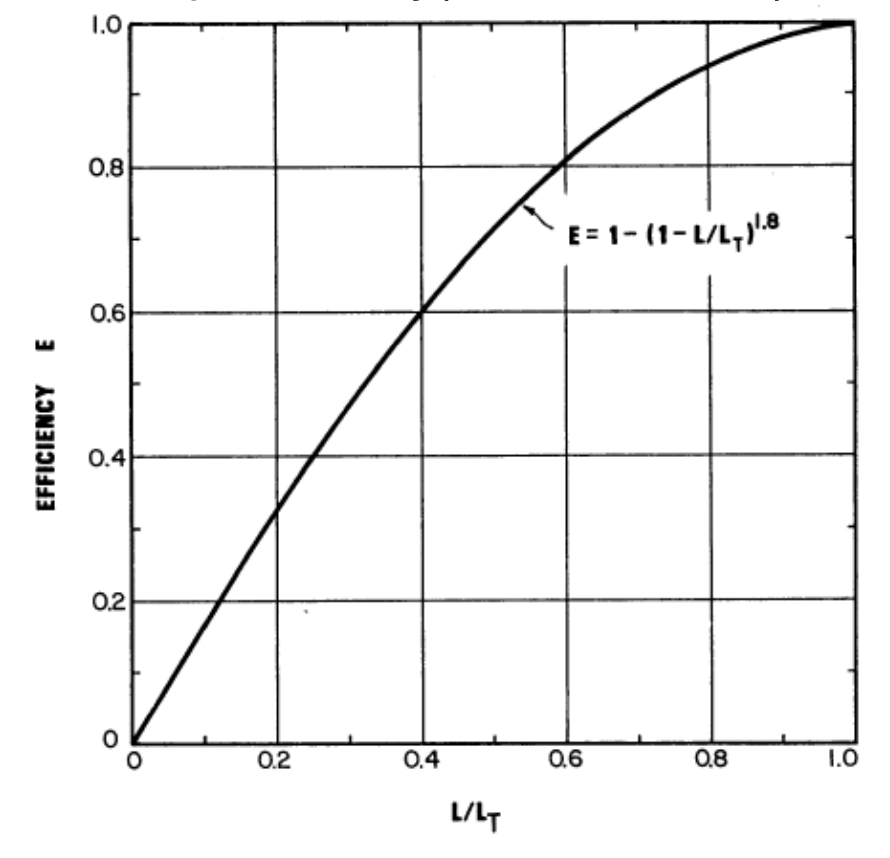
Besides at low points, inlets located on streets of less than one-percent (1%) grade, shall be considered and evaluated as inlets in sumps based on the procedures outlined in Section 2.3.5.
2.3.2.1 Curb-Opening Inlet – Not Depressed
In the case of a curb-opening inlet that is not depressed, the depth of flow at the upstream end of the opening is the depth of flow in the gutter. In streets where grades are greater than one-percent (1%), the velocities are high and the depths of flow are usually small, which allows for little time to develop cross flow into a curb opening. Therefore, curb-opening inlets that are not depressed shall only be used on streets where the longitudinal grade is one-percent (1%) or less.
For a curb-opening inlet that is not depressed,
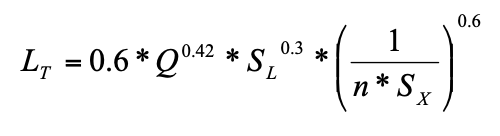 (Equation ST-24)
in which:
Q= gutter flow (cfs)
SL = longitudinal street slope (ft/ft)
SX = street cross slope (ft/ft)
n = Manning’s roughness coefficient
2.3.2.2 Curb-Opening Inlet – Depressed
Depressing the gutter at a curb-opening inlet below the normal level of the gutter increases the cross-flow toward the opening, thereby increasing the inlet capacity. Also, the downstream transition out of the depression causes backwater which further increases the amount of water captured. Depressed inlets shall be used on continuous longitudinal grades that exceed one-percent (1%) except that their use in traffic lanes shall be approved by the City.
For a depressed curb-opening inlet,
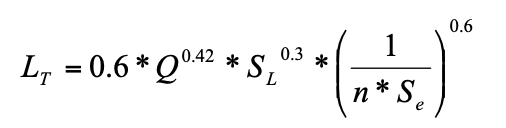 (Equation ST-25)
The equivalent cross slope, Se, can be determined from
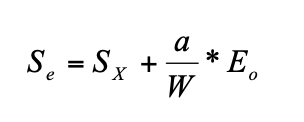 (Equation ST-26)
in which a= gutter depression and W= depressed gutter section as shown in Figure ST-9. For a curb-opening inlet, a = 4.5-inches and W = 18-inches. The ratio of the flow in the depressed section to total gutter flow, E0, can be calculated from Equation ST-7.
Figure ST-9 –– Depressed Gutter Section (FHWA – HEC-22 2009)
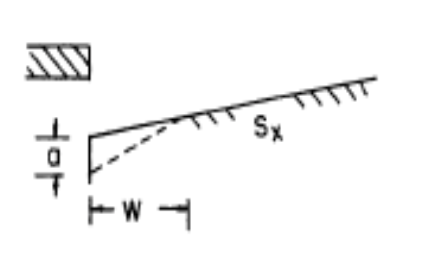
2.3.3 Combination Inlets (On a Continuous Grade)
Combination inlets take advantage of the debris removal capabilities of a curb-opening inlet and the capture efficiency of a grate inlet. Interception capacity is computed by neglecting the curb opening if the grate and curb opening are side-by-side and of approximately the same length. A desirable configuration is to have all or part of the curb-opening inlet lie upstream from the grate, allowing the curb opening to intercept debris which might otherwise clog the grate and also provide additional capacity. A combination inlet with a curb opening upstream of the grate has an interception capacity equal to the sum of the two inlets, except that the frontal flow and thus the interception capacity of the grate is reduced by the amount of gutter flow intercepted by the curb opening. The appropriate equations have already been presented in Section 2.3.1 and Section 2.3.2.
2.3.4 Slotted Inlets (On a Continuous Grade)
Slotted inlets can generally be used to intercept sheet flow that is crossing the pavement in an undesirable location. Unlike grate inlets, they have the advantage of intercepting flow over a wide section. They do not interfere with traffic operations and can be used on both curbed and uncurbed sections. Like grate inlets, they are susceptible to clogging.
Slotted inlets function like a side-flow weir, much like curb-opening inlets. The FHWA HEC-22 (2001) suggests the hydraulic capacity of slotted inlets closely corresponds to curb-opening inlets if the slot openings are equal to or greater than 1.75-inches. Therefore, the equations developed for curb-opening inlets (Equation ST-23 through Equation ST-26) are appropriate for slotted inlets with openings ≥ 1.75-inches. All slot inlets designed for use in the City of Rogers shall have slot openings ≥ 1.75-inches.
2.3.5 Inlets Located in Sumps
All of the stormwater excess that enters a sump (i.e., a depression or low point in grade) must pass through an inlet to enter the stormwater conveyance system. If the stormwater is laden with debris, the inlet is susceptible to clogging and ponding could result. Therefore, the capacity of inlets in sumps must account for this clogging potential. Flanking inlets may be used on the upstream side of the sump just far enough away that before encroachment and ponding depth issues could begin the backwater built up due to the clog would be collected by the flanking inlets. At the very most the difference between the throat flowlines of the flanking inlet and sump inlet shall not be more than one-tenth of a foot (0.10-foot) less than the curb height. Grate inlets acting alone as the sole inlet in a sump shall not be allowed. Curb-opening inlets or combination inlets are to be used to capture stormwater runoff collecting in sumps. The minimum curb opening for inlets in sumps is 12-feet in street right-of-way or public access.
Positive drainage shall be provided at all sump inlets, so that if the sump inlet becomes 100% clogged there will be a way for stormwater to be conveyed away from the area and prevent encroaching and ponding depth noncompliance in the gutter section. Roadside swales shall be designed and placed in such a way that when the depth of stormwater at the curb exceeds the curb height, water will drain away from the road and be collected and conveyed in the swale.
Furthermore sumps or concentrated low points on a site can occur in areas isolated from curbed and guttered pavements and the information provided in this section can be used to analyze the collection of stormwater runoff at these locations. The type of inlet usually reserved to collect stormwater runoff in areas as described are called area inlets. Area inlets act as curb-opening inlets, but typically have curb openings on more than one side. Area inlets can also be grated inlets, like in the application of a grated inlet in a low point in the middle of a parking lot.
As previously mentioned, inlets in sumps function like weirs for shallow depths, but as the depth of stormwater increases, they begin to function like an orifice. The transition from weir flow to orifice flow takes place over a relatively small range of depth that is not well defined. The FHWA provides guidance on the transition region based on significant testing.
The hydraulic capacity of grate, curb-opening, and slotted inlets operating as weirs is expressed as:
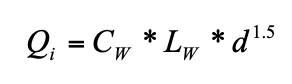 (Equation ST-27)
in which:
Qi= inlet capacity (cfs)
CW= weir discharge coefficient
LW= weir length (ft)
d= flow depth (ft)
Values for Cwand Lware presented in Table ST-7 for various inlet types. (Note that the expressions given for curb-opening inlets without depression shall be used for depressed curb-opening inlets if L> 12 feet.)
The hydraulic capacity of grate, curb-opening, and slotted inlets operating as orifices is expressed as:
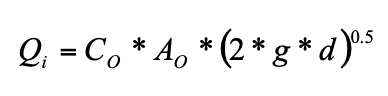 (Equation ST-28)
in which:
Qi= inlet capacity (cfs)
CO= orifice discharge coefficient
AO= orifice area (ft2)
d= characteristic depth (ft) as defined in Table ST-7
g= 32.2 ft/sec2
Values for COand AOare presented in Table ST-7 for different types of inlets.
Combination inlets are commonly used in sumps. The hydraulic capacity of combination inlets in sumps depends on the type of flow and the relative lengths of the curb opening and grate. For weir flow, the capacity of a combination inlet (grate length equal to the curb opening length) is equal to the capacity of the grate portion only. This is because the curb opening does not add any length to the weir equation (Equation ST-27). If the curb opening is longer than the grate, the capacity of the additional curb length shall be added to the grate capacity. For orifice flow, the capacity of the curb opening shall be added to the capacity of the grate.
Table ST-7 — Sag Inlet Discharge Variables and Coefficients (Modified From Akan and Houghtalen 2002)
Weir Flow | |||||
|---|---|---|---|---|---|
Inlet Type | Cw | Lw1 | Weir Equation Valid For | Definitions of Terms | |
Grate Inlet | 3.00 | L+ 2W | d < 1.79(Ao / Lw) | L= Length of grate W= Width of grate d= Depth of water over grate Ao= Clear opening area 2 | |
Curb Opening Inlet | 3.00 | L | d< h | L= Length of curb opening h= Height of curb opening d= di− (h/ 2) di= Depth of water at curb opening | |
Depressed Curb Opening Inlet 3 | 2.30 | L+ 1.8W | d< (h+ a) | W= Lateral width of depression a= Depth of curb depression | |
Slotted Inlets | 2.48 | L | d< 0.2 ft | L= Length of slot d= Depth at curb | |
1) The weir length shall be reduced where clogging is expected. 2) Ratio of clear opening area to total area is 0.8 for P-1-7/8-4 and reticuline grates, 0.9 for P-1-7/8 and 0.6 for P-1-1/8 grates. Curved vane and tilt bar grates are not recommended at sag locations. Provide actual value based on manufacturer’s specifications. 3) If L > 12 ft, use the expressions for curb opening inlets without depression. | |||||
Orifice Flow | |||||
Inlet Type | Co | Ao4 | Orifice Equation Valid for | Definition of Terms | |
Grate Inlet | 0.67 | Clear opening area 5 | d> 1.79(Ao/Lw) | d= Depth of water over grate | |
Curb Opening Inlet (depressed or undepressed, horizontal orifice throat 6) | 0.67 | (h)(L) | di> 1.4h | d= di– (h/ 2) di= Depth of water at curb opening h= Height of curb opening | |
Slotted Inlet | 0.80 | (L)(W) | d> 0.40 ft | L= Length of slot W= Width of slot d= Depth of water over slot | |
4) The orifice area shall be reduced where clogging is expected. 5) The ratio of clear opening area to total area is 0.8 for P-1-7/8-4 and reticuline grates, 0.9 for P-1-7/8 and 0.6 for P-1-1/8 grates. Curved vane and tilt bar grates are not recommended at sag locations. Provide actual value based on manufacturer’s specifications. 6) See Figure ST-10 for curb opening throat type to be used for all curb opening inlets in the City of Rogers. | |||||
Figure ST-10 –– Curb Opening Inlet Throat Type for Use in Design (FHWA – HEC 22 2009)
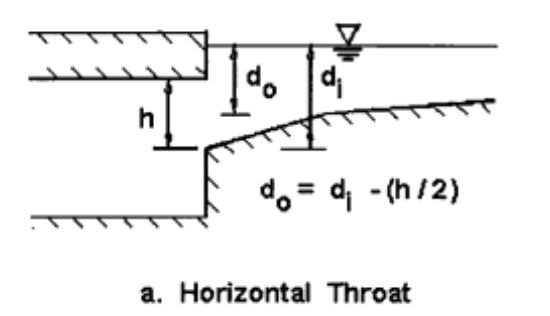
2.3.6 Inlet Clogging
Inlets are subject to clogging when debris laden runoff is collected during the first-flush runoff volume during a storm event. Clogging factors (as a percent) shall be applied to the design lengths and or/areas calculated for the stormwater inlet in order to take into account the effects of clogging on each inlet type. A 50% clogging factor shall be used in the design of a single grate inlet, 30% clogging factor for a single combination-curb inlet, and 20% clogging factor for a single curb-opening inlet or area inlet in a sump. A 25% clogging factor shall be used in the design of a single grate inlet or the grate portion of a combination inlet when these inlets are located on grade.
Often, it takes multiple units to collect the stormwater on the street. Since the amount of debris is largely associated with the first-flush volume in a storm event, the clogging factor applied to a multiple-unit street inlet shall be decreased with respect to the length of the inlet. Linearly applying a single-unit clogging factor to a multiple-unit inlet leads to an excessive increase in length.
With the concept of first-flush volume, the decay of clogging factor to curb opening length is described as (Guo 2000a):
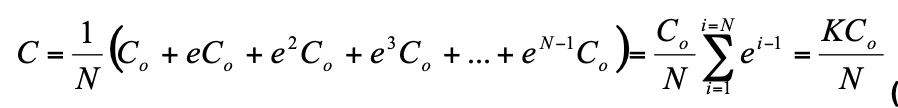 (Equation ST-29)
in which:
C= multiple-unit clogging factor for an inlet with multiple units
C0= single-unit clogging factor (50% - grate in a sump, 30% - combination in a sump, 20% - curb-opening in a sump, 25% - grate & combination on-grade)
e= decay ratio less than unity, 0.5 for grate inlet, 0.25 for curb-opening inlet
N= number of units
K= clogging coefficient from Table ST-8
Table ST-8 — Clogging Coefficients and Clogging Factor to apply to Multiple Units(UDFCD USDCM 2002)
| Grate Inlet | Curb Opening Inlet | Combination | ||||||||
N | K | C | K | C | K | C | ||||
1 | 1.00 | 0.50 | 1.00 | 0.20 | 1.00 | 0.30 | ||||
2 | 1.50 | 0.38 | 1.25 | 0.13 | ||||||
3 | 1.75 | 0.29 | 1.31 | 0.09 | ||||||
4 | 1.88 | 0.24 | 1.33 | 0.07 | ||||||
5 | 1.94 | 0.19 | 1.33 | 0.05 | ||||||
6 | 1.97 | 0.16 | 1.33 | 0.04 | ||||||
7 | 1.98 | 0.14 | 1.33 | 0.04 | ||||||
8 | 1.99 | 0.12 | 1.33 | 0.03 | ||||||
>8 | 2.00 | T.B.D. | 1.33 | T.B.D. | ||||||
Note: This table is generated by Equation ST-29 with e = 0.5 and e = 0.25.
The interception of an inlet on a grade is proportional to the inlet length, and in a sump is proportional to the inlet opening area. Therefore, a clogging factor shall be applied to the length of the inlet on a grade as:
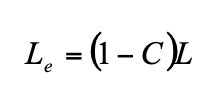 (Equation ST-30)
in which Le = effective (unclogged) length. Similarly, a clogging factor shall be applied to the opening area of an inlet in a sump as:
 (Equation ST-31)
in which:
Ae= effective opening area
A = opening area
2.4.1 Introduction
Locating (or positioning) stormwater inlets rarely requires design computations. Inlets are simply required in certain locations based upon street design/layout considerations, topography (sumps and flat longitudinal grades), and local ordinances. The one exception is that a combination of design computations are required to locate and space inlets on continuous grades. On long, continuous grades, stormwater flow increases as it moves down the gutter and picks up more drainage area. As the flow in the gutter increases, so does the spread. Since there is a specified range for spread (encroachment) allowed for specific street classes, inlets must be strategically placed to remove some of the stormwater from the street. Locating these inlets requires detailed design computations by the design engineer.
2.4.2 Design Considerations
The primary design consideration for the location and spacing of inlets on continuous grades is the spread limitation. This was addressed in Section 2.3. Table ST-1 lists pavement encroachment standards for minor storms in the City of Rogers.
Proper design of stormwater collection and conveyance systems makes optimum use of the conveyance capabilities of street gutters. In other words, an inlet is not needed until the spread reaches its allowable limit during the design storm (10-year frequency). To place an inlet prior to that point on the street is not economically efficient. To place an inlet after that point would violate the encroachment standards. Therefore, the primary design objective is to position inlets along a continuous grade at the locations where the allowable spread is about to be exceeded for the design storm.
Additionally, it is important to consider the type of inlet and its location when designing and positioning inlets. As outlined in Section 2.1 (Table ST-5), certain inlets (e.g., curb opening inlets) function better than others at avoiding clogging, while others are capable of efficiently capturing water over a wider range of grades (grated inlets). In order to achieve an economic design it is important to utilize the correct inlet type for the specific site constraints.
2.4.3 Design Procedure
Due to the complexity and steps involved in designing inlets, a step-by-step procedure is provided below to aid the design engineer. The steps are typical for most design instances, but may not represent every inlet design scenario. Because of this it is acceptable for the design engineer to veer from the order of the outline as shown below when needed. Additionally, the design spreadsheets and sample problems related to inlet design provide useful information and tools. The general steps for inlet design are:
- Place inlets at locations where they are required as a result of the roadway’s geometry and adjacent land features (i.e. low points in the gutter grade, median breaks, before intersections and crosswalks, etc.).
- Using Table ST-1 in Section 1.2 of this chapter, determine the encroachment limit for the type of street function and classification considered in the design.
- Based on the maximum encroachment limit determined in Step 2, the allowable street hydraulic capacity (peak flow rate in street and gutter) can be determined using Equation ST-11 or Equation ST-12.
- Equate the peak flow rate calculated in Step 3 to a hydrologic method that incorporates the area and characteristics of the drainage area. Through this relationship, the inlet under design can be positioned on the street so that it will serve a specific drainage area. Typically the Rational method is most often used to determine the requisite drainage area. The Rational method was discussed in Chapter 4 – Determination of Stormwater Runoff and is repeated here for convenience.
 (Equation ST-32)
in which:
Q= peak discharge (cfs)
C= runoff coefficient described in Table RO-2 and Table RO-3 of Chapter 4 – Determination of Stormwater Runoff
I= design storm rainfall intensity (in/hr) described in Table RO-5 of Chapter 4 – Determination of Stormwater Runoff
A= drainage area (acres)
The drainage area (A) will be the unknown variable to solve for in Equation ST-32. Runoff coefficient (C) and rainfall intensity (I) shall be determined as discussed in Chapter 4 – Determination of Stormwater Runoff of this Manual. Then, at the upstream end of the project drainage basin, outline a subarea that correlates to the peak flow rate outlined in Step 3 and the area parameter defined in this Step.
- Position an inlet along the street in a location that will prevent the allowable encroachment from being exceeded. The idea is to position the inlet at the location where the allowable encroachment is about to reach its allowable limit.
- Specify inlet type and size based on the grade and location where the inlet is to be placed, the amount and velocity of gutter flow, and the resulting spreads. The initial inlet specification (size and type) will be a best guess as the next step in the design process will be to evaluate the specified inlet. (Note: an iterative process is required to achieve an inlet design (type and size) that will satisfy the requirements needed for street drainage)
- Assess the hydraulic capacity of the inlet specified and calculate the inlet efficiency. Repeat Steps 6 and 7 as needed to achieve an inlet design that provides the desired inlet functionality at the location the inlet is required. Generally, an inlet will not capture all of the gutter flow. In fact, it is uneconomical to size an inlet (on continuous grades) large enough to capture all of the gutter flow. Instead, some carryover flow is expected.
- Position another inlet (if needed) along the street downstream from the first inlet to capture runoff from other local drainage areas until a complete system of inlets has been designed that satisfies the allowable street encroachment limit. Utilize the same steps as above while accounting for carryover from one inlet to the next. The gutter discharge for inlets, other than the first inlet, consists of the carryover from the upstream inlet plus the stormwater runoff generated from the intervening local drainage area. The resulting peak flow is approximate since the carryover flow peak and the local runoff peak do not necessarily coincide. The important concept to recognize here is that the carryover reduces the amount of new flow that can be picked up at the next downstream inlet.
- After a complete system of inlets has been established, modification should be made to accommodate special situations such as point sources of large quantities of runoff, and variation of street alignments and grades.
3.2.1 Inlets
Inlets are the most common stormwater runoff capturing device within a storm sewer system. Design of these structures was outlined in Section 2 of this chapter. As previously described, the primary function of inlets is to collect stormwater runoff to prevent flowing stormwater in streets from becoming a hazard to drivers as well as preventing flood damage to structures adjacent to areas where stormwater is collected.
3.2.2 Junction Boxes
Apart from inlets, junction boxes are the most common component in storm sewer systems. The main difference between inlets and junction boxes is that an inlet’s primary function is to collect stormwater runoff. Junction boxes on the other hand are purely for access and transition uses. Their primary functions include:
- Providing maintenance access.
- Providing ventilation.
- Serving as junctions when two or more pipes merge.
- Providing flow transitions for changes in pipe size, slope, and alignment.
Inlets serve in the above capacities as well with the added benefit of also collecting stormwater runoff.
3.2.3 Storm Sewer Pipe
Storm sewer piping is the conduit within the storm sewer system which conveys stormwater collected by inlets to an outlet. Storm sewer piping must be sized to work in conjunction with inlets so that the capacity of the storm sewer is consistent throughout all areas of its design. The sizing of storm sewer piping is described in this section and further analysis and design are provided herein.
3.2.4 Bends and Transitions
Bends and transitions are components utilized to facilitate a change in the alignment or size of storm sewer piping within a storm sewer system. Bends and transitions are an important component in minimizing energy losses within the system when transitions in alignment and size are needed. Bends and transitions without the use of a junction box are subject to City approval.
3.2.5 Outlets
Outlet structures are transitions from pipe flow into open channel flow or still water (e.g., ponds, lakes, etc.). The primary function of outlets is to control the flow and resulting force of stormwater exiting the storm sewer system in order to minimize the erosion potential in the receiving water body. Outlet designs are discussed in Chapter 7 – Culvert and Bridge Hydraulic Design; Section 6.0 – Outlet Protection. Additional information on designing outlets can be found in FHWA’s HEC-11 (1989) and HEC-14 , 3rd Ed. (2006).
3.3.1 Storm Sewer Pipe
3.3.1.1 Design Storm Accommodation
Closed storm sewers for all conditions, other than required for major drainage ways as discussed in Chapter 7 – Culvert and Bridge Hydraulic Design, shall be designed to accommodate the 10-year design storm, based on the stormwater runoff collected and conveyed by the storm sewer system. Accommodating the design storm means the storm sewer shall be sized to convey collected runoff without surcharging using approved drainage design practices within this Manual. All storm sewer shall be designed so that the hydraulic gradient is 2-foot below the ground surface (gutterline) for the entire length of the storm sewer run. The storm sewer shall also be designed so that it conveys at a maximum 80% full flow capacity during the 10-year design storm. Furthermore, all storm sewer must be able to manage the 100-year design storm runoff so that it is conveyed within the right-of-way or a drainage easement at all times and adjacent properties are protected from damage.
3.3.1.2 Size
Industry standard pipe sizes shall be used for all storm sewer piping within the system with no pipe being less than 18-inches in diameter. Pipe sizes generally increase in size moving downstream since the drainage area and corresponding stormwater flows increase. Do not discharge the contents of a larger pipe into a smaller one, even when the capacity of a smaller downstream pipe has sufficient capacity to handle the flow due to a steeper slope.
3.3.1.3 Material
Reinforced concrete pipe (RCP) shall be used in all right-of-way areas and under all traffic areas (including parking lots, driveways, etc.). All storm sewer pipe having a diameter or hydraulically equivalent pipe size diameter of 18-inches or greater must be RCP. RCP ASTM Class III shall be used in all areas unless otherwise required due to fill heights; use ARDOT standards to determine.
RCP shall conform to:
Circular Pipe – AASHTO M170/ASTM C76
Arch-shaped Pipe – AASHTO M206/ASTM C506
Elliptical Pipe – AASHTO M207/ASTM C507.
Corrugated metal pipe (CMP) [including smooth lined (SLCMP)] can only be used in situations where it is not draining off-site properties and must be approved by the City prior to its use. CMP up to 18-inches in diameter can be used in areas outside of the right-of-way and outside of City drainage easements. CMP shall not be used to convey water through a development from properties upstream and on properties where drainage structures are maintained by a residential POA. CMP shall have a minimum cover of 2-feet. CMP shall conform to shall conform to the following:
Galvanized Steel – AASHTO M218/ASTM A929; AASHTO M36/ASTM A760 and AASHTO Section 12/ASTM A796
Aluminized Steel Type 2 – AASHTO M274/ASTM A929; AASHTO M36/ASTM A760 and AASHTO Section 12/ASTM A796
Aluminum – AASHTO M197/ASTM B744; AASHTO M196/ASTM B745 and AASHTO Section 12/ASTM B790.
Corrugated polyethylene pipe (CPP) [including smooth lined (SLCPP)] can only be used in situations where it is not draining off-site properties and must be approved by the City prior to its use. CPP up to 18-inches in diameter can be used in areas outside of the right-of-way and outside of City drainage easements. CPP shall not be used to convey water through a development from properties upstream and on properties where drainage structures are maintained by a residential POA. CPP shall have a minimum cover of 2-feet. CPP shall conform to AASHTO M 294, Type S specification or ASTM F2648, ASTMD3350 and ASTMF2306. All pipe shall be installed per manufacturer’s specifications.
Reinforced concrete box (RCB), also includes three-sided boxes for these purposes, shall be structurally designed to accommodate earth and live load to be imposed upon the structure. Refer to the Arkansas Department of Transportation’s Reinforced Concrete Box Culvert Standard Drawings. When installed within public right of way, all structures shall be capable of withstanding minimum HL-93 loading.
3.3.1.4 Manning’s Roughness Coefficients
Manning’s roughness coefficients for storm drains are as follows on Table ST-9
Table ST-9 –– Manning’s Roughness Coefficients, n for Storm Drains
Materials of Construction | Design Manning Coefficient (n) |
|---|---|
Reinforced Concrete Pipe (and Reinforced Concrete Box) | 0.013 |
Corrugated Metal Pipe Plain or Coated Paved Invert Smooth lined | 0.024 0.020 0.012 |
Corrugated Polyethylene Pipe Plain Smooth lined | 0.021 0.012 |
Polyvinyl Chloridge (PVC) | 0.010 |
3.3.1.5 Shape
Approved storm sewer pipe shapes within the storm sewer system are circular, horizontal elliptical, and arch. Circular pipe is the preferred shape for storm sewer piping, however, where used, horizontal elliptical pipe or arch pipe sizes shall be hydraulically equivalent to the round pipe size. Reinforced concrete box culverts are an acceptable storm sewer conduit and shall be designed according to the same requirements and criteria as RCP storm sewer. Refer to Chapter 7 Culvert and Bridge Hydraulic Design for concrete box requirements.
3.3.1.6 Minimum Grades
Storm sewer piping shall operate with flow velocities sufficient to prevent excessive deposition of solid material; otherwise, clogging can result. Storm drains shall be designed to have a minimum flow velocity of 3.0-ft/sec when flowing under its 10-year design storm capacity. This velocity is accepted as producing scour potential when a storm sewer is flowing at its 10-year design storm capacity so that any deposition of solid material within the storm sewer will be cleaned out during the 10-year design storm. Grades for closed storm sewers and open paved channels shall be designed so that the velocity shall be no less than 3.0-ft/sec for the 10-year design storm capacity nor exceed 12-ft/sec for any design storm. The minimum slope for standard construction procedures shall be 0.40 percent. Any variance must be approved by the City Planning Commission.
3.3.2 Curb Inlet/Junction Boxes
Junction box (inlets, as a minimum, serve the same function as a junction box in most instances) locations are evaluated in the system prior to and in conjunction with pipe design. Most junction box locations are dictated by proper design practices. For example, junction boxes are required whenever there is a change in pipe size, alignment, slope, or where two or more pipes merge. Junction boxes are also required along straight sections of pipe for maintenance purposes. The distance between junction boxes is dependent on pipe size. The maximum spacing between junction boxes for various pipe sizes shall be in accordance with the Table ST-10.
Table ST-10 –– Inlet / Junction Box Spacing Based on Storm Sewer Pipe Size
Vertical Dimension of Pipe (and equivalent Box Culvert Height) (inches) | Maximum Distance Between Inlet / Junction Boxes and/or Cleanout Points (feet) |
|---|---|
18 to 36 | 400 |
42 and larger | 500 |
The invert of a pipe leaving a junction box shall be at least 0.1 foot lower than the incoming pipe to ensure positive low flows through the junction box. Whenever possible, match the crown of the pipe elevations when the downstream pipe is larger. All pipe shall be cut flush with the interior of the inlet / junction box and grouted to insure a smooth flow transition.
Approved sizes for junction boxes are 4 to 6 feet in interior diameter/width. Table ST-11 provides standard junction box sizing in accordance with the size of storm sewer pipe that will exit the structure. The widest dimension for horizontal elliptical or arch pipe shall be used when sizing a corresponding junction box. Larger junction boxes may be required when sewer alignments are not straight through or in cases where more than one pipe is connected to the junction box. In instances where more than one storm sewer line goes through a junction box the interior width of the junction box shall at a minimum provide 1-foot (min.) between each storm sewer pipe and 1-foot (min.) between the outside edge of the sewer pipe and interior wall of the junction box.
Manhole rings and lids for junction boxes and curb inlets shall be cast with the words “City of Rogers” and exhibit the fish logo. All rings and lids shall be heavy duty and traffic rated when located in traffic areas.
Table ST-11 –– Inlet / Junction Box Sizing
Storm Sewer Pipe Diameter at Outlet End (inches) | Inlet / Junction Box Interior Diameter / Width (feet) |
|---|---|
18 | 4 |
21 to 42 | 5 |
48 to 54 | 6 |
60 and larger | To be approved by City |
Multiple STS pipes entering structure | Provide 1-foot (min.) between each STS and 6-inches (min.) between the outside edge of the STS and interior wall of the inlet/junction box |
3.3.3 Bends and Transitions
Once storm sewers are sized and junction box locations are determined, the performance of the storm sewer system must be evaluated using energy grade line calculations starting at the downstream terminus of the system. As stormwater flows through the storm sewer system, it encounters many flow transitions. These transitions include changes in pipe size, slope, and alignment, as well as entrance and exit conditions. All of these transitions produce energy losses, usually expressed as head losses. These losses must be accounted for to ensure that inlets and junction boxes do not surcharge to a significant degree (i.e., produce street flooding). This is accomplished using hydraulic grade line (HGL) calculations as a check on pipe sizes and system losses. If significant surcharging occurs, the pipe diameters shall be increased. High tailwater conditions at the storm sewer outlet may also produce surcharging. This can also be accounted for using HGL calculations. Specific constraints for these items are discussed further in this section. Bends and transitions without the use of junction box are subject to City approval.
3.4.1 Peak Runoff Prediction
The Rational method is commonly used to determine the peak flows that storm sewers must be able to convey. It is an appropriate method due to the small drainage areas typically involved. It is also relatively easy to use and provides reasonable estimates of peak runoff. The total drainage area contributing flow to a particular storm sewer is often divided up into smaller subcatchments. The Rational Method is described in Chapter 3 – Determination of Stormwater Runoff of this Manual.
The first pipe in a storm sewer system is designed using Equation ST-32 to determine the peak flow. Downstream pipes receive flow from the upstream pipes as well as local inflows. The Rational equation applied to the downstream pipes is:
 (Equation ST-33)
(Equation RO-1)
in which:
I= design rainfall average intensity, over the time of concentration tc(in/hr)
n= number of subareas above the stormwater pipe
j = drainage subarea
Cj= runoff coefficient of subarea j
Aj= drainage area of subarea j(acres)
With respect to Equation ST-33, it is evident that the peak flow changes at each design point since the time of concentration, and thus the average intensity, changes at each design point. It is also evident that the time of concentration coming from the local inflow may differ from that coming from upstream pipes. Normally, the longest time of concentration is chosen for design purposes. If this is the case, all of the subareas above the design point will be included in Equation ST-33, and it usually produces the largest peak flow. In some cases, the peak flow from a shorter path may produce the greater peak discharge if the downstream areas are heavily developed. It is good practice to check all alternative flow paths and tributary areas to determine the tributary zone that produces the biggest design flow and use the largest peak discharge rate for storm sewer sizing.
3.5.1 Flow Equations and Storm Sewer Sizing
The size of closed storm sewers shall be designed so that their capacity will not be less than the flow rate computed using Manning’s equation. Even though storm sewer flow is usually unsteady and non-uniform, for design purposes it is assumed to be steady and uniform at the peak flow rate. This assumption allows for the use of Manning’s equation:
 (Equation ST-34)
in which:
Q= flow rate (cfs)
n= Manning’s roughness coefficient for storm drain (see Table ST-9)
A= flow area (ft2)
R= hydraulic radius (ft)
Sf= friction slope (normally taken as the storm sewer slope) (ft/ft)
For full flow in a circular storm sewer,
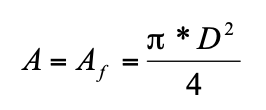 (Equation ST-35)
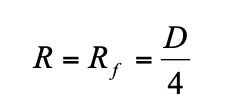 (Equation ST-36)
in which:
D= pipe diameter (ft)
Af= flow area at full flow (ft2)
Rf= hydraulic radius at full flow (ft)
If the flow is pressurized (i.e., surcharging at the inlets or junction boxes is occurring), Sf≠ So where So is the longitudinal bottom slope of the storm sewer. Design of storm sewers in Rogers assumes 80% full flow. This discharge, Qf, is calculated using:
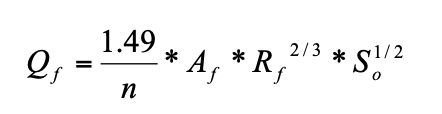 (Equation ST-37)
Storm sewers shall be sized to flow 80% full (i.e., as open channels using nearly the full capacity of the pipe) during the design storm (10-yr frequency). The design discharge is determined first using the Rational equation as previously discussed, then the Manning’s equation is used (with Sf= So) to determine the required pipe size. For circular pipes,
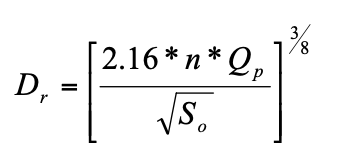 (Equation ST-38)
in which Dris the minimum size pipe required to convey the design flow and Qpis peak design flow.
The typical process for sizing storm sewer pipe proceeds as follows. Initial storm sewer sizing is performed first using the Rational equation (Equation ST-33) in conjunction with Manning’s equation (Equation ST-37). The Rational equation is used to determine the peak discharge that storm sewers must convey. The storm sewers are then initially sized using Manning’s equation assuming uniform, steady flow at the peak. Finally, these initial pipe sizes are checked using the energy equation by accounting for all head losses. If the energy computations detect surcharging at manholes or inlets, the pipe sizes are increased, and the process is repeated as necessary to obtain a solution where surcharging is avoided.
3.5.2 Energy Grade Line and Head Losses
Head losses must be accounted for in the design of storm sewers in order to find the energy grade line (EGL) and the hydraulic grade line (HGL) at any point in the system. The FHWA (1996) gives the following general equation as the basis for calculating the head losses at inlets and junction boxes (hLM, in feet):
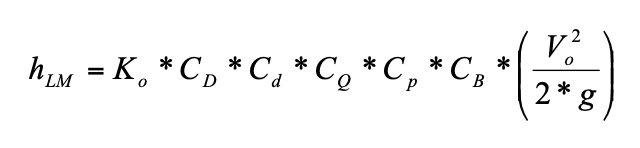 (Equation ST-39)
in which:
Ko = initial loss coefficient
Vo= velocity in the outflow pipe (ft/sec)
g= gravitational acceleration (32.2 ft/sec2)
CD, Cd, CQ, Cp, and CB= correction factors for pipe size, flow depth, relative flow, plunging flow and benching
However, this equation is valid only if the water level in the receiving inlet or junction box is above the invert of the incoming pipe. Otherwise, another protocol has to be used to calculate head losses at junction boxes. A modified FHWA procedure is provided that the design engineer can use to calculate the head losses and the EGL along any point in a storm sewer system.
The EGL represents the energy slope between the two adjacent junction boxes in a storm sewer system. A junction box may have multiple incoming storm sewers, but only one outgoing sewer. Each storm sewer and its downstream and upstream junction boxes form a “storm sewer-junction box”unit. The entire storm sewer system can be broken down into a series of “storm sewer-junction box” units that satisfy the energy conservation principle. The computation of the EGL does this by repeating the energy-balancing process for each “storm sewer-junction box” unit.
As illustrated in Figure ST-11, a “storm sewer-junction box”unit has four distinctive sections. Section 1 represents the downstream junction box, Section 2 is the point at the exit of the incoming storm sewer just as enters this junction box, Section 3 is at the entrance to this storm sewer at the upstream junction box, and Section 4 represents the upstream junction box. For each “storm sewer-junction box” unit, the head losses are determined separately in two parts as:
Friction losses through the storm sewer pipe, and juncture losses at the junction box.
Calculation of the EGL through each “storm sewer-junction box” unit is described in the following sections.
In cases where a downstream tailwater condition may exist for which there is no information, e.g. discharging into an existing storm sewer system or ditch, it shall be assumed that the existing pipe or ditch is flowing full for the design storm event.
3.5.2.1 Losses at the Downstream Junction Box—Section 1 to Section 2
The continuity of the EGL is determined between the flow conditions at centerline of the downstream junction box, Section 1, and the exit of the incoming storm sewer, Section 2, as illustrated in Figure ST-11 and an idealized EGL and HGL profiles in Figure ST-12.
At Section 2 there may be pipe-full flow, critical/supercritical open channel flow, or sub-critical open channel flow. If the storm sewer crown at the exit is submerged, the EGL at the downstream junction box provides a tailwater condition; otherwise, the junction box drop can create a discontinuity in the EGL. Therefore, it is necessary to evaluate the two possibilities, namely:
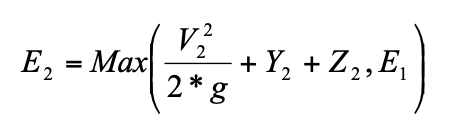 (Equation ST-40)
in which:
E2= EGL at Section 2
V2= storm sewer exit velocity (ft/sec)
Y2= flow depth at the storm sewer exit (feet)
Z2= invert elevation at the storm sewer exit (feet)
E1= tailwater at Section 1 (feet)
Equation ST-40 states that the highest EGL value shall be considered as the downstream condition. If the junction box drop dictates the flow condition at Section 2, a discontinuity is introduced into the EGL.
Figure ST-11 — A Storm Sewer-Junction Box Unit (UDFCD USDCM 2002)
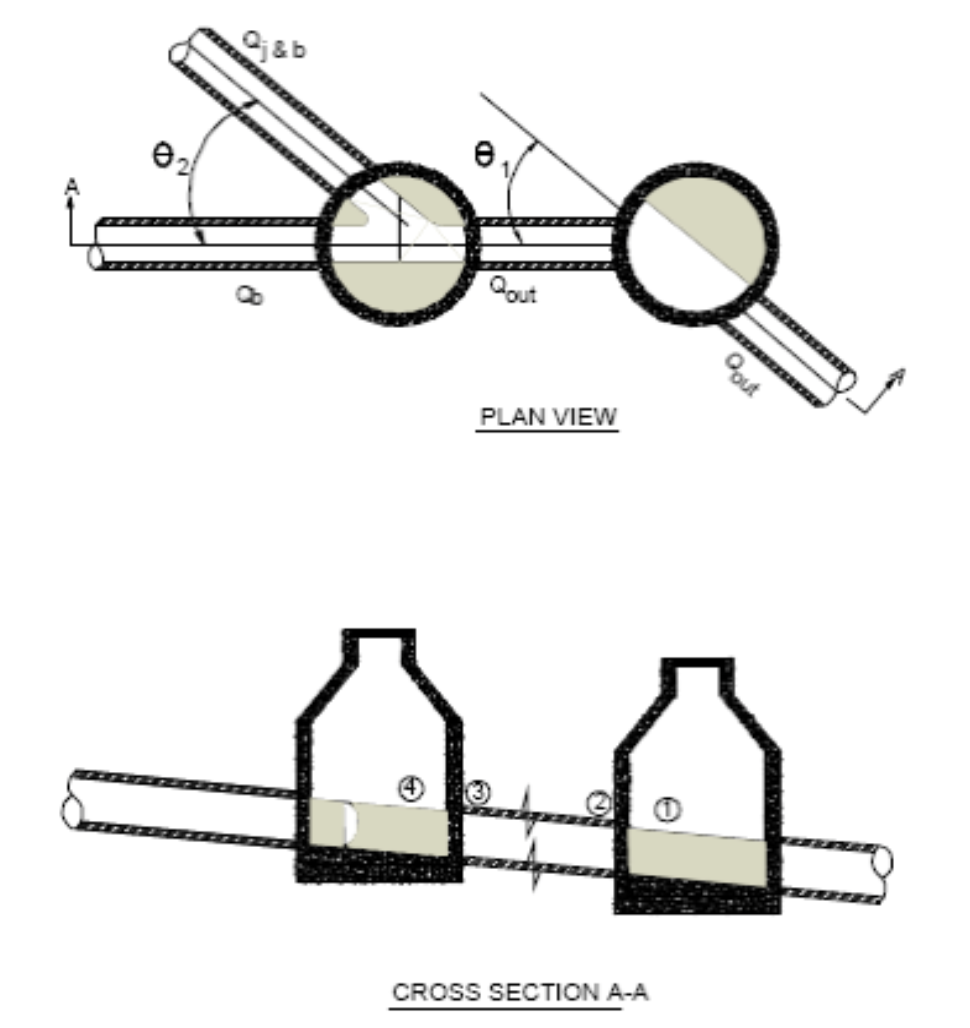
Figure ST-12 — Hydraulic and Energy Grade Lines (UDFCD USDCM 2002)
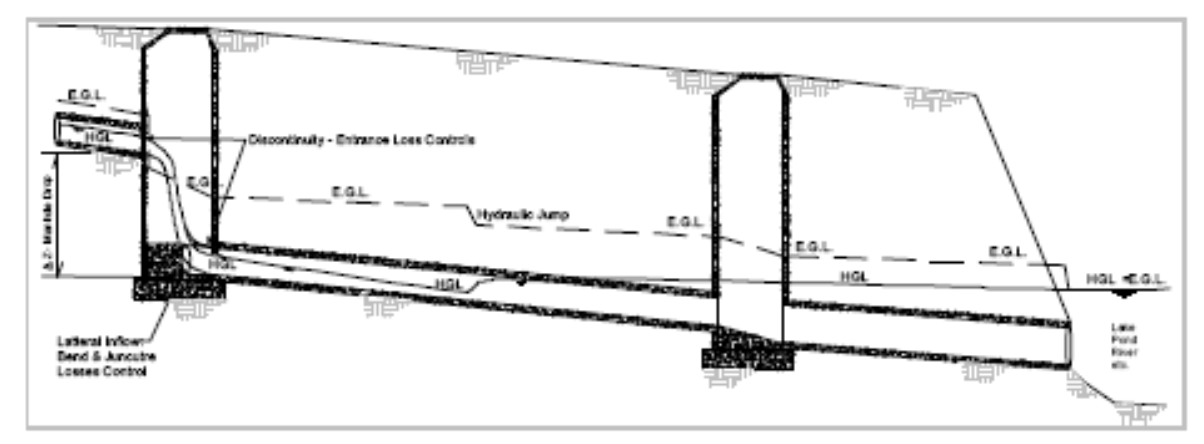
3.5.2.2 Losses in the Pipe, Section 2 to Section 3.
The continuity of the EGL upstream of the junction box depends on the friction losses through the storm sewer pipe. The flow in the storm sewer pipe can be one condition or a combination of open channel flow, full flow, or pressurized (surcharge) flow.
When a free surface exists through the pipe length, the open channel hydraulics apply to the backwater surface profile computations. The friction losses through the storm sewer pipe are the primary head losses for the type of water surface profile in the storm sewer. For instance, the storm sewer pipe carrying a subcritical flow may have an M-1 water surface profile if the water depth at the downstream junction box is greater than normal depth in the storm sewer or an M-2 water surface profile if the water depth in the downstream junction box is lower than normal depth. Under an alternate condition, the pipe carrying a supercritical flow may have an S-2 water surface profile if the pipe entering the downstream junction box is not submerged; otherwise, a hydraulic jump is possible within the storm sewer.
When the downstream storm sewer crown is submerged to a degree that the entire storm sewer pipe is under the HGL, the head loss for this full flow condition is estimated by pressure flow hydraulics.
When the downstream storm sewer crown is slightly submerged, the downstream end of the storm sewer pipe is surcharged, but the upstream end of the storm sewer pipe can have open channel flow. The head loss through a surcharge flow depends on the flow regime. For a subcritical flow, the head loss is the sum of the friction losses for the full flow condition and for the open channel flow condition. For a supercritical flow, the head loss may involve a hydraulic jump. To resolve which condition governs, culvert hydraulic principles can be used under both inlet and outlet control conditions and the governing condition is the one that produces the highest HGL at the upstream junction box.
Having identified the type of flow in the storm sewer pipe, the computation of friction losses begins with the determination of friction slope. The friction loss and energy balance are calculated as:
 (Equation ST-41)
 (Equation ST-42)
in which:
hf= friction loss
L= length of storm sewer pipe (feet)
Sf= friction slope in the pipe (ft/ft)
E3= EGL at the upstream end of storm sewer pipe (feet)
3.5.2.3 Losses at the Upstream Junction Box, Section 3 to Section 4
Additional losses may be introduced at the storm sewer entrance. Based on the general head loss equation shown in Equation ST-39, the general formula to estimate the entrance loss is:
 (Equation ST-43)
in which:
hE= entrance loss (feet)
V= pipe-full velocity in the incoming storm sewer (ft/sec)
KE= entrance loss coefficient (see Table ST-12)
In the modeling of storm sewer flow, the storm sewer entrance coefficients can be assumed to be part of the bend loss coefficient.
The energy principle between Sections 3 and 4 is determined by:
 (Equation ST-44)
in which E4= EGL at Section 4.
Table ST-12 — Entrance Loss Coefficients for Outlet Control, Full or Partly Full Flow
(FHWA – HDS-5 2005)
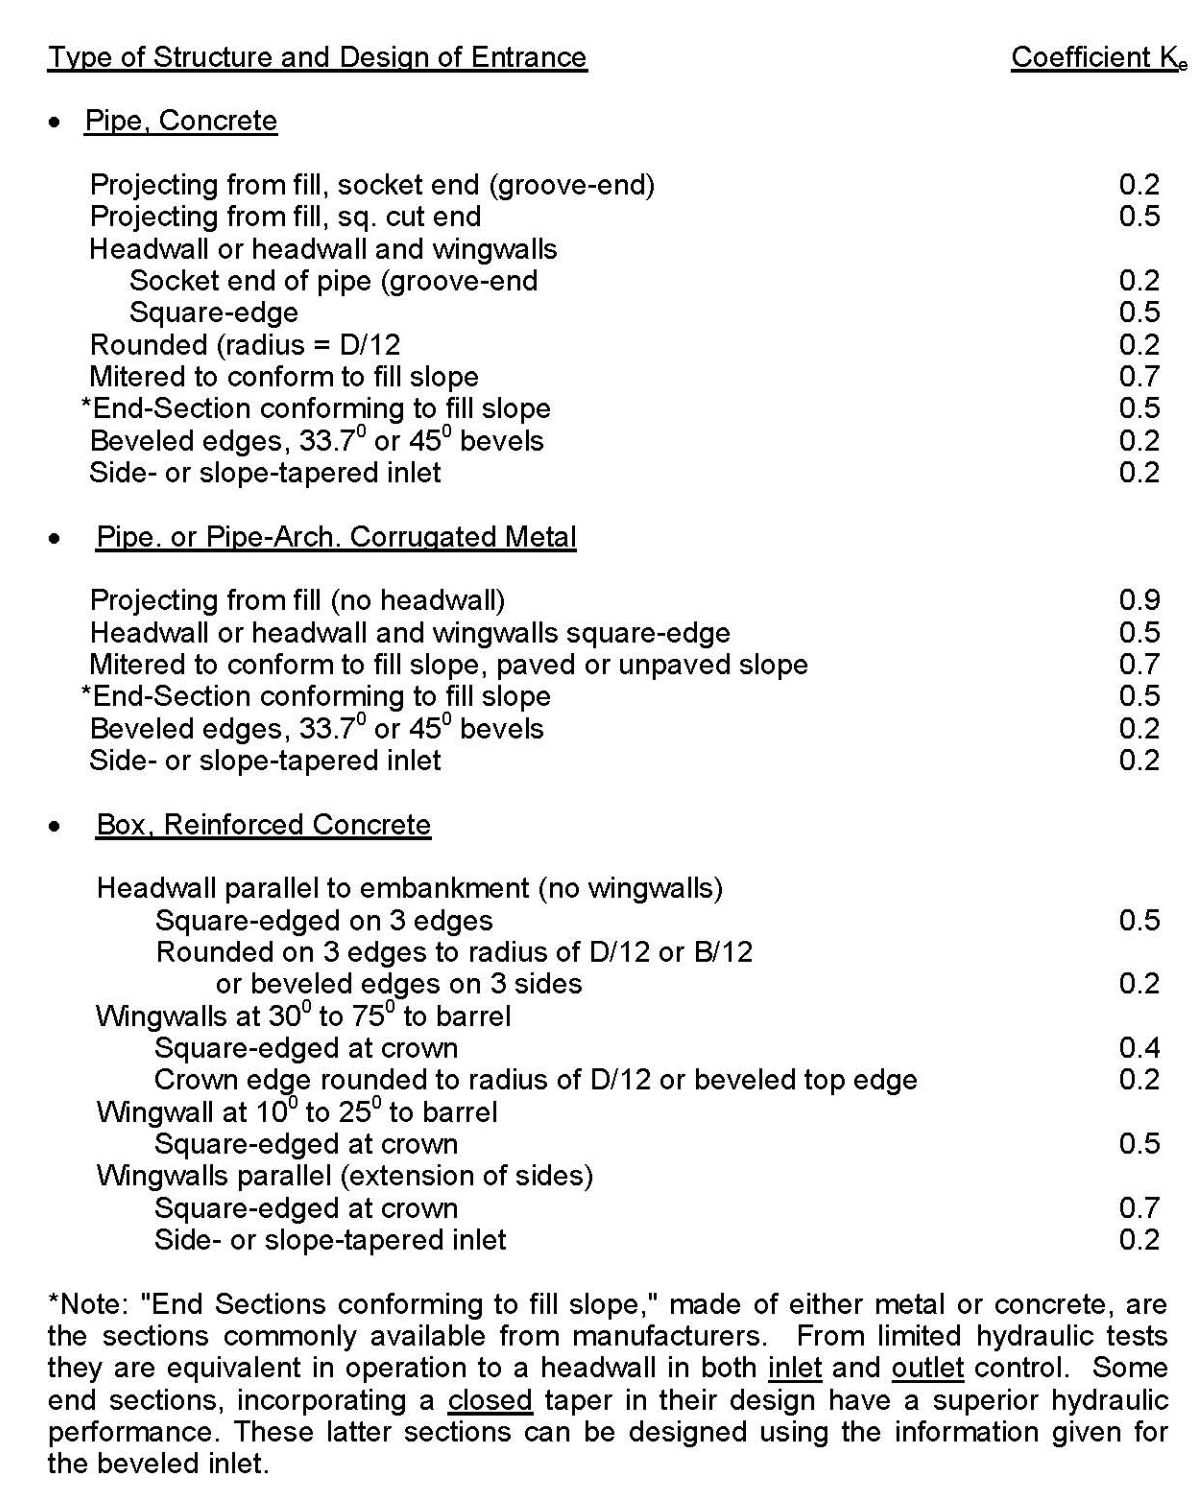
3.5.2.4 Juncture and Bend Losses at the Upstream Junction Box, Section 4 to Section 1
The analysis from Section 4 of the downstream “storm sewer-junction box” unit to Section 1 of the upstream “storm sewer-junction box”unit consists only of juncture losses through the junction box. To maintain the conservation of energy through the junction box, the outgoing energy plus the energy losses at the junction box have to equal the incoming energy. Often a junction box is installed for the purpose of maintenance, deflection of the storm sewer line, change of the pipe size, and as a juncture for incoming laterals. Although there are different causes for juncture losses, they are often, rightly or wrongly, considered as a minor loss in the computation of the EGL. These juncture losses in the storm sewer system are determined solely by the local configuration and geometry and not by the length of flow in the junction box.
3.5.2.4.1 Bend/Deflection Losses
The angle between the incoming sewer line and the centerline of the exiting main storm sewer line introduces a bend loss to the incoming storm sewer. Based on the general head loss equation shown in Equation ST-39, bend loss is estimated by:
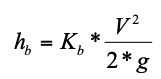 (Equation ST-45)
in which:
hb= bend loss (feet)
V= full flow velocity in the incoming storm sewer (ft/sec)
Kb= bend loss coefficient
As shown in Figure ST-13 and Table ST-13, the value of Kbdepends on the angle between the exiting storm sewer line and the existence of junction box bottom shaping. A shaped junction box bottom or a deflector guides the flow and reduces bend loss. Figure ST-14 illustrates four cross-section options for the shaping of a junction box bottom. Only sections “c. Half” and “d. Full” can be considered for the purpose of using the bend loss coefficient for the curve on Figure ST-13 labeled as “Bend at Manhole, Curved or Shaped.”
Because a junction box may have multiple incoming storm sewer lines, Equation ST-45 shall be applied to each incoming storm sewer line based on its incoming angle, and then the energy principle between Sections 4 and 1 is calculated as:
 (Equation ST-46)
3.5.2.4.2 Lateral Juncture Losses
In addition to the bend loss, the lateral juncture loss is also introduced because of the added turbulence and eddies from the lateral incoming flows. Based on the general head loss equation shown in Equation ST-39, the lateral juncture loss is estimated as:
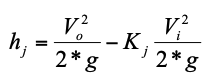 (Equation ST-47)
in which:
hj= lateral loss (feet)
Vo= full flow velocity in the outgoing storm sewer (ft/sec)
Kj= lateral loss coefficient
Vi= full flow velocity in the incoming storm sewer (ft/sec)
In modeling, a manhole can have multiple incoming storm sewer lines, one of which is the main (i.e., trunk) line, and one outgoing storm sewer line (see Figure ST-11). As shown in Table ST-13, the value of Kjis determined by the angle between the lateral incoming storm sewer line and the outgoing storm sewer line.
Table ST-13 — Bend Loss and Lateral Loss Coefficients (FHWA – HEC-22 2001)
Angle in Degree (0) | Bend Loss Coefficient (Kb) for Curved Deflector in the Junction Box | Bend Loss Coefficient (Kb) for Non-shaping Junction Box | Lateral Loss Coefficient (Kj) on Main Line Storm Sewer |
|---|---|---|---|
Straight Through | 0.05 | 0.05 | Not Applicable |
22.50 | 0.10 | 0.13 | 0.75 |
45.00 | 0.28 | 0.38 | 0.50 |
60.00 | 0.48 | 0.63 | 0.35 |
90.00 | 1.01 | 1.32 | 0.25 |
Angles greater than 90.00 are not allowed. | |||
At a junction box, the engineer needs to identify the main incoming storm sewer line (the one that has the largest inflow rate) and determine the value of Kjfor each lateral incoming storm sewer line. To be conservative, the smallest Kjis recommended for Equation ST-47, and the lateral loss is to be added to the outfall of the incoming main line storm sewer as:
 (hjis applied to the main storm sewer line only) (Equation ST-48)
The difference between the EGL and the HGL is the flow velocity head. The HGL at a junction box is calculated by:
 (Equation ST-49)
The energy loss between two junction boxes is defined as:
 (Equation ST-50)
in which ΔE= energy loss between two junction boxes. It is noted that ΔEincludes the friction loss, juncture loss, bend loss, and junction box drop.
3.5.2.5 Transitions
In addition to “storm sewer-junction box”unit losses, head losses in a storm sewer can occur due to a transition in the pipe itself, namely, gradual pipe expansion. Based on the general head loss equation shown in Equation ST-39, transition loss, hLE, in feet, can be determined using:
 (Equation ST-51)
in which Keis the expansion coefficient and subscripts 1 and 2 refer to upstream and downstream of the transition, respectively. The value of the expansion coefficient, Ke, may be taken from Table ST-14 for free surface flow conditions in which the angle of cone refers to the angle between the sides of the tapering section (see Figure ST-15).
Table ST-14 — Head Loss Expansion Coefficients (Ke) in Non-Pressure Flow (FHWA – HEC-22 2009)
D2/D1 | Angle of Cone | ||||||||||||||
|---|---|---|---|---|---|---|---|---|---|---|---|---|---|---|---|
| 10° | 20° | 45° | 60° | 90° | 120° | 180° | |||||||||
1.5 | 0.17 | 0.40 | 1.06 | 1.21 | 1.14 | 1.07 | 1.00 | ||||||||
3 | 0.17 | 0.40 | 0.86 | 1.02 | 1.06 | 1.04 | 1.00 | ||||||||
This Manual does NOT allow pipe contractions within new storm sewers. The following table is provided for evaluating existing storm sewers where contractions may be present.
Table ST-15 — Typical Values for Sudden Pipe Contractions (Kc) (FHWA – HEC-22 2009)
D2/D1 | Kc |
|---|---|
0.2 | 0.5 |
0.4 | 0.4 |
0.6 | 0.3 |
0.8 | 0.1 |
1.0 | 0.0 |
D2/D1 = Ratio of diameter of smaller pipe to large pipe. | |
3.5.2.6 Curved Storm Sewers
Curved storm sewers shall not be used unless specifically approved by City. Derived from the general head loss equation shown in Equation ST-39, head losses due to curved storm sewers (sometimes called radius pipe), hLr, in feet, can be determined using:
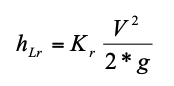 (Equation ST-52)
in which Kr= curved storm sewer coefficient from Figure ST-13.
3.5.2.7 Losses at Storm Sewer Exit
Derived from the general head loss equation shown in Equation ST-39, head losses at storm sewer outlets, hLO, are determined using:
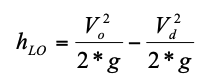 (Equation ST-53)
in which Vois the velocity in the outlet pipe, and Vdis the velocity in the downstream channel. When the storm sewer discharges into a reservoir or into air because there is no downstream channel, Vd = 0 and one full velocity head is lost at the exit.
Figure ST-13 — Bend Loss Coefficients (UDFCD USDCM 2002)
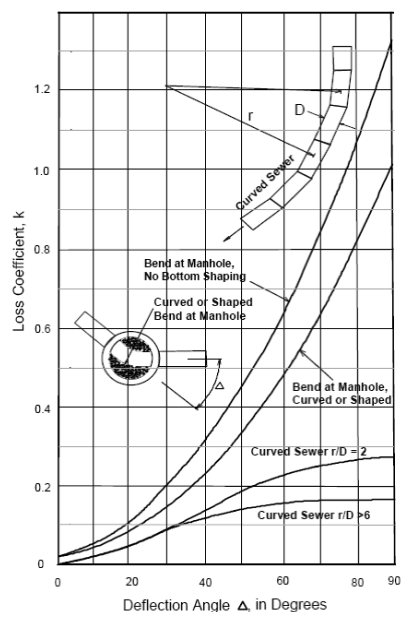
Figure ST-14 — Access Hole Benching Methods (UDFCD USDCM 2002)
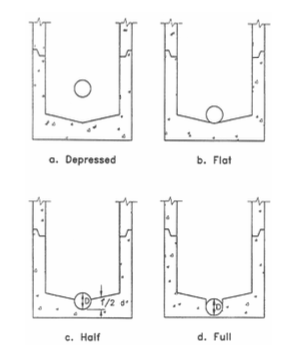
Figure ST-15 — Angle of Cone for Pipe Diameter Changes (FHWA HEC-22 2009)
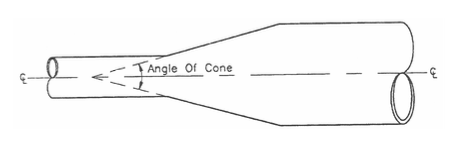
4.0 REFERENCES
Akan, A.O. and R.J. Houghtalen. 2002. Urban Hydrology, Hydraulics, and Water Quality. Upper Saddle River, NJ: Prentice Hall. Forthcoming.
American Association of State Highway and Transportation Officials (AASHTO). 1992. Volume 9, Highway Drainage Guidelines, Storm Drainage System.
American Association of State Highway and Transportation Officials, 1991. Model Drainage Manual.
Denver Regional Council of Governments (DRCOG). 1969 (Rev. 1984). Urban Storm Drainage Criteria Manual (USDCM). Denver, CO.
Federal Highway Administration (FHWA). 1986. Bridge Deck Drainage Guidelines. FHWA Report No. RD-014. Washington, DC: Federal Highway Administration.
Federal Highway Administration. 1961. Design Charts for Open-Channel Flow. Hydraulic Design Series No. 3 (HDS-3). Washington, DC: Federal Highway Administration.
Federal Highway Administration. 1984. Drainage of Highway Pavements. Hydraulic Engineering Circular No. 12 (HEC-12). McLean, VA: Federal Highway Administration.
Federal Highway Administration. 1993. Design of Bridge Deck Drainage. Hydraulic Engineering Circular No. 21 (HEC-21). Washington, DC: Federal Highway Administration.
Federal Highway Administration. 2001. Urban Drainage Design Manual. Hydraulic Engineering Circular No. 22 (HEC-22), Second Edition. Washington, DC: Federal Highway Administration.
Guo, J.C.Y. 1992. Technical Manual for Computer Model UDSEWER for Storm Sewer System Design. Denver, CO: Department of Civil Engineering, University of Colorado at Denver.
Guo, J.C.Y. 1998a. Storm Sewer System Design and Flow Analysis Using the Personal Computer Model UDSEWER. Denver, CO: Urban Drainage and Flood Control District.
Guo, J.C.Y. 1998b. Street Hydraulics and Inlet Sizing Using the Computer Model UDINLET. Denver, CO: Urban Drainage and Flood Control District.
Guo, J.C.Y. 1999. Storm Water System Design. CE 5803, University of Colorado at Denver.
Guo, J.C.Y. 2000a. Design of Grate Inlets with a Clogging Factor. Advances in Environmental Research 4(3)181-186.
Guo, J.C.Y. 2000b. Street Storm Water Conveyance Capacity. Journal of Irrigation and Drainage Engineering 136(2)119-124.
Guo, J.C.Y. 2000c. Street Storm Water Storage Capacity. Journal of Water Environment Research, Vol. 27, No. 6. Sept/Oct.
Guo, J.C.Y. 2006. Urban Hydrology and Hydraulic Design. Highlands Ranch, CO: Water Resources Publications, LLC.
Virginia Department of Transportation (VDOT). 2002. Drainage Manual, 4th Edition. Commonwealth of Virginia. Location and Design Division: Hydraulics Section
Wright-McLaughlin Engineers. 1969. Urban Storm Drainage Criteria Manual. Prepared for the Denver Regional Council of Governments. Denver, CO: Urban Drainage and Flood Control District.
Pavement and Geometric Design Criteria for Minimizing Hydroplaning. FHWA Report No. RD-79-31, December 1979
Dah-Chen Wood. Public Roads, Vol. 52, No. 2, Bridge Drainage System Needs Criteria. U. S. Department of Transportation, September 1988
Federal Highway Administration. 1979. Design of Urban Highway Drainage. Washington, DC: Federal Highway Administration.
3.0 STORMWATER DETENTION DESIGN OBJECTIVES
Post-project peak flow rates
- Onsite detention facilities must be designed so that peak flow rates for post-project conditions are limited to a maximum of pre-project levels for the 1-year, 2-year, 5-year, 10-year, 25-year, 50-year and 100-year events. A multi-frequency outlet design approach is required.
- Onsite detention facilities, other than wet retention basins, must be designed so that the 100-year event’s runoff is detained for a minimum of 24 hours and released before reaching 72 hours after the peak of the rain event.
- The requirements of Chapter 9 – Water Quality shall be followed; the calculated Water Quality Capture Volume (WQCV) must be added to the 100-year storage volume of the facility.
Low-flow orifice - Designed to discharge at the 1-year peak flow rate; it shall be a minimum of 2 inches in diameter.
Spillways must be designed to convey 100-year runoff - Overflow spillways for detention facilities must permit the passage of the runoff from the 100-year event, based on fully urbanized conditions for the entire tributary watershed with no upstream detention. A freeboard of 1 foot must be provided for the 100-year event design flows. If downstream safety considerations warrant, it may be necessary to size a spillway for greater than a 100-year event.
Trash racks – Trash racks are required; refer to Chapter 9 – Water Quality for design guidance.
Public Safety
- Wet detention facilities shall have a 15’ wide safety bench with a 10:1 slope just below the normal water surface elevation or provide a 48-inch tall wrought-iron style fence, or approved equal.
Other design considerations – Section 6.0 of this chapter addresses multiple other aspects of detention pond design, including, but not limited to: pond linings, outlet works, vegetation, operations and maintenance, and environmental permitting.
Easements
- Easements are required for all detention facilities (public and private), drainage structures (including swales) and for flows leaving the site. A determination of the need for off-site drainage easements will be made by the City using the recommendations of the design engineer as stated in the drainage study which shall take into account site specific conditions and the history of the site.
- If it is not possible to access a facility (such as a detention pond) through the drainage easement, an access easement shall be provided.
- Any drainage structure which carries water from one lot only is not required to be in an easement.
- The standard width for a drainage easement shall be 30 feet or 5 feet each side of the maintenance road and top of bank, whichever is greater.
- All drainage easements shall be dedicated as Drainage and Recreation Easements.
4.0 TYPES OF DETENTION FACILITIES
Type of Detention Facilities
- Dry Detention Basin – These facilities are for flood control only and drain within 24 to 48 hours.
- Extended Detention Basin – These facilities are for pollutant removal, potentially flood control and drain within 24 to 72 hours.
- Wet Basin – These facilities are for pollutant removal, flood control and often aesthetics. These facilities will be required to detain runoff for 12 to 48 hours.
- Permeable Pavers – These facilities are for pollutant removal, potentially flood control and drain within 24 to 72 hours.
- Off-line storage is the preferred method in the City of Rogers. In-line storage is allowed at the City’s discretion if it can be demonstrated that off-line storage is not practicable.
5.0 HYDROLOGIC AND HYDRAULIC DESIGN
Detention Volume Design
- Simplified (Modified FAA) Method – May be used if detention volume is less than 20,000 ft3.
- Hydrograph Methods – May be used for any detention volume. The Modified Puls method is the recommended procedure.
6.0 OTHER DESIGN CONSIDERATIONS
Detention Basin Grading
- Provide a detention pond profile in the plan set. Shall show 100 year WSE and normal WSE (if applicable).
- Maximum side slopes of 3:1 (H:V); side slopes of 5:1 are preferred
- The pond bottom shall have a minimum 1% slope for dry detention basins.
- The minimum length to width ratio shall be 2:1.
- Provide an emergency spillway
- Embankment design height shall be increased by 5% to account for settling.
- Optional forebays should be considered when design volume exceeds 20,000 ft3.
- USGS Type C staff gauges are required to be installed on the outlet works.
- Trash racks are required.
- Dry detention basins are required to be solid sodded up to the top of bank. Wet retention basins shall be sodded from the top of bank to the normal water surface elevation.
- Plantings will be provided within dry detention basins per a planting plan submitted and approved prior to issuance of a Land Disturbance Permit.
- Retention ponds shall have a safety bench and/or a safety fence.
- An all-weather, driving surface is required for access.
- Wet retention ponds shall have a permanent pool minimum depth of 6 feet.
- Any pond’s top of bank must be at least 20 feet away from a structure’s foundation.
- Drainage facilities will not be permitted in FEMA delineated Special Flood Hazard Areas (SFHAs) or other high-risk areas.
- Compensatory storage cut, drainage facilities or other water quality BMPs are not permitted at an elevation lower than the flow line of an adjacent SFHA or other high-risk area.
- Excavation for compensatory storage shall not result in a berm being established between the storage volume and the primary channel.
- A geotechnical report is required on all embankments over 10 feet and may be required by the City for embankments between 5 feet and 10 feet.
APPENDIX
Fee In-Lieu-of Detention
- For sites that are 1-acre in size or smaller, for sites that are being redeveloped, or for sites of any size that are adjacent to a primary channel.
- The City shall determine if fee-in-lieu will be allowed.
- The fee in-lieu of detention rate is set at $0.20/ft2 of impervious area on developments that are approved for fee in-lieu.
Table DET-1 Acceptable Detention Design Methods
Detention Design Method | Acceptable Volume (cubic feet [ft3]) | Acceptable Watershed Area |
|---|---|---|
Simplified (Modified FAA) Method (Section 5.1.1) | <20,000 ft3 | < 30 acres |
Hydrograph Methods (Section 5.1.2) | Any size | ≥ 30 acres |
5.1.1 Modified FAA Rational-Based Method - For Detention Volume Less than 20,000 ft3
For onsite detention volumes of less than approximately 20,000 ft3 (this typically corresponds to developments with less than approximately 5 acres of residential development or less than 2.5 acres of commercial development), an acceptable simplified method of detention design is the Rational Method-based FAA Method (1966), as modified by Guo (1999a). This method can be used for: 1) multiple design events for a site to determine storage requirements for various return intervals, or 2) initial sizing of detention storage volumes whenever a detailed hydrograph routing design method is used.
The inputs required for the Modified FAA volume calculation procedure include:
A = Area of the catchment tributary to the storage facility (acres)
C= Runoff coefficient (unitless)
Qpo = Allowable maximum peak outflow rate from the detention facility based on pre-project conditions or City-approved master plan release rates (cfs)
tc = Time of concentration for the tributary catchment (see Chapter 3 – Determination of Stormwater Runoff) (minutes)
i = Rainfall intensity corresponding to tc for relevant return frequency storms(as determined from the intensity-duration-frequency table in Chapter 3 – Determination of Stormwater Runoff) (in/hr)
As shown by example in Section 7.1, the calculations are best set up in a tabular (spreadsheet) form (see Table DET-3). Each time increment (typically 5 minutes) is entered in rows, and the following variables are entered or calculated in each column:
- Storm Duration Time - (t) (minutes), up to 180 minutes. For longer durations, a hydrograph-based method is required.
- Rainfall Intensity – (i) (inches per hour), based on the intensity-duration-frequency table (Table RO-5) in Chapter 3 – Determination of Stormwater Runoff.
- Inflow volume – (Vi) (ft3), calculated as the cumulative volume at the given storm duration using the equation:
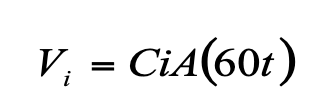 (Equation DET-1)
 - Outflow adjustment factor – (m) (Guo 1999a):
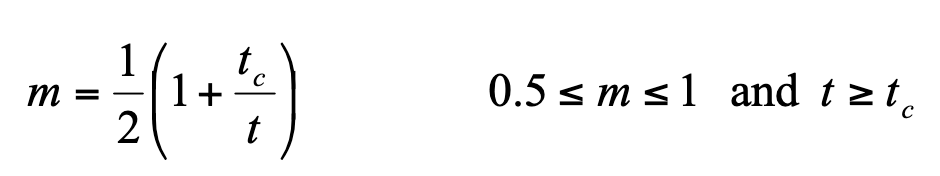 (Equation DET-2)
 - Calculated average outflow rate – (Qav)(cfs), over the duration t:
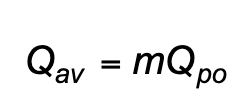 (Equation DET-3)
 - Calculated outflow volume – (Vo) (ft3), during the given duration and the adjustment factor at that duration calculated using the equation:
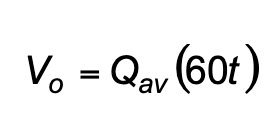 (Equation DET-4)
 - Required storage volume – (Vs) (ft3), calculated using the equation:
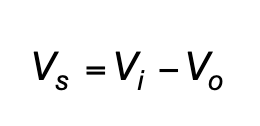 (Equation DET-5)
The value of Vs increases with time, reaches a maximum value, and then starts to decrease. The maximum value of Vs is the required storage volume for the detention facility.
Notes regarding the Rational Formula-Based Modified FAA Method
- The Rational Formula Based Modified FAA Method may be used to find an initial storage volume for any size watershed. This technique for initial detention sizing yields best results when the tributary watershed area is less than 30 acres, but can be applied to larger watersheds, although the final design volumes may need to be adjusted significantly.
- If the Modified FAA Method is used and it is determined that the required storage volume is greater than 20,000 ft3, then a hydrograph method shall be used to determine the basin storage requirements (see Section 5.1.2 for hydrograph methods).
- Because the FAA Method calculates the required detention volume only, methods described in Section 5.2 must be used to design the outlet works.
5.1.2 Hydrograph Methods - For Detention Volume Greater than 20,000 ft3
For detention volumes greater than 20,000 ft3 (typically 5 acres or more of residential development or 2.5 acres or more of commercial development) the designer must use the hydrograph sizing procedures described in this section.
5.1.2.1 Hydrograph Volumetric Method – for Estimating Detention Volume
To make an initial estimate of the required storage volume for a detention facility of more than 20,000 ft3, the Hydrograph Volumetric Method can be used to measure the difference between the inflow hydrograph and the proposed outflow hydrograph (i.e., the desired maximum release rates for the facility). This technique assumes that the required detention volume is equal to the difference in volume between the inflow hydrograph and the simplified outflow hydrograph. This is represented by the area between those two hydrographs from the beginning of a runoff event until the time that the allowable release occurs on the recession limb of the inflow hydrograph (Guo 1999b) (see Figure DET-1).
Generally, the inflow hydrograph is obtained from a hydrograph method using the Huff distribution presented in Chapter 3 – Determination of Stormwater Runoff. The outflow hydrograph can be approximated using a straight line between zero at the start of the runoff to a point where the allowable discharge is on the descending limb of the inflow hydrograph, Tp.
Figure DET-1 Hydrograph Volumetric Method of Detention Volume Sizing
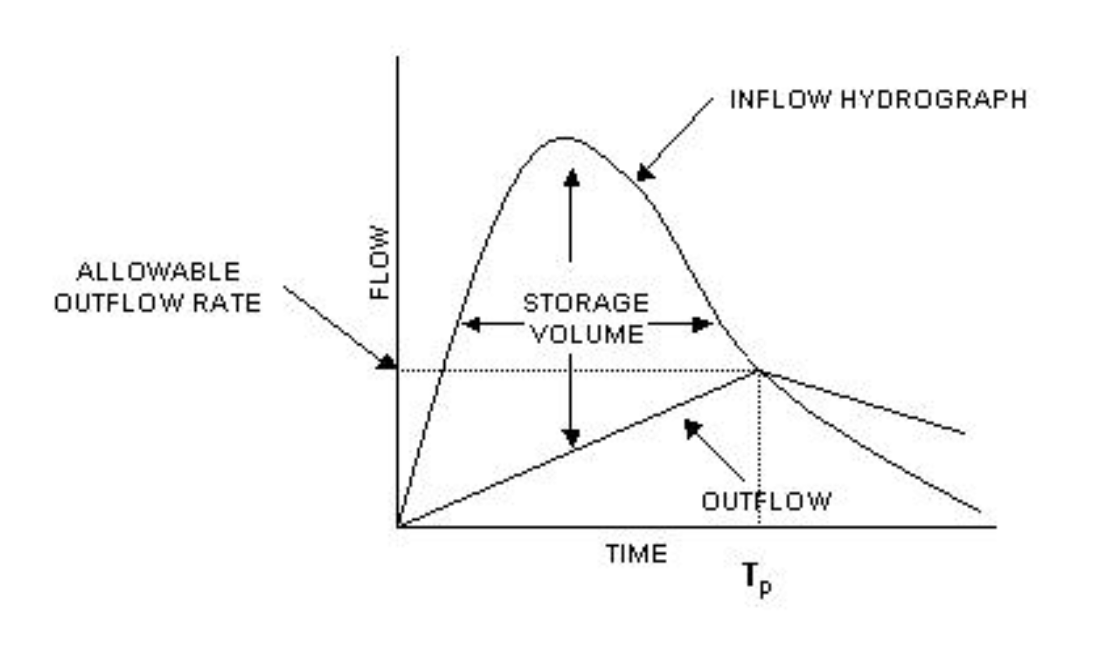
The volume can be calculated by setting up tabular calculations, as shown by example in Table DET-4 (see Section 7.2). Descriptions of the variables in the table columns include:
- Time - (T) (minutes), from 0 to Tp in uniform increments. Time increments (Δt) of 5 minutes are typically used. Tp is the time (in minutes) where the descending limb of the inflow hydrograph is equal to the allowable release rate.
- Inflow rate - (Qi) (cfs), to the detention basin corresponding to the time T. The inflow rate can be obtained using the SCS Unit Hydrograph Method with the Huff distribution presented in Chapter 3 – Determination of Stormwater Runoff.
- Outflow rate – (Qo) (cfs), calculated as:
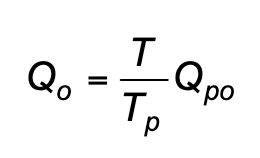 (Equation DET-6)
In which: Qpo = the peak outflow rate. The allowable peak outflow rate is determined from City criteria or a City-approved master plan. - Incremental Storage Volume - (Vs) (acre-feet), calculated as:
 (Equation DET-7)
 - Total cumulative storage volume – (acre-feet), calculated as the sum of the incremental storage volumes:
 (Equation DET-8)
5.1.2.2 Modified Puls Method – For Design of Detention Facilities
To design detention facilities larger than 20,000 ft3, the Modified Puls method is recommended for reservoir routing for detention facility design. This reservoir routing method calculates an outflow hydrograph for a detention facility based on a given inflow hydrograph and the storage-outflow characteristics of a facility. This method is typically implemented using computer programs such as HEC-HMS, TR-20 or proprietary software packages. Model input is typically a storage-outflow relationship for the detention facility. This section provides background on the Modified Puls method. The description is adapted from Fundamentals of Hydraulic Engineering Systems (Hwang and Houghtalen 1996). An example of the Modified Puls method is included with the other examples at the end of this Section (see Section 7.3).
The mathematical basis of Modified Puls routing is the continuity equation (conservation of mass with constant density). Simply stated, the change in storage is equal to inflow minus outflow. In differential format, the equation can be expressed as:
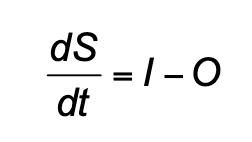 (Equation DET-9)
Where:
dS/dt = rate of change of storage with respect to time
I = instantaneous inflow
O = instantaneous outflow
If average rates of inflow and outflow are used, an acceptable solution can be obtained over a discrete time step (Δt) using:
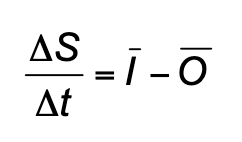 (Equation DET-10)
Where: ΔS is the storage change over the time step. By assuming linearity of flow across the time step, the storage equation may be expressed as:
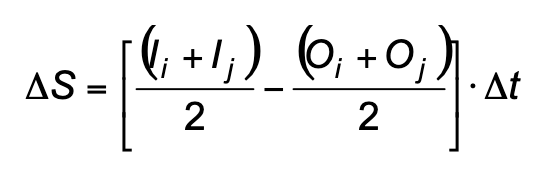 (Equation DET-11)
Where the subscripts i and j designate inflow and outflow at the beginning and end of the time step, respectively.
The storage relationship in Equation DET-11 has two unknowns. Because the inflow hydrograph must be defined prior to performing the routing calculations (using the SCS Unit Hydrograph Method with the Huff rainfall distribution), inflow values (Ii and Ij) are known. Likewise, the time increment (Δt) is chosen, and outflow at the beginning of the time step (Oi) was solved in the previous time step calculations (or specified as an initial value). That leaves the storage increment (ΔS) and the outflow at the end of the time step (Oj) as unknowns. Because both storage and outflow (for uncontrolled outlet devices) are related to the depth of water in the detention facility, they are related to one another. This relationship is employed to compute the solution.
The data requirements to perform Modified Puls reservoir routing include:
- An inflow hydrograph (determined using the SCS Unit Hydrograph Method as described in Chapter 3 – Determination of Stormwater Runoff).
- A storage versus outflow relationship for the detention facility (see Section 5.2 for outlet works calculations). The stage-storage and stage-outflow relationships may be used to generate the storage-outflow relationship.
Figure DET-2 displays these data requirements graphically. The procedure for obtaining the stage (elevation) versus storage curve is described in the figure. Also, the two basic types of outlet devices (weirs and orifices) are noted with typical stage-discharge relationships.
Figure DET-2 Data Requirements for Storage Routing
(Source: UDFCD USDCM, adapted from Hwang and Houghtalen, 1996)
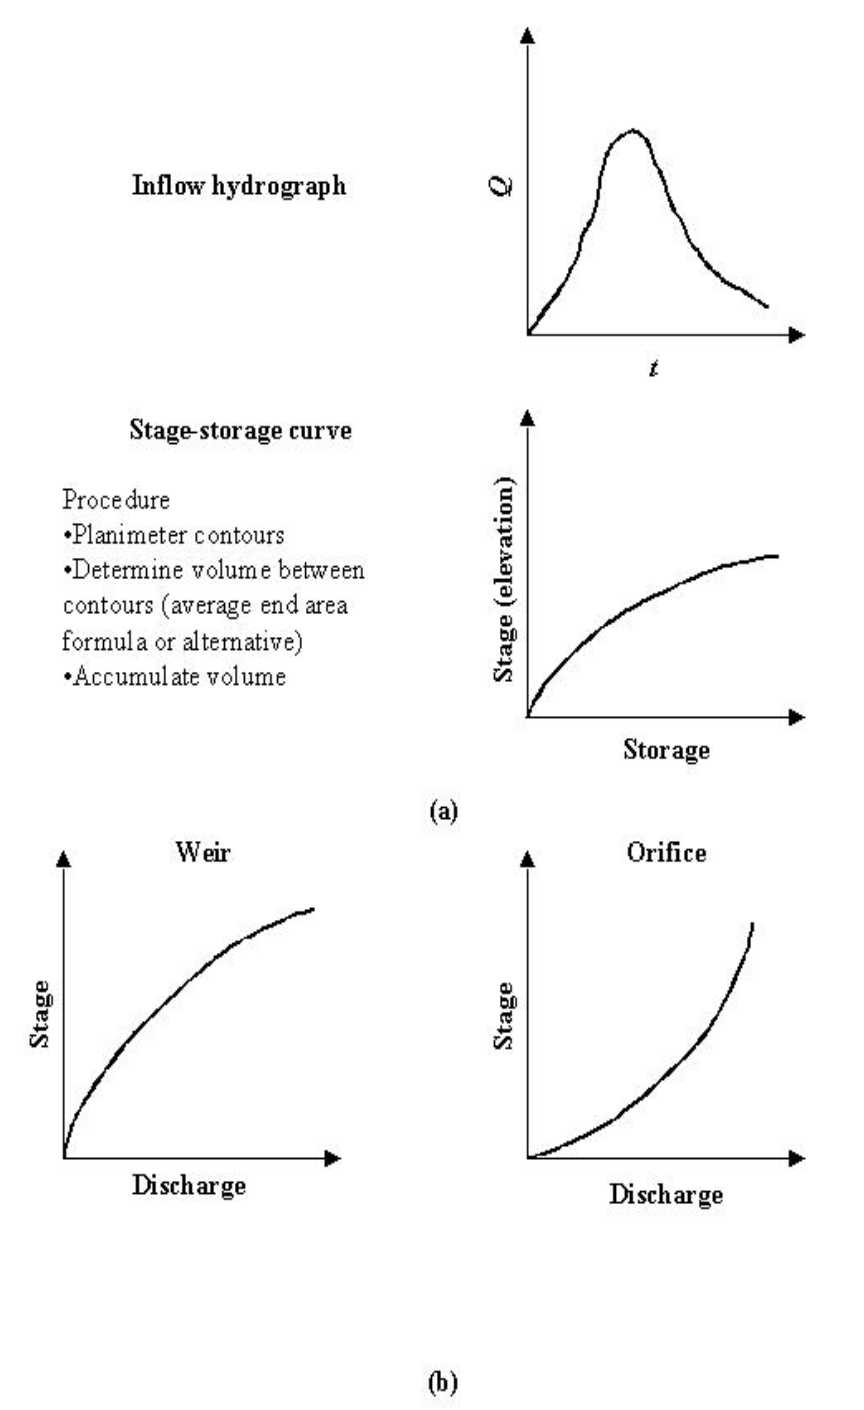
The Modified Puls routing method reformulates Equation DET-11, as shown by Equation DET-12:
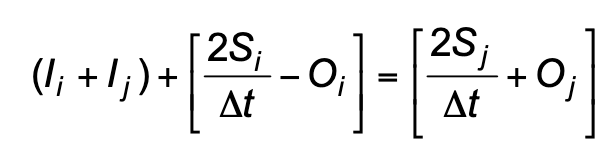 (Equation DET-12)
Where (Sj-Si) equals the change in storage (ΔS). The advantage of this expression is that all of the known values are on the left side and all of the unknowns are grouped on the right.
The solution procedure for Modified Puls routing is as follows:
- Determine the appropriate inflow hydrograph for the detention facility (see Chapter 3 – Determination of Stormwater Runoff).
- Select a routing interval (Δt). Linearity of inflows and outflows over the time step is assumed.
- Determine stage-storage relationship for the detention facility.
- Determine stage-discharge relationship for the outlet device(s) selected (see Section 5.2 for calculations regarding stage-discharge relationship for outlet works).
- Establish the storage-outflow relationship by setting up a table with the following headings (note that headings b through e correspond with variables in Equation DET-12:
- Elevation
- Outflow (O)
- Storage (S)
- 2S/Δt
- 2S/Δt+O
- Plot the (2S/Δt+O) versus O relationship.
- Perform routing using a table with the following headings:
- Time
- Inflow at time step i (Ii)
- Inflow at time step j (Ij)
- 2S/Δt-O
- 2S/Δt+O
- Outflow
For an example application of the Modified Puls method, see Section 7.3.
5.2.1 Orifices
Single or multiple orifices may be used in a detention facility and are commonly used as a low-flow control. The hydraulics of each can be superimposed to develop the outlet rating curve. The basic orifice equation is:
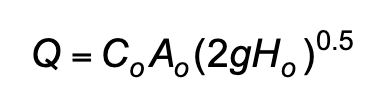 (Equation DET-13)
Where: (Equation ST-28)
Q = orifice discharge flow rate (cfs)
Co= discharge coefficient (use 0.60 for a square-edged, uniform opening, ranging down to 0.4 for a ragged edge orifice)
Ao = area of orifice (ft2)
Ho = effective head on the orifice (ft)
g = gravitational acceleration (32.2 ft/s2)
If the orifice discharges as a free outfall, the effective head is measured from the centroid of the orifice to the upstream water surface elevation. If the orifice discharge is submerged, then the effective head is the difference in elevation of the upstream and downstream water surfaces.
5.2.2. Weirs
Several different types of weirs may be used, including:
- Rectangular sharp-crested weirs
- Broad-crested weirs
- Broad-crested slot and v-notch weirs
The methods for calculating the discharge from these types of weirs are described below:
Rectangular Sharp-Crested Weirs: A sharp-crested weir is defined as a weir with a wall thickness of 6 inches or less. The basic equation for a rectangular sharp-crested weir is:
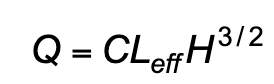 (Equation DET-14)
Where:
Q = Weir discharge (cfs)
H = head above weir crest (excluding velocity head) (ft)
C= weir coefficient (as calculated in Equation DET-16 or DET-17)
Leff =effective horizontal weir length (ft) (as calculated in Equation DET-15 to account for contractions)
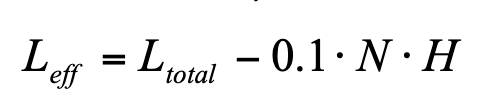 (Equation DET-15)
Where (for Leff):
Ltotal= the total weir length (ft)
N = number of contracted sides*
*N = 0 corresponds to the case of a suppressed rectangular weir, for which the channel width is equal to the weir opening length, and N=2 corresponds to the case of a contracted rectangular weir, where both sides of the weir are some distance inward away from the channel edge, narrowing (contracting) the channel width.
The weir coefficient is a function of the head above the weir crest, H, and the height of the weir crest above the pond or channel bottom, Hc. For ratios of H/Hc up to approximately 10, the following equation should be applied to determine C (Debo and Reese 2003):
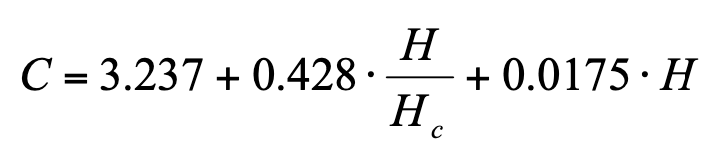 (Equation DET-16)
For ratios of H/Hc greater than 15, the weir coefficient is found using:
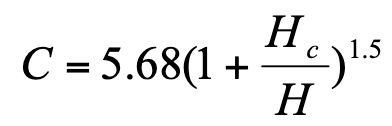 (Equation DET-17)
For ratios of H/Hc between 10 and 15, the designer should interpolate between Equations DET-16 and DET-17.
Broad-Crested Weirs: The equation for a broad-crested weir is:
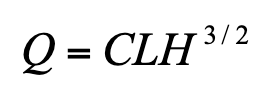 (Equation DET-18)
Where:
Q = Weir discharge (cfs)
C= Broad-crested weir coefficient (from Table DET-2)
L = Broad-crested weir length (ft) (For weirs with tapered sides, it is acceptable to use a length equal to the average of the upper and lower weir lengths.)
H = Head above weir crest (ft)
Broad-Crested Slot and V-Notch Weirs: Capacity of broad-crested slot and V-notch weirs shall be determined by the following equation:
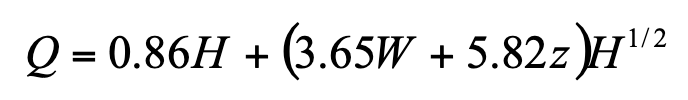 (Equation DET-19)
(Source: J. Wilson, University of Missouri-Rolla)
In which:
Q = discharge (cfs)
H = upstream head (ponded depth above the slot invert) (ft) (maximum of 6 ft)
W = slot invert width perpendicular to flow (ft) (0.333
z = slope of slot sides expressed in terms of H: V (0
Table DET-2
Broad-Crested Weir Coefficients
Head Above Weir (ft) | C | C | C | C |
0.2 | 2.80 | 2.75 | 2.69 | 2.49 |
0.4 | 2.92 | 2.80 | 2.72 | 2.56 |
0.6 | 3.08 | 2.89 | 2.75 | 2.70 |
0.8 | 3.30 | 3.04 | 2.85 | 2.69 |
1.0 | 3.32 | 3.14 | 2.98 | 2.68 |
1.2 | 3.32 | 3.20 | 3.08 | 2.69 |
1.4 | 3.32 | 3.26 | 3.20 | 2.67 |
1.6 | 3.32 | 3.29 | 3.28 | 2.64 |
1.8 | 3.32 | 3.32 | 3.31 | 2.64 |
2.0 | 3.32 | 3.31 | 3.30 | 2.64 |
2.2 | 3.32 | 3.32 | 3.31 | 2.64 |
2.5 | 3.32 | 3.32 | 3.32 | 2.64 |
3.0 | 3.32 | 3.32 | 3.32 | 2.64 |
3.5 | 3.32 | 3.32 | 3.32 | 2.64 |
4.0 | 3.32 | 3.32 | 3.32 | 2.64 |
Source: Brater and King, 1976.
Figure DET-3 Examples of Good and Bad Location, Grading and Lot Layout for Detention
Source: UDFCD USDCM
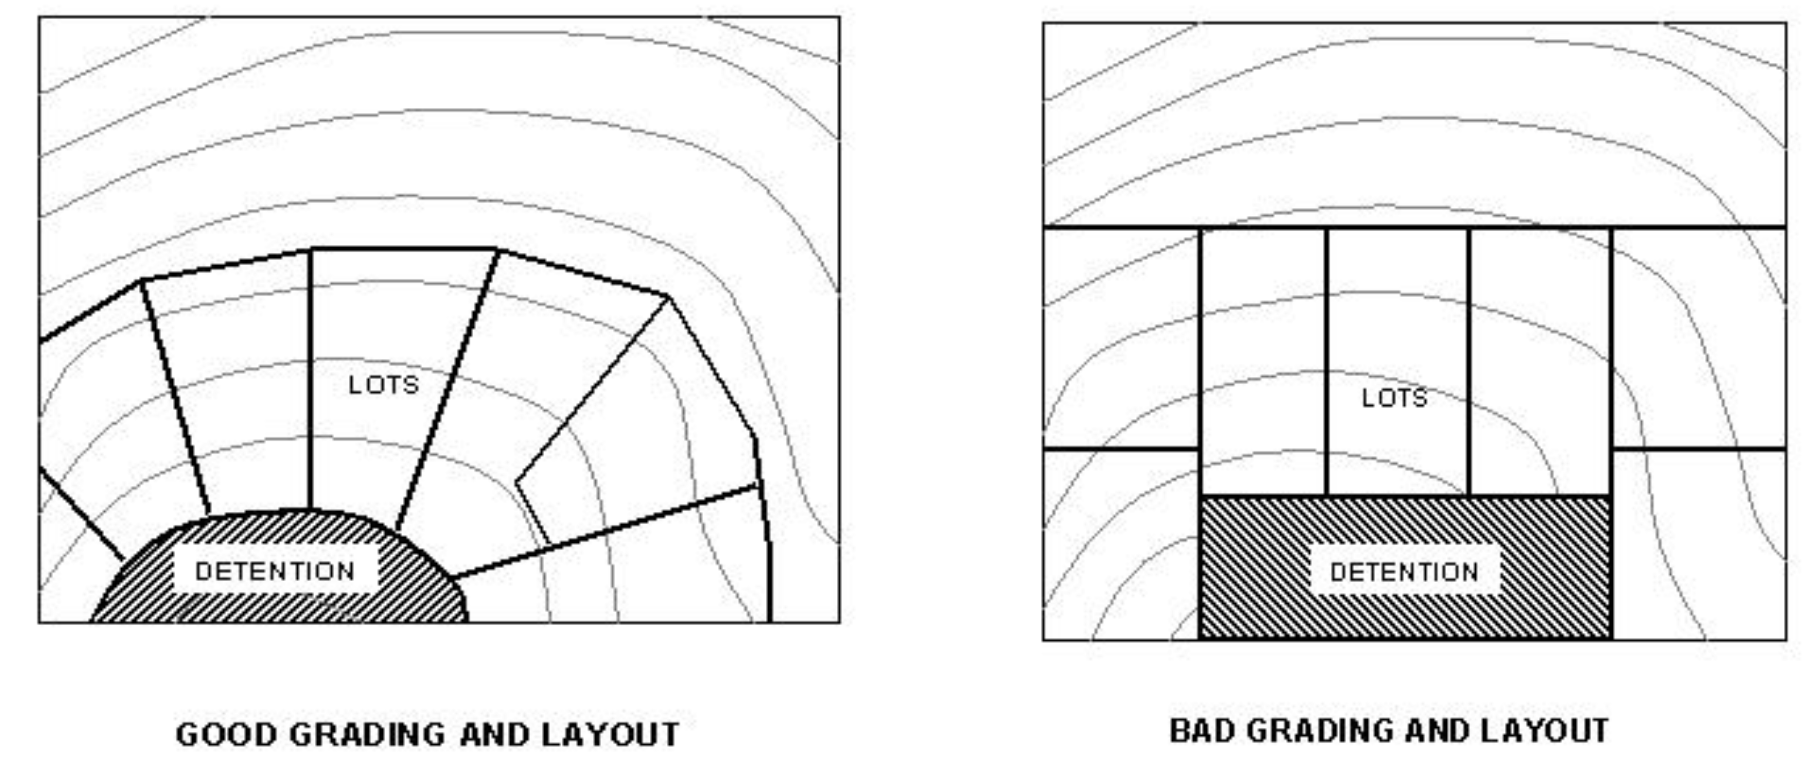
Table DET-3 Rational Formula-Based Modified FAA Procedure Example
Rainfall Duration (min) | Rainfall Intensity (in/hr) | Inflow Volume | Outflow Adjustment Factor | Calculated Average Outflow (cfs) | Calculated Outflow Volume | Required Storage Volume |
|---|---|---|---|---|---|---|
(1) | (2) | (3) | (4) | (5) | (6) | (7) |
0 | ----- | ----- | ----- | ----- | ----- | ----- |
5 | 11.76 | 79027 | 1.00 | 90 | 27000 | 52027 |
10 | 10.32 | 138701 | 1.00 | 90 | 54000 | 84701 |
15 | 8.84 | 178214 | 1.00 | 90 | 81000 | 97214 |
20 | 7.91 | 212621 | 1.00 | 90 | 108000 | 104621 |
25 | 7.2 | 241920 | 1.00 | 90 | 135000 | 106920 |
30 | 6.4 | 258048 | 0.92 | 82.5 | 148500 | 109548 |
35 | 5.8 | 272832 | 0.86 | 77.1 | 162000 | 110832 |
40 | 5.32 | 286003 | 0.81 | 73.1 | 175500 | 110503 |
45 | 4.95 | 299376 | 0.78 | 70 | 189000 | 110376 |
50 | 4.58 | 307776 | 0.75 | 67.5 | 202500 | 105276 |
55 | 4.26 | 314899 | 0.73 | 65.4 | 216000 | 98899 |
60 | 4.03 | 324979 | 0.71 | 63.8 | 229500 | 95479 |
65 | 3.78 | 330221 | 0.69 | 62.3 | 243000 | 87221 |
70 | 3.6 | 338688 | 0.68 | 61.1 | 256500 | 82188 |
75 | 3.47 | 349776 | 0.67 | 60 | 270000 | 79776 |
80 | 3.35 | 360192 | 0.66 | 59.1 | 283500 | 76692 |
85 | 3.23 | 368995 | 0.65 | 58.2 | 297000 | 71995 |
90 | 3.11 | 376186 | 0.64 | 57.5 | 310500 | 65686 |
95 | 2.98 | 380486 | 0.63 | 56.8 | 324000 | 56486 |
100 | 2.86 | 384384 | 0.63 | 56.2 | 337500 | 46884 |
105 | 2.74 | 386669 | 0.62 | 55.7 | 351000 | 35669 |
110 | 2.62 | 387341 | 0.61 | 55.2 | 364500 | 22841 |
115 | 2.49 | 384854 | 0.61 | 54.8 | 378000 | 6854 |
120 | 2.37 | 382234 | 0.60 | 54.4 | 391500 | 0 |
Notes: Column (1) Storm duration (t) in 5-minute increments (typical) Column (2) Intensity for storm duration (t) from intensity-duration-frequency table in Chapter 4 – Determination of Stormwater Runoff. Note: some values are from linear interpolation of tabular data. Column (3) =C*Col (2)*A*60*Col (1) = 0.56*Col(2)*40*60*Col (1) [Equation DET-1] Column (4) = 0.5*(1+[tc/Col (1)]) = 0.5*(1+[25/Col (1)]) [Equation DET-2] Column (5) = Col (4)*Qpo = Col (4)*90 [Equation DET-3] Column (6) = Col (5)*60*Col (1) [Equation DET-4] Column (7) = Col (3) – Col (6) [Equation DET-5] Shaded cell in Column 7 denotes maximum required detention volume using the Modified FAA Procedure. | ||||||
Table DET-4 Simplified Detention Volume Calculation Example
Time (min) | Inflow Hydrograph (cfs) | Outflow Rising Hydrograph (cfs) | Incremental Storage Volume (ac-ft) | Cumulative Storage Volume (ac-ft) |
|---|---|---|---|---|
(1) | (2) | (3) | (4) | (5) |
0 | 0 | 0 | 0.00 | 0.00 |
6 | 0 | 2 | 0.00 | 0.00 |
12 | 5 | 3 | 0.02 | 0.02 |
18 | 41 | 5 | 0.30 | 0.31 |
24 | 97 | 7 | 0.75 | 1.06 |
30 | 128 | 8 | 0.99 | 2.05 |
36 | 130 | 10 | 0.99 | 3.05 |
42 | 122 | 12 | 0.91 | 3.95 |
48 | 107 | 13 | 0.78 | 4.73 |
54 | 91 | 15 | 0.63 | 5.36 |
60 | 77 | 17 | 0.50 | 5.86 |
66 | 66 | 18 | 0.40 | 6.26 |
72 | 56 | 20 | 0.30 | 6.56 |
78 | 45 | 22 | 0.19 | 6.75 |
84 | 37 | 23 | 0.12 | 6.87 |
90 | 33 | 25 | 0.07 | 6.94 |
96 | 31 | 27 | 0.04 | 6.98 |
102 | 30 | 28 | 0.02 | 7.00 |
108 | 30 | 30 | 0.00 | 7.00 |
114 | 28 | |||
Columns (1) & (2) Input from SCS Unit Hydrograph analysis with Huff distribution Column (3) = (T/Tp)*Qpo = (Col(1)/108)*30 [Equation DET-6] Column (4) = ((Col (2) – Col (3))*60*6)/43560. (includes unit conversion). Note: if Col (2) – Col (3) < 0, then Col (4) = 0. Column (5) = (Col (5) Row (i-1)) + (Col (4) Row (i)) | ||||
Table DET-5 Stage-Storage Relationship for Detention Facility
Stage (elevation [ft] above mean sea level) | Storage (acre feet) |
|---|---|
1320 | 0 |
1321 | 0.5 |
1322 | 1.5 |
1323 | 4.0 |
1324 | 7.0 |
1325 | 10.0 |
The stage-outflow relationship for the detention facility outlet structure (determined from hydraulic analysis) is summarized in Table DET-6.
Table DET-6 Stage-Outflow Relationship for Detention Facility
Stage (elevation [ft] above mean sea level) | Outflow (cfs) |
|---|---|
1320 | 0 |
1321 | 5 |
1322 | 10 |
1323 | 20 |
1324 | 30 |
1325 | 40 |
The following steps are used to determine the outflow hydrograph for this proposed facility:
- Determine the inflow hydrograph - The inflow hydrograph should be developed following guidance in Chapter 3 – Determination of Stormwater Runoff.
- Select a routing interval (Δt) - A rule of thumb for selecting the routing interval is to divide the rising limb of the hydrograph into ten increments. Since it takes about 40 minutes for the hydrograph to peak, use a routing interval of 4 minutes.
- Storage-outflow relationship - Establish the storage-outflow relationship as shown in Table DET-7:
Table DET-7 Storage-Outflow Relationship for Detention Facility
Stage (elevation [ft] above mean sea level)
Outflow (O)
(cfs)
Storage (S) (acre-feet)
2S/Δt
(cfs)
2S/Δt + O
(cfs)
(1)
(2)
(3)
(4)
(5)
1320
0
0.0
0
0
1321
5
0.5
182
187
1322
10
1.5
545
555
1323
20
4.0
1452
1472
1324
30
7.0
2541
2571
1325
40
10.0
3630
3670
Columns (1) and (2) from Table DET-5
Columns (1) and (3) from Table DET-6
Column (4) = 2S/∆t*(unit conversion) = 2*Col (3)/(4 min * 60 sec/min)* (43560 ft2/acre)
Column (5) = Col (4) + Col (2)
- Plot the (2S/Δt) + O versus O relationship - Plot values from Table DET-7. This relationship is shown in Figure DET-4.
Figure DET-4 2S/Δt +O versus O for Reservoir Routing Example
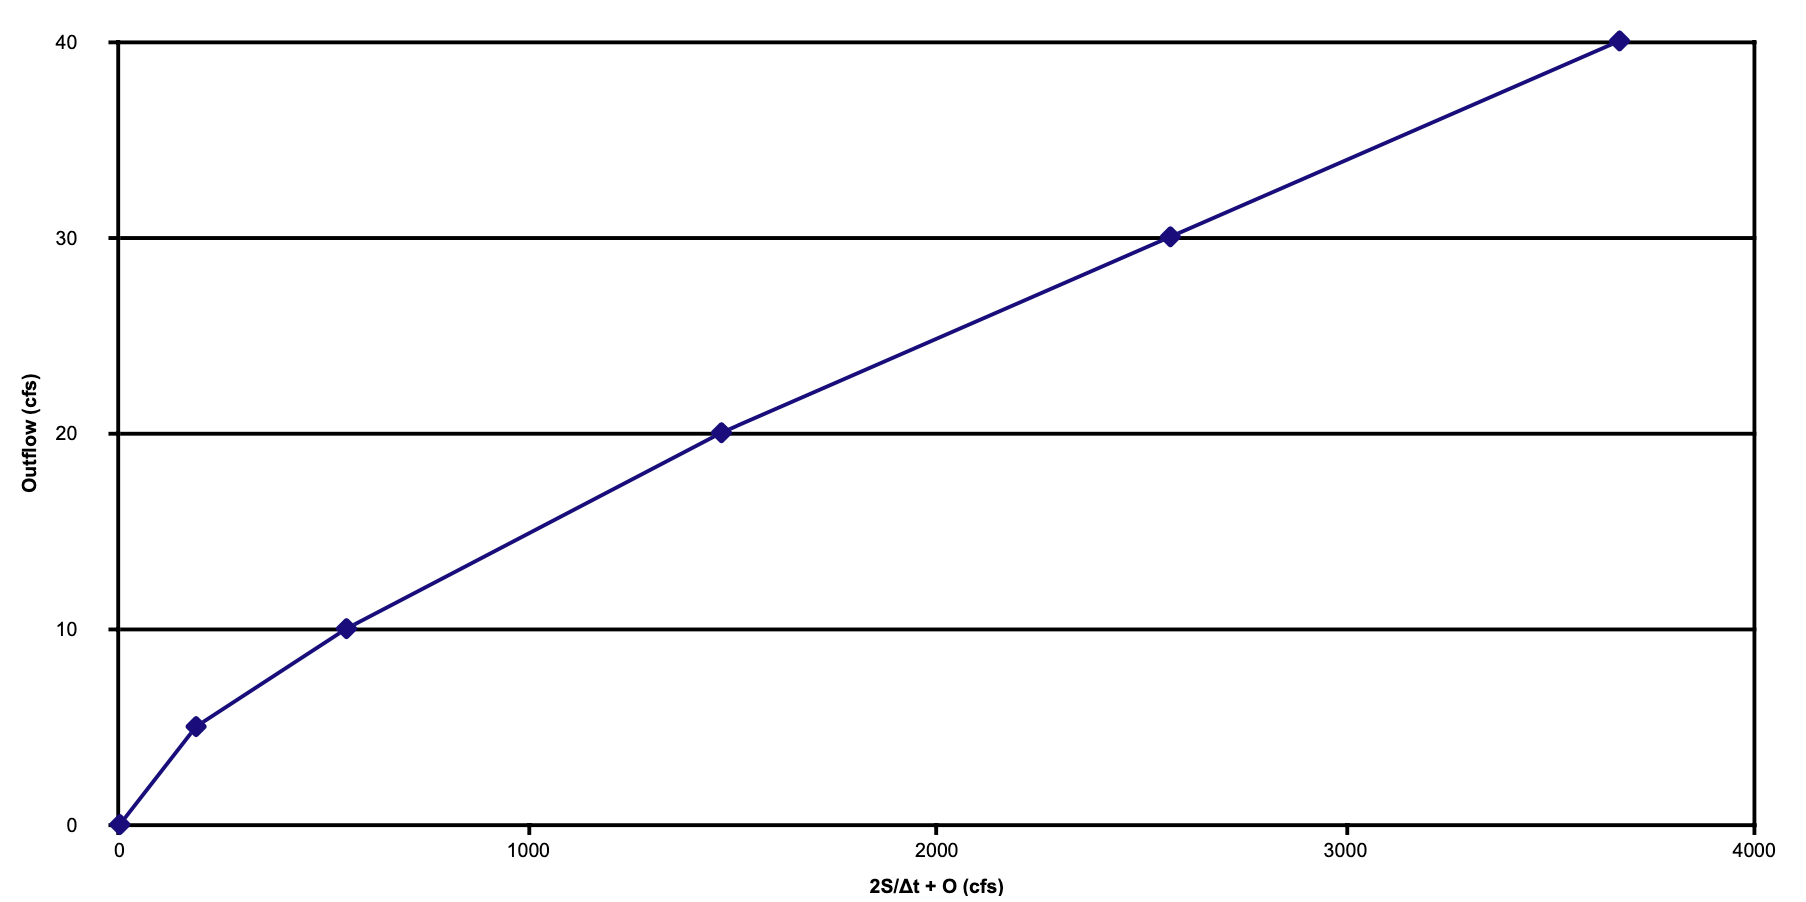
- Perform the Modified-Puls routing using a table:
An example of the Modified-Puls routing method is shown in Table DET-8. Table heading descriptions are provided following the table.
Table DET-8 Modified Puls Routing Table
Time (min)
Inflow (Ii) (cfs)
Inflow (Ij) (cfs)
2S/Δt – O(cfs)
2S/Δt + O(cfs)
Outflow (O) (cfs)
(1)
(2)
(3)
(4)
(5)
(6)
0
0.00
0.01
0
--
0
4
0.01
0.59
0.01
0.01
0.0006
8
0.59
5.40
0.59
0.62
0.02
12
5.40
25.61
6.23
6.58
0.18
16
25.61
60.13
35.24
37.23
1.00
20
60.13
97.40
114.48
120.97
3.24
24
97.40
121.10
259.69
272.01
6.16
28
121.10
130.28
460.26
478.19
8.96
32
130.28
130.03
688.22
711.64
11.71
36
130.03
124.85
919.94
948.53
14.29
40
124.85
117.18
1141.29
1174.81
16.76
44
117.18
107.44
1345.25
1383.32
19.03
48
107.44
96.71
1528.09
1569.87
20.89
52
96.71
86.37
1687.50
1732.24
22.37
56
86.37
77.29
1823.33
1870.58
23.63
60
77.29
69.90
1937.62
1986.99
24.69
64
69.90
63.07
2033.65
2084.81
25.58
68
63.07
56.02
2113.98
2166.62
26.32
72
56.02
48.75
2179.22
2233.07
26.93
76
48.75
42.31
2229.21
2283.99
27.39
80
42.31
37.42
2264.82
2320.26
27.72
84
37.42
34.42
2288.67
2344.55
27.94
88
34.42
32.54
2304.35
2360.52
28.08
92
32.54
31.38
2314.95
2371.31
28.18
96
31.38
30.72
2322.37
2378.87
28.25
100
30.72
30.30
2327.86
2384.46
28.30
104
30.30
29.96
2332.19
2388.88
28.34
108
29.96
29.24
2335.70
2392.46
28.38
112
29.24
26.98
2338.11
2394.90
28.40
116
26.98
24.08
2337.55
2394.33
28.39
120
24.08
21.58
2331.93
2388.61
28.34
124
21.58
19.40
2321.11
2377.59
28.24
128
19.40
16.20
2305.90
2362.09
28.10
132
16.20
11.82
2285.67
2341.49
27.91
136
11.82
7.66
2258.37
2313.69
27.66
140
7.66
4.56
2223.20
2277.86
27.33
144
4.56
2.83
…
…
…
For Table DET-8, columns 1-3 are known inputs into the table. The remaining columns are unknown (blank) when the routing process begins. The objective is to complete the last column, which represents the outflow hydrograph. Inputs and calculations for each column include:
- Column 1 (time) and Column 2 (inflow) provide the design inflow hydrograph (obtained using methods described in Chapter 3 – Determination of Stormwater Runoff).
- Column 3 is the value from Column 2 moved earlier in time (up the table) one time increment.
- Column 4: To initiate the routing process with little or no inflow, assume the initial value is 0. The next value of 2Sj/Δt – Ojconfirms this assumption. Subsequent values of (2S/Δt) – O are calculated by doubling the outflow values in column 6 and subtracting them from (2S/Δt) + O.
- Column 5: The values in column 5 are calculated by applying the continuity equation (storage relationship) in Equation DET-20:
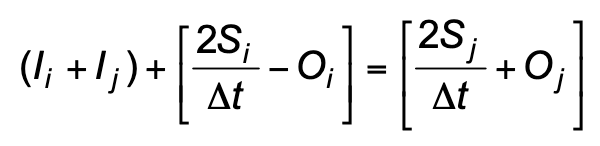 (Equation DET-20)
for the first time increment (4 minutes), this is: , - Column 6: The first value of outflow is assumed to be equal to inflow. Subsequent values are obtained from the (2S/Δt) + O versus O relationship in Figure DET-4 and Table DET-8. Linear interpolation can be used to determine O values for a given (2S/Δt) + O using Table DET-8 for values that cannot be easily read from Figure DET-4 (for the first row of Column 6, see Step 2 above)
Table OC-1 – Grass-Lined Open Channel Design Criteria
Table OC-1 – Grass-Lined Open Channel Design Criteria | |||
|---|---|---|---|
Use of channel type subject to City approval? | No | ||
Maximum Normal Depth Velocity | ≤ 5-fps for 100-year design | ||
Manning’s n – Used to check channel capacity (flow depth) | 0.040 (or see Section 3.1.3, Figure OC-3 Retardance Class C) | ||
Manning’s n – Used to check maximum velocity (channel stability) | 0.030 (or see Section 3.1.3, Figure OC-3 Retardance Class D) | ||
Froude Number 3 | < 0.8 | ||
Longitudinal Channel Slope 1 | ≥ 0.75% ≥ 1.00% if no trickle channel is present | ||
Side Slopes (max.) | 3H:1V | ||
Channel Bottom Width (trapezoidal) | ≥ 5-ft | ||
Channel Bottom Cross-slope | 1% to 2% | ||
Centerline Curve Radius (feet) (subcritical flow) | ≥ 2x the top width of the 100-year design storm | ||
Centerline Curve Radius (supercritical flow) | Supercritical Flow NOT ALLOWED | ||
Channel Bend Protection | See Section 3.1.5.1 | ||
Outfall Height Above Channel Invert | ≥ 1-ft (with properly designed outlet protection) | ||
Normal Depth outside of the trickle/low-flow channel | ≤ 5-ft at 100-year design peak flow for fully developed watershed | ||
Secondary Channels Freeboard 2 | ≥ 1-ft | ||
Primary Channels Freeboard 2 | ≥ 2-ft | ||
Trickle Channel (if any) sized for … | 2.0% of 100-year design peak flow for fully developed watershed | ||
Trickle Channel (if any) Bottom Width | ≥ 5-ft | ||
Low-flow Channel sized for … | 5-year design peak flow for fully developed watershed | ||
Low-flow Channel Bottom Width | ≥ 5-ft | ||
Low-flow Channel Depth | ≥ 3.0-ft and ≤ 5.0-ft | ||
Maintenance Access Road for Primary Channels | 10-ft (min) stable surface with 12-ft (min) clear width, 20-ft at drop structures | ||
Maintenance access locations from city streets or drainage easements… | Locations to be determined during the review process. | ||
| Drop downstream of each culvert or bridge crossing | See Section 3.2.3 | ||
Secondary Channels water surface profile shall be computed for… | 1-, 2-, 5- 10-, 25-, 50- and 100-year storm events | ||
Primary Channels water surface profile shall be computed for… | 1-, 2-, 5-, 10-, 25-, 50-, and 100-year storm events | ||
Utility location and depth near channels | No utilities are allowed between the top of banks except for crossings which must be ≥ 3-ft deep. No utilities are allowed between maintenance road stable surface and top of bank. | ||
| |||
Table OC-2 – Composite Open Channel Design Criteria
Table OC-2 – Composite Open Channel Design Criteria | |||||
|---|---|---|---|---|---|
Use of channel type subject to City approval? | No | ||||
Maximum Normal Depth Velocity (ft/sec) | ≤ 5-fps for 100-year design | ||||
Manning’s n – Used to check maximum velocity (channel stability) | See Section 3.2.1, Figure OC-3 (Retardance Curve D), Table OC-8 | ||||
Manning’s n – Used to check channel capacity (flow depth) | See Section 3.2.1, Figure OC-3 (Retardance Curve C), Table OC-8 | ||||
Composite Manning’s n calculated for channel and used in hydraulic computations | See Section 3.2.2, Equation OC-11 | ||||
Froude Number 3 | < 0.8 | ||||
Longitudinal Channel Slope 1 | Base on “new channel” roughness condition. See Section 3.2; ≥ 0.25% | ||||
Side Slopes (max.) in low-flow channel…4 | 2.5H:1V [TRM (preferred) or soil riprap (requires approval) reinforcement required] | ||||
Side Slopes (max.) above low-flow channel…4 | 3H:1V (grass-lined) | ||||
Channel Bottom Width4 | ≥ 5-ft | ||||
Channel Bottom Cross-slope4 | “Flat bottom” | ||||
Centerline Curve Radius (feet) (subcritical flow) | ≥ 2x the top width of the 100-year design storm | ||||
Centerline Curve Radius (supercritical flow) | Supercritical Flow NOT ALLOWED | ||||
Channel Bend Protection | See Section 3.1.5.1 | ||||
Outfall Height Above Channel Invert | ≥ 2-ft | ||||
Normal Depth outside of the trickle/low-flow channel | ≤ 5-ft at 100-year design peak flow for fully developed watershed | ||||
SecondaryChannel Freeboard 2, 4 | ≥ 1-ft | ||||
Primary Channel Freeboard 2, 4 | ≥ 2-ft | ||||
Low-flow Channel sized for … | 5-year design peak flow for fully developed watershed | ||||
Low-flow Channel depth | ≥ 3.0-ft and ≤ 5.0-ft | ||||
Maintenance Access Road4 | 10-ft (min) stable surface with 12-ft (min) clear width, 20-ft at drop structures | ||||
| Maintenance access locations from city streets or drainage easements… | Locations to be determined during the review process. | ||||
Drop downstream of each culvert or bridge crossing | See Section 3.2.3 | ||||
| Secondary Channels water surface profile shall be computed for… | 1-, 10-, 25-, and 100-year storm events | ||||
| Primary Channels water surface profile shall be computed for… | 1-, 2-, 5-, 10-, 25-, 50- and 100-year storm events | ||||
| Utility location and depth near channels | No utilities are allowed between the top of banks except for crossings which must be ≥ 3-ft deep. No utilities are allowed between maintenance road stable surface and top of bank. | ||||
| |||||
Table OC-3 – Concrete-Lined Open Channel Design Criteria
Table OC-3 – Concrete-Lined Open Channel Design Criteria | |||||||
|---|---|---|---|---|---|---|---|
Use of channel type subject to City approval? | Yes | ||||||
Maximum Normal Depth Velocity | ≤ 18-fps for 100-year design | ||||||
Manning’s n – Used to check maximum velocity and Froude Number ≤ 0.7 | 0.011 | ||||||
Manning’s n – Used to check channel capacity and Froude Number ≥ 1.4 | 0.013 | ||||||
Froude Number 5 | ≤ 0.7 3 and ≥ 1.4 4 under both Manning’s n | ||||||
Longitudinal Channel Slope 1 | ≤ 1.00% | ||||||
Side Slopes (max.) | 1.5H:1V (unless structurally designed for steeper slope) | ||||||
Channel Bottom Width | ≥ 5-ft | ||||||
Centerline Curve Radius (subcritical flow) | ≥ 2x the top width for the 100-year design storm | ||||||
Centerline Curve Radius (supercritical flow) | No curvature permitted | ||||||
Concrete channel lining thickness | ≥ 5-in when Fr ≤ 0.7 3 ; ≥ 8-in when Fr ≥ 1.4 4 | ||||||
Outfall Height Above Channel Invert | ≥ 1-ft | ||||||
| Secondary Channels Freeboard 2 | ≥ 1-ft See Section 3.3.1.4 | ||||||
| Primary Channels Freeboard 2 | ≥ 2-ft See Section 3.3.1.4 | ||||||
| Maintenance Access Road | 10-ft (min) stable surface with 12-ft (min) clear width, 20-ft at drop structures | ||||||
| Maintenance access locations from city streets or drainage easements… | Locations to be determined during the review process. | ||||||
| Secondary Channels water surface profile shall be computed for… | 1-, 10-, 25-, and 100-year storm events | ||||||
| Primary Channels water surface profile shall be computed for… | 1-, 2-, 5-, 10-, 25-, 50- and 100-year storm events | ||||||
| Safety Requirements | 6-ft chain link or approved equivalent fence/barrier required in areas where channel depth is ≥ 3-ft | ||||||
| Utility location and depth near channels | No utilities are allowed between the top of banks except for crossings which must be ≥ 3-ft deep. No utilities are allowed between maintenance road stable surface and top of bank. | ||||||
| |||||||
Table OC-4 – Riprap-Lined Open Channel Design Criteria
Table OC-4 – Riprap-Lined Open Channel Design Criteria | |||
|---|---|---|---|
Use of channel type subject to City approval? | Yes | ||
Maximum Normal Depth Velocity (ft/sec) | ≤ 12-fps | ||
Manning’s n – Used to check maximum velocity (channel stability) | 0.030 | ||
Manning’s n – Used to check channel capacity (flow depth) | 0.041 | ||
Froude Number 1 | ≤ 0.8 | ||
Side Slopes (max.) | 2.5H:1V | ||
Use of soil riprap … | Section 3.1.5.2; Figure OC-5; Section 3.4.1.1 | ||
Rock specific gravity and other rock parameters | ≥ 2.50 and see Section 3.4.1.1 | ||
Riprap rock size / gradation | Sizing – Equation OC-13 and Table OC-13 Gradation – Table OC-10 & Table OC-11 | ||
Riprap blanket thickness | ≥ 2x d50 in normal channel ≥ 3x d50 for at least 3-ft at upstream and downstream ends of lining | ||
Toe protection provided according to… | Section 3.4.2.4 & Figure OC-9 | ||
Centerline Curve Radius (subcritical flow) | ≥ 2x the top width of the 100-year design storm | ||
Centerline Curve Radius (supercritical flow) | Supercritical Flow NOT ALLOWED | ||
Channel Bend Protection – Riprap sizing… | Size riprap in bends according to Section 3.4.2.5. Use Equation OC-13 and Table OC-13 based on the adjusted velocity (Va) from Equation OC-10. | ||
Channel Bend Protection – Riprap extents… | Extend downstream of bend ≥ 2x the top width of the 100-year design storm. | ||
Outfall Height Above Channel Invert | ≥ 1-ft | ||
Secondary Channels Freeboard 2 | ≥ 1-ft See Section 3.3.1.4 | ||
Primary Channels Freeboard 2 | ≥ 2-ft See Section 3.3.1.4 | ||
Riprap at transitions – Riprap sizing … | Use Table OC-13 by using ≥ 1.25x maximum velocity in transition. | ||
Riprap at transition – Riprap extents … | Extend upstream by 5-ft and downstream by ≥5x design flow depth. | ||
Granular bedding – Gradation… | See Section 3.4.4.1; Table OC-14 | ||
Granular bedding – Thickness… | See Section 3.4.4.1; Table OC-15 | ||
Maintenance Access Road | 10-ft (min) stable surface with 12-ft (min) clear width, 20-ft at drop structure | ||
| Maintenance access locations from city streets or drainage easements… | Locations to be determined during the review process. | ||
SecondaryChannels water surface profile shall be computed for… | 1-, 2-, 5-, 10-, 25-, 50- and 100-year storm events | ||
PrimaryChannels water surface profile shall be computed for… | 1-, 2-, 5-, 10-, 25-, 50- and 100-year storm events | ||
Utility location and depth near channels | No utilities are allowed between the top of banks except for crossings which must be ≥ 3-ft deep. No utilities are allowed between maintenance road stable surface and top of bank. | ||
| |||
Table OC-5 – Bioengineered Open Channel Design Criteria
Table OC-5 – Bioengineered Open Channel Design Criteria | |||
|---|---|---|---|
Use of channel type subject to City approval? | Yes | ||
Maximum Normal Depth Velocity | ≤ 2-fps for 5-year design ≤ 4-fps for 100-year design | ||
Froude Number 2 | 0.3 for 5-year design 0.3 for 100-year design | ||
Longitudinal Channel Slope 1 | ≤ 0.20% | ||
| Centerline Curve Radius (feet) (subcritical flow) | ≥ 2x the top width of the 100-year design storm | ||
| Centerline Curve Radius (supercritical flow) | Supercritical Flow NOT ALLOWED | ||
Design guidelines | See Section 3.5.7 | ||
Utility location and depth near channels | No utilities are allowed between the top of banks except for crossings which must be ≥ 3-ft deep. No utilities are allowed between maintenance road stable surface and top of bank. | ||
Water surface profiles
Maintenance roads and access easements. | |||
Table OC-6 – Acceptable/Preferred Open Channel Types
Channel Type | Preference Rating 1 1 – most preferred 4 – least preferred | City approval required prior to implementation 2 |
|---|---|---|
Natural | 1 | No |
Grass-lined | 2 | No |
Composite | 2 | No |
Concrete-lined | 3 | Yes |
Riprap-lined | 4 | Yes |
Bioengineered | 2 | No 3 |
| ||
As discussed in the rest of this chapter, the selection of the channel type for any given reach of a major drainageway is a complex function of hydraulic, hydrologic, structural, financial, environmental, sociological, public safety, and maintenance considerations and constraints. Table OC-6 merely provides preferences the design engineer should keep in mind when selecting an open channel type for a project.
Besides defining channel types by their lining characteristics, channels are further defined according to the maintenance classifications outlined in Section 2.5. Every open channel within the City of Rogers shall receive a designation as either primary, secondary, or tertiary which will establish the party responsible for maintaining a specific open channel in the City. Section 2.5 further defines the physical parameters of each type of these channels along with the designated party responsible for maintaining the channel.
1.5.1 Effects of Urbanization on Existing Stream Channels
In response to urbanization, existing open channels can undergo substantial changes, especially if channel stabilization measures are not instituted in the early stages of urbanization. Urbanization causes (1) significant increases in peak discharges, total runoff volume, and frequency of bank-full discharges; (2) the steepening of channel slopes if and where natural channels are straightened to accommodate new development (this practice is discouraged by the City); (3) reduction in sediment bed load from fully developed areas; and (4) eroding and degrading natural channels. These factors, in combination, create conditions that are conducive to channel instability—widening (erosion) and deepening (degradation) in most reaches and debris and sediment accumulation (aggradation) in others.
1.5.2 Stable Channel Balance
A stable channel is usually considered an alluvial channel in equilibrium with no significant change in channel cross section with time. This is a dynamic equilibrium in which the stream has adjusted its width, depth, and slope so that the channel neither aggrades nor degrades. In this case, the sediment supply from upstream is equal to the sediment transport capacity of the channel. Under watershed conditions with normal hydrologic variations affecting runoff and sediment inflow, some adjustments in channel characteristics are inevitable.
Stable channel balance is well displayed in the relationship proposed by Lane (1955a) for the dynamic equilibrium concept whereby:
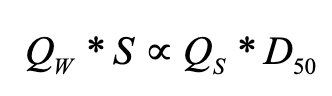 (Equation OC-1)
in which:
Qw= water discharge (cfs)
S= channel slope (ft/ft)
Qs= bed material load (tons/day)
D50 = size of bed material (in)
For a stable channel, these four parameters are balanced, and, when one or more of the parameters changes, the others adjust to restore the state of equilibrium. For example, if the stream flow increased with no change in channel slope, there would be an adjustment on the sediment side of the balance, with an increase in either bed material size or sediment load, or both. It is this principle on which the remaining open channel design equations and criteria are based in this chapter.
2.1.1 Types of Flow in Open Channels
Open channel flow can be characterized in many ways. Types of flow are commonly characterized by variability with respect to time and space. The following terms are used to identify types of open channel flow:
- Steady flow—rate of flow remains constant with time.
- Unsteady flow—rate of flow varies with time.
- Uniform flow—velocity and depth of flow remain constant over the length of the channel. If a channel is uniform and resistance and gravity forces are in exact balance, the water surface will be parallel to the bottom of the channel for uniform flow.
- Varied flow—velocity, discharge, depth, or other characteristics of the flow vary over the length of the channel stream. For a steady flow condition, flow is termed rapidly varied if these characteristics change over a short distance. If characteristics change over a longer stretch of the channel for steady flow conditions, flow is termed gradually varied.
For the purposes of open channel design, flow is usually considered steady and uniform. For a channel with a given roughness, discharge, and slope, there is only one possible depth for maintaining a uniform flow. This depth is the normal depth. When roughness, depth, and slope are known at a channel section, there can only be one discharge for maintaining a uniform flow through the section. This discharge is the normal discharge.
The designer should realize that uniform flow is more often a theoretical abstraction than an actuality (Calhoun, Compton, and Strohm 1971), namely, true uniform flow is difficult to find. Channels are sometimes designed on the assumption that they will carry uniform flow at the normal depth, but because of conditions difficult, if not impossible, to evaluate and hence not taken into account, the flow will actually have depths considerably different from uniform depth. Uniform flow computation provides only an approximation of what will occur.
Manning’s Equation describes the relationship between channel geometry, slope, roughness, and discharge for uniform flow:
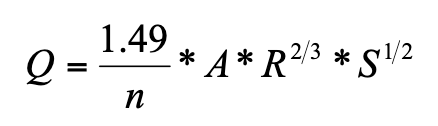 (Equation OC-2)
in which:
Q = discharge (cfs)
n = roughness coefficient
A = area of channel cross section (ft2)
R = hydraulic radius = Area (A) / Wetted Perimeter (P) (ft)
P = wetted perimeter (ft)
S = channel bottom slope (ft/ft)
Manning's Equation can also be expressed in terms of velocity by employing the continuity equation, Q = VA, as a substitution in Equation OC-2, where V is velocity (ft/sec).
For wide channels of uniform depth, where the width, b, is at least 25-times (25x) the depth, the hydraulic radius can be assumed to be equal to the depth, y, expressed in feet, and, therefore:
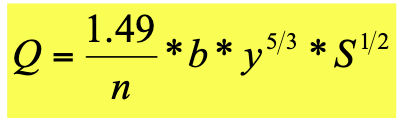 (Equation OC-3)
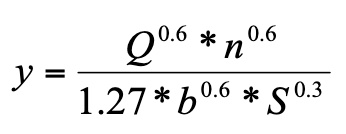 (Equation OC-4)
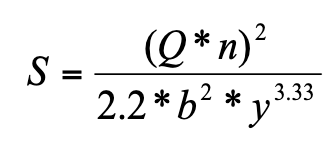 (Equation OC-5)
Solution of Equation OC-2 for depth is iterative. To help in quickly obtaining a solution without having to perform iterations the RDM-Channels spreadsheet is provided as a supplementary tool to this Manual. It can be used to perform normal flow calculations for trapezoidal channels and can help with the design of such channels.
2.1.2. Roughness Coefficients
When applying Manning’s Equation, the choice of the roughness coefficient, n, is the most subjective parameter. Manning’s n is affected by many factors and its selection, especially in natural channels depends heavily on engineering experience. Table OC-7 provides guidance on values of roughness coefficients n to use for channel design. Both maximum and minimum roughness coefficients shall be used for channel design to check for sufficient hydraulic capacity and channel lining stability, respectively.
When using the retardance curves for grass-lined channels and swales (Figure OC-3), use Retardance C for finding Manning’s n for determining channel capacity (depth) in a mature channel and Retardance D for checking the stability (velocity) in a newly constructed channel.
The designer should be aware that roughness greater than that assumed will cause the same discharge to flow at a greater depth, or conversely that flow at the computed depth will result in less discharge. Obstructions in the channel will cause an increase in depth above normal depth and must be taken into account. Sediment and debris in channels increase roughness coefficients, as well, and should be accounted for.
Table OC-7 – Manning’s n Roughness Coefficients for Channel Design (After Chow 1959)
Channel Type | Roughness Coefficient (n) | ||
|---|---|---|---|
Minimum | Typical | Maximum | |
I. Excavated or Dredged
| 0.022 0.022 0.025 0.030 0.028 0.050 0.040 | 0.025 0.027 0.030 0.035 0.030 0.080 0.050 | 0.030 0.033 0.033 0.040 0.035 0.120 0.080 |
II. Natural streams (top width at flood stage ≥ 100 ft)
| 0.025 0.035 0.075 | 0.030 0.045 0.100 | 0.033 0.050 0.150 |
III. Lined or Built-Up Channels
| 0.017 0.020 0.023 | 0.020 0.023 0.033 | 0.025 0.026 0.036 |
2. Concrete Lined Channels and Swales | See Table OC-9 | ||
3. Composite (Wetland Bottom) Channels and Swales | See Section 3.2.1 Equation OC-11, Table OC-8 | ||
4. Grass-Lined Channels and Swales | 0.040 (capacity check); 0.030 (velocity check) or see Section 3.1.3, Figure OC-3 | ||
2.1.3. Specific Energy of Channel Flow
Specific energy (E) of flow in a channel section is defined as the energy head relative to the channel bottom. If the channel slope is less than 10-percent and the streamlines are nearly straight and parallel (so that the hydrostatic assumption holds), the specific energy (E expressed as head in feet) becomes the sum of the depth and velocity head:
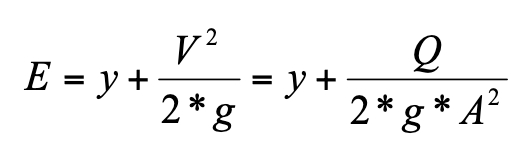 (Equation OC-6)
Where:
y = Depth of flow (ft)
V = Mean flow velocity (ft/sec)
g = Gravitational acceleration (32.2 ft/sec2)
Q = Discharge (ft3/sec)
A = Cross-sectional area of flow (ft2)
When specific energy is plotted against depth of flow, a curve with a minimum specific energy (Ec) results, as shown in Figure OC-1. At the minimum specific energy, Ec, the depth is called critical depth, yc. Depths above critical depth, yc, are subcritical, and below critical depth are supercritical (see additional discussion in Section 2.1.4).
Figure OC-1 – Specific Energy Diagram for Rectangular Channels (Bedient and Huber 2002)
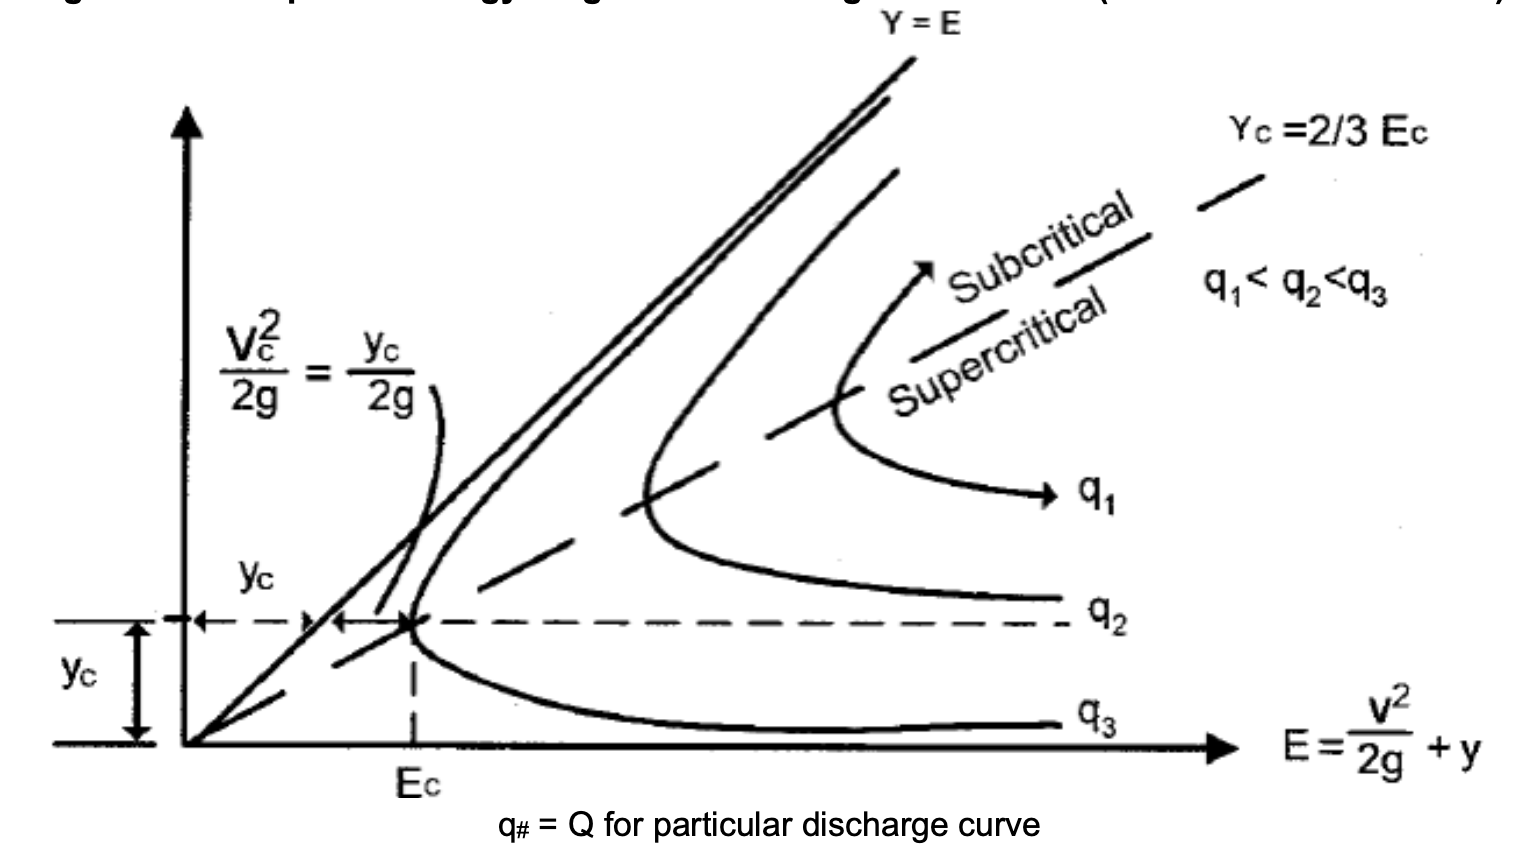
q# = Q for particular discharge curve
2.1.4. Flow Regime
Another important characteristic of open channel flow is the state of the flow, often referred to as the flow regime. Flow regime is determined by the balance of the effects of viscosity and gravity relative to the inertia of the flow. The Froude number, Fr, is a dimensionless number that is the ratio of inertial forces to gravitational forces that defines the flow regime. The Froude number is given by:
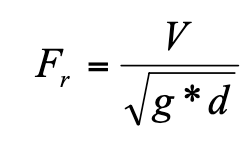 (Equation OC-7)
in which:
V = Mean flow velocity (ft/sec)
g = Gravitational acceleration (32.2 ft/sec2)
d = Hydraulic depth (ft) = A/T, cross-sectional area of water/width of free surface
Equation OC-7 applies to channel flow at any cross section. When:
- Fr= 1.0, flow is in a critical state
- Fr< 1.0, flow is in a subcritical state
- Fr> 1.0, flow is in a supercritical state
The following sections describe these flow regimes and associated criteria for channel design.
For all subcritical channels, check the Froude number using the minimum value of n for the relevant channel type from Table OC–7. When performing hydraulic computations for grassed channels, the n values for the 0.1-foot to 1.5-feet flow depth range (Table OC-8) are generally suitable for calculating the wetted channel portion for the initial storm runoff. For major runoff computations, however, the greater than 3.0-feet depth nvalues (Table OC-8) are more appropriate since flows will tend to lay the grass down to form a smoother bottom surface.
2.1.4.1 Critical Flow
Critical flow in an open channel with a free water surface is characterized by several conditions (Fletcher and Grace 1972):
- The specific energy is a minimum for a given flow rate (see Figure OC-1).
- The discharge is a maximum for a given specific energy.
- The specific force is a minimum for a given discharge.
- The velocity head is equal to half the hydraulic depth in a channel of small slope.
- The Froude number is equal to 1.0 (see Equation OC-7).
- The velocity of flow in a channel of small slope is equal to the speed of small gravity waves in shallow water.
If the critical state of flow exists throughout an entire reach, the channel flow is critical flow, and the channel slope is at critical slope, Scr. A slope less than Scrwill cause subcritical flow, and a slope greater than Scrwill cause supercritical flow. Critical depth is the depth of maximum discharge when the specific energy is held constant. A flow at or near the critical state is not stable and as such flows at Froude numbers between 0.8 and 1.2 shall be avoided. In design, if the depth is found to be at or near critical, the shape or slope shall be changed to achieve greater hydraulic stability.
The general expression for flow at critical depth is:
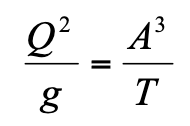 (Equation OC-8)
Where:
Q = Discharge (cfs)
g = Gravitation acceleration (32.2 ft/sec2)
A = Cross-sectional area of flow (ft2)
T = Channel top width at the water surface (ft)
When flow is at critical depth, Equation OC-8 must be satisfied, regardless of the shape of the channel.
2.1.4.2. Subcritical Flow
Flows with a Froude number less than 1.0 are subcritical flows and have the following characteristics relative to critical flows (Maricopa County 2000):
- Flow velocity is lower.
- Flow depth is greater.
- Hydraulic losses are lower.
- Erosive power is less.
- Behavior is easily described by relatively simple mathematical equations.
- Surface waves can propagate upstream and downstream, and the control is always located downstream.
Most stable natural channels have subcritical flow regimes. Consistent with the City’s philosophy that the most successful artificial channels utilize characteristics of stable natural channels, major drainage design should seek to create channels with subcritical flow regimes.
A concrete-lined channel shall not be used for subcritical flows except in unusual circumstances where a narrow right-of-way exists. A stabilized natural channel, a wide grass-lined channel, or a channel with a wetland bottom are most preferred in the City storm drainage system. Do not design a subcritical channel for a Froude number greater than 0.8 using the velocity and depth calculated with the lowest recommended range for Manning’s n (Table OC-7). When designing a concrete-lined channel for subcritical flow, use a Manning’s n = 0.013 for capacity calculations and 0.011 to check whether the flow could go supercritical. If significant sediment deposition or sediment transport is likely, a Manning's n greater than 0.013 may be necessary for capacity calculations.
2.1.4.3. Supercritical Flow
Flows with a Froude number greater than 1.0 are supercritical flows and have the following characteristics relative to critical flows (Maricopa County 2000):
- Flows have higher velocities.
- Depth of flow is shallower.
- Hydraulic losses are higher.
- Erosive power is greater.
- Surface waves propagate downstream only.
Supercritical flow in an open channel in an urban area creates hazards that the designer must consider. From a practical standpoint, it is generally not practical to have curvature in a channel with supercritical flow. Careful attention must be taken to prevent excessive oscillatory waves, which can extend down the entire length of the channel from only minor obstructions upstream. Imperfections at joints can cause rapid deterioration of the joints, which may cause a complete failure of the channel. In addition, high velocity flow at cracks or joints creates an uplift force by creating zones of flow separation with negative pressures and converts the velocity head to pressure head under the liner which can virtually tear out concrete slabs. It is evident that when designing a lined channel with supercritical flow, the designer must use utmost care and consider all relevant factors.
In the City of Rogers, all channels carrying supercritical flow shall be lined with continuously reinforced concrete linings, both longitudinally and laterally. The concrete linings must be protected from hydrostatic uplift forces that are often created by a high water table or momentary inflow behind the lining from localized flooding. See Section 3.3.2 for concrete lining specifications. For supercritical flow, minor downstream obstructions do not create any backwater effect. Backwater computation methods are applicable for computing the water surface profile (see Section 3.1.6) or the energy gradient in channels having a supercritical flow; however, the computations must proceed in a downstream direction. The designer must take care to prevent the possibility of unanticipated hydraulic jumps forming in the channel. Do not design a supercritical channel for a Froude number less than 1.2.
Roughness coefficients for lined channels are particularly important when dealing with supercritical flow. Once a particular roughness coefficient is chosen, the construction inspection must be carried out in a manner to insure that the particular roughness is obtained.
2.2.1. Design Velocity
Minimum and maximum velocities must be considered in the design of open channels. From structural and stability standpoints, maximum velocities are of concern; however, minimum velocities shall also be considered in design with respect to sediment accumulation and channel maintenance. For channels with high velocity flows, drop structures, suitable channel lining, check dams or other velocity controls will be necessary to control erosion and maintain channel stability. Froude number criteria also restrict velocity. Subcritical flow is desirable since the velocity for subcritical flow is less than that of critical or supercritical flow for a given discharge.
The flow velocity during the major design storm (i.e., 100-year) must recognize the scour potential of the channel, whether natural, grassed, bioengineered, riprapped or concrete-lined. Average velocities need to be determined using backwater calculations, which account for water drawdowns at drops, expansions, contractions and other structural controls. Velocities must be kept sufficiently low to prevent excessive erosion in the channel. As preliminary design criteria, flow velocities shall not exceed velocities and Froude numbers given in Table OC-1 and Table OC-2 for non-reinforced channel linings and, in general, shall not exceed 18 ft/sec for reinforced channel linings. Channel-specific velocity criteria depend greatly on the channel lining and slope and are presented in more detail in Section 3.0 of this chapter for various types of open channels.
Computer modeling software, such as HEC-RAS, shall be used to estimate maximum velocities for erosive or hazard considerations or localized scour in a channel. Powerful computer modeling software, such as HEC-RAS, shall be used to design/analyze primary channels while channel design spreadsheets associated with this Manual shall be used in the design of tertiary and secondary channels. Computer modeling software that is utilized on a development’s site must be found on the most up to date list of FEMA approved Hydrologic & Hydraulic Numerical Models Meeting the Minimum Requirement of National Flood Insurance Program.
2.2.2. Design Depths
The maximum design depths of flow should also recognize the scour potential of the channel lining and the bank materials. Scouring power of water increases in proportion to the third to fifth power of flow depth and is also a function of the length of time flow is occurring (USBR 1984). As criteria, the design depth of flow for the major storm runoff flow during a 100-year flood shall not exceed 5.0 feet in areas of the channel cross section outside the low-flow channel area, and less depth is desirable for channel stability. Low-flow channel depth shall be between 3.0 and 5.0 feet.
2.2.3. Design Slopes
2.2.3.1. Channel Slope
The slope of a channel affects flow velocity, depth, and regime and can have a significant impact on erosion and channel stability. Channel slope criteria vary based on the type of channel; however, the slope of a channel shall not be so steep as to result in a Froude number greater than 0.5 or 0.8, depending on soil erodibility characteristics (see Table OC-1 through Table OC-5), for the 100-year event. For steep-gradient drainageways, drop structures are necessary to meet slope criteria. For purposes of this Manual, design of drop structures is not specifically addressed. Instead the design engineer is directed to FHWA’s Hydraulic Engineering Circular No. 14, 3rd Edition (HEC-14 2006), Hydraulic Design of Energy Dissipators for Culverts and Channels. An important consideration in channel slope is sinuosity of the channel—straightening of a natural channel inevitably results in an increase in slope. Conversely, for a constructed channel, a design incorporating meanders can be used to satisfy slope criteria, potentially reducing the number of drop structures required.
2.2.3.2. Side Slopes
The flatter the side slopes, the more stable channel banks remain. For grassed channels, channels with wetland bottoms, and bioengineered channels, side slopes shall not be steeper than 3H:1V. Channels that require minimal slope maintenance such as concrete channels may have side slopes as steep as 1.5H:1V, although public safety issues must be taken into account. For riprap-lined channels, side slopes shall not be steeper than 2.5H:1V (rip-rap lined channels shall only be used upon approval by the City).
2.2.4. Curvature and Transitions
Generally, the gentler the curves, the better the channel will function. Channel alignments should not be selected to maximize land-use opportunities for lot layout; instead, lot layouts should be selected based on channel alignment. The centerline curvature of the channel shall have a radius of at least two-times (2x) the top width of the 100-year flow channel.The exception to this curvature requirement is for concrete channels that may experience supercritical flow conditions. From a practical standpoint, it is not advisable to have any curvature in a channel conveying supercritical flow, since minor perturbations can be amplified as they move downstream.
Superelevation must also be considered with respect to curvature. Curves in a channel cause the flow velocity to be greater on the outside of the curve. Due to centrifugal force the depth of flow is greater on the outside of a curve. This rise in water surface on the outside of a curve is referred to as superelevation. For subcritical flows, superelevation can be estimated by:
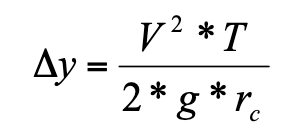 (Equation OC-9)
in which:
Δy = Increase in water surface elevation above average elevation due to superelevation (ft)
V = Mean flow velocity (ft/sec)
T= Channel top width at the water surface under design flow conditions (ft)
g= Gravitational constant (32.2 ft/sec2)
rc= Radius of curvature (ft)
Furthermore, transitions (expansions and contractions) are addressed in Section 3.4.2.6 (riprap-lined channels) and in Chapter 7 – Culvert / Bridge Hydraulic Design.
2.2.5. Design Discharge Freeboard
Residual discharge freeboard is necessary to ensure that a design developed using idealized equations will perform as desired under actual conditions. The amount of residual freeboard that must be allowed depends on the type of channel and the location and elevation of structures adjacent to the channel. Preserving existing floodplains maximizes “natural” freeboard. Freeboard requirements are addressed for specific channel types in Section 3.0 of this chapter.
2.2.6. Erosion Control
For major drainage channels, protection against erosion is key to maintaining channel stability. Unless hard-lined and vigilantly maintained, most major drainage channels are susceptible to at least some degree of erosion. The concave outer banks of stream bends are especially susceptible to erosion and may require armoring with riprap for grassed, bioengineered, or wetland bottom channels. While high sediment loads to a channel may occur as a result of active construction in the watershed, once an area is fully urbanized, the channel behavior changes. Flows increase significantly due to the increase in imperviousness in the watershed, and the runoff from these fully urbanized areas contains relatively low levels of sediment. As a result, the potential for erosion in the channel increases.
In the Rogers area, most waterways will need the construction of drops (see HEC-14 2006) and/or erosion cutoff check structures to control the channel slope. Typically, these grade control structures are spaced to limit channel degradation to what is expected to be the final stable longitudinal slope after full urbanization of the tributary watershed. The designer should also be aware of the erosion potential created by constriction and poorly vegetated areas. An example is a bridge crossing over a grassed major drainage channel, where velocities increase as a result of the constriction created by the bridge, and bank cover is poor due to the inability of grass to grow in the shade of the bridge. In such a situation, structural stabilization is needed.
Another aspect of erosion control for major drainage channels is controlling erosion during and after construction of channel improvements. Construction of channel improvements during times in the year that are typically dryer can reduce the risk of erosion from storm runoff. Temporary stabilization measures including seeding and mulching and erosion controls such as installation and maintenance of silt fencing shall be used during construction of major drainage improvements to minimize erosion. Refer to Chapter 8 – Construction Site Stormwater Management for additional erosion control ideas for open channels.
2.2.7. Utility Proximity
It is important to consider the location and depth of utilities near open channels. Utilities that are too close linearly and too shallow when crossing a channel pose future maintenance problems along with future planning issues. Keeping utilities out of the general operating plane of open channels allows the entity maintaining and operating the channel more flexibility when it comes to dredging, repairing, widening, or other improvements/maintenance. For this reason, in all channels within the City no utilities are allowed between the top of banks except for crossings which must be a minimum of 3-feet deep. Furthermore, no utilities are allowed between the maintenance road’s stable surface and top of bank. By implementing these proximity requirements between open channels and utilities the City hopes to prevent costly conflicts between open channels and utilities in the future.
2.3.1. Types of Channels for Major Drainageways
The types of major drainage channels available to the designer are almost infinite. Selection of a channel type depends upon applying good hydraulic practice, environmental design, sociological impact, and basic project requirements. However, from a practical standpoint, it is useful to identify general types of channels that can be used by the designer as starting points in the design process. The following types of channels may serve as major drainage channels for the 100-year runoff event in urban areas:
Natural Channels—Natural channels are drainageways carved or shaped by nature before urbanization occurs. They often, but not always, have mild slopes and are reasonably stable. As the channel’s tributary watershed urbanizes, natural channels often experience erosion and degrade. As a result, they require grade control checks and stabilization measures.
Grass-Lined Channels—Among various types of constructed or modified drainageways, grass-lined channels are some of the most frequently used and desirable channel types. They provide channel storage, lower velocities, and various multiple use benefits. Grass-lined channels in urbanizing watersheds shall be stabilized with grade control structures to prevent downcutting, depression of the water table, and degradation of natural vegetation. Low-flow areas may need to be armored or otherwise stabilized to guard against erosion.
Composite Channels—Composite channels have a distinct low-flow channel that is vegetated with a mixture of wetland and riparian species. A monoculture of vegetation shall be avoided. In composite channels, dry weather (base) flows are encouraged to meander from one side of the low-flow channel to the other. The low-flow channel banks need heavy-duty biostabilization that includes rock lining to protect against undermining and bank erosion.
Concrete-Lined Channels—Concrete-lined channels are high velocity artificial drainageways that are not recommended for use in urban areas. The use of this channel type is subject to City approval. However, in retrofit situations where existing flooding problems need to be solved and where right-of-way is limited, concrete channels can offer advantages over other types of open drainageways.
Riprap-Lined Channels (and use of TRMs)—Riprap-lined channels offer a compromise between grass-lined channels and concrete-lined channels. Riprap-lined channels can somewhat reduce right-of-way needs relative to grass-lined channels and can handle higher velocities and greater depths than grass-lined channels. Relative to concrete-lined channels, velocities in riprap-lined channels are generally not as high. Riprap-lined channels are more difficult to keep clean and maintain than other types of channels and are recommended for consideration only in retrofit situations where existing urban flooding problems are being addressed. The use of this channel type is discouraged and subject to City approval. A more desirable alternative to the use of riprap would be substituting turf reinforcement mats (TRMs) in place of riprap. This method is encouraged by the City when the use of such TRMs would adhere to the manufacturers recommended application. Refer to the EPA’s Storm Water Technology Fact Sheet – Turf Reinforcement Mats document (http://www.epa.gov/ – EPA 832-F-99-002) for more information concerning the employment of TRMs.
Bioengineered Channels—Bioengineered channels utilize vegetative components and other natural materials in combination with structural measures to stabilize existing channels in existing urban areas, areas undergoing urbanization, and to construct natural-like channels that are stable and resistant to erosion. Bioengineered channels provide channel storage, slower velocities, and various multiple use benefits.
2.3.2. Factors to Consider in Selection of Channel Type and Alignment
The choice of channel type and alignment must be based upon a variety of multi-disciplinary factors and complex considerations that include, among others:
Hydraulic Considerations
- Slope of thalweg
- Right-of-way
- Capacity needs
- Basin sediment yield
- Topography
- Ability to drain adjacent lands
Structural Considerations
- Availability of material
- Areas for wasting fill
- Seepage and uplift forces
- Shear stresses
- Pressures and pressure fluctuations
- Momentum transfer
Environmental Considerations
- Neighborhood character
- Neighborhood aesthetic requirements
- Street and traffic patterns
- Municipal or county policies
- Need for new green areas
- Wetland mitigation
- Character of existing channel
- Wildlife habitat
- Water quality enhancement
Sociological Considerations
- Neighborhood social patterns
- Neighborhood children population
- Public safety of proposed facilities for storm and non-storm conditions
- Pedestrian traffic
- Recreational needs
- Right-of-way corridor needs
Maintenance Considerations
- Life expectancy
- Repair and reconstruction needs
- Maintainability
- Proven performance
- Accessibility
- Regulatory constraints to maintenance
2.3.3. Environmental Permitting Issues
Environmental permitting, in particular wetland permitting, must be considered in selection of the type of major drainage channel. To assist with the selection of the type of open channel improvements to be used where environmental permitting is concerned, a flow chart is presented in Figure OC-2. The flow chart contains a series of questions to be considered in light of the requirements in this Manual and the requirements of the CWA, Section 404 (dredge and fill in jurisdictional wetlands and “Waters of the United States”).
Following along with the chart, the first step is to determine whether channelization is needed or desired. In many cases, a well-established natural drainageway and its associated floodplain could be preserved and protected from erosion damage. Therefore, before deciding to channelize, assess whether the value of reclaimed lands will justify the cost of channelization and whether a new channel will provide greater community and environmental benefits than the existing drainageway.
If the decision is to neither channelize nor re-channelize an existing drainageway, investigate the stability of the natural drainageway and its banks, design measures to stabilize the longitudinal grade and banks, if needed in selected areas, and obtain, if necessary, Section 404 permits and other approvals for these improvements. The reader should review the requirements for natural channels to ensure any channel improvements meet the City’s requirements.
If the decision is to channelize, then determine whether the existing natural drainageway has a perennial flow, evidence of wetland vegetation, or is a well-established intermittent channel. This will often require the assistance of a biologist with wetland training. If any of these conditions exist, then the project is likely to be subject to individual or nationwide Section 404 permitting requirements. Regardless, it is suggested the designer check with the local USACE office early to determine which permit will be needed. Keep in mind that it is the responsibility of the proponent to comply with all applicable federal and state laws and regulations. Approvals by the local authorities do not supersede or waive compliance with these federal laws.
Figure OC-2 – Flow Chart for Selecting Channel Type and Assessing Need for 404 Permit (UDFCD USDCM 2002)
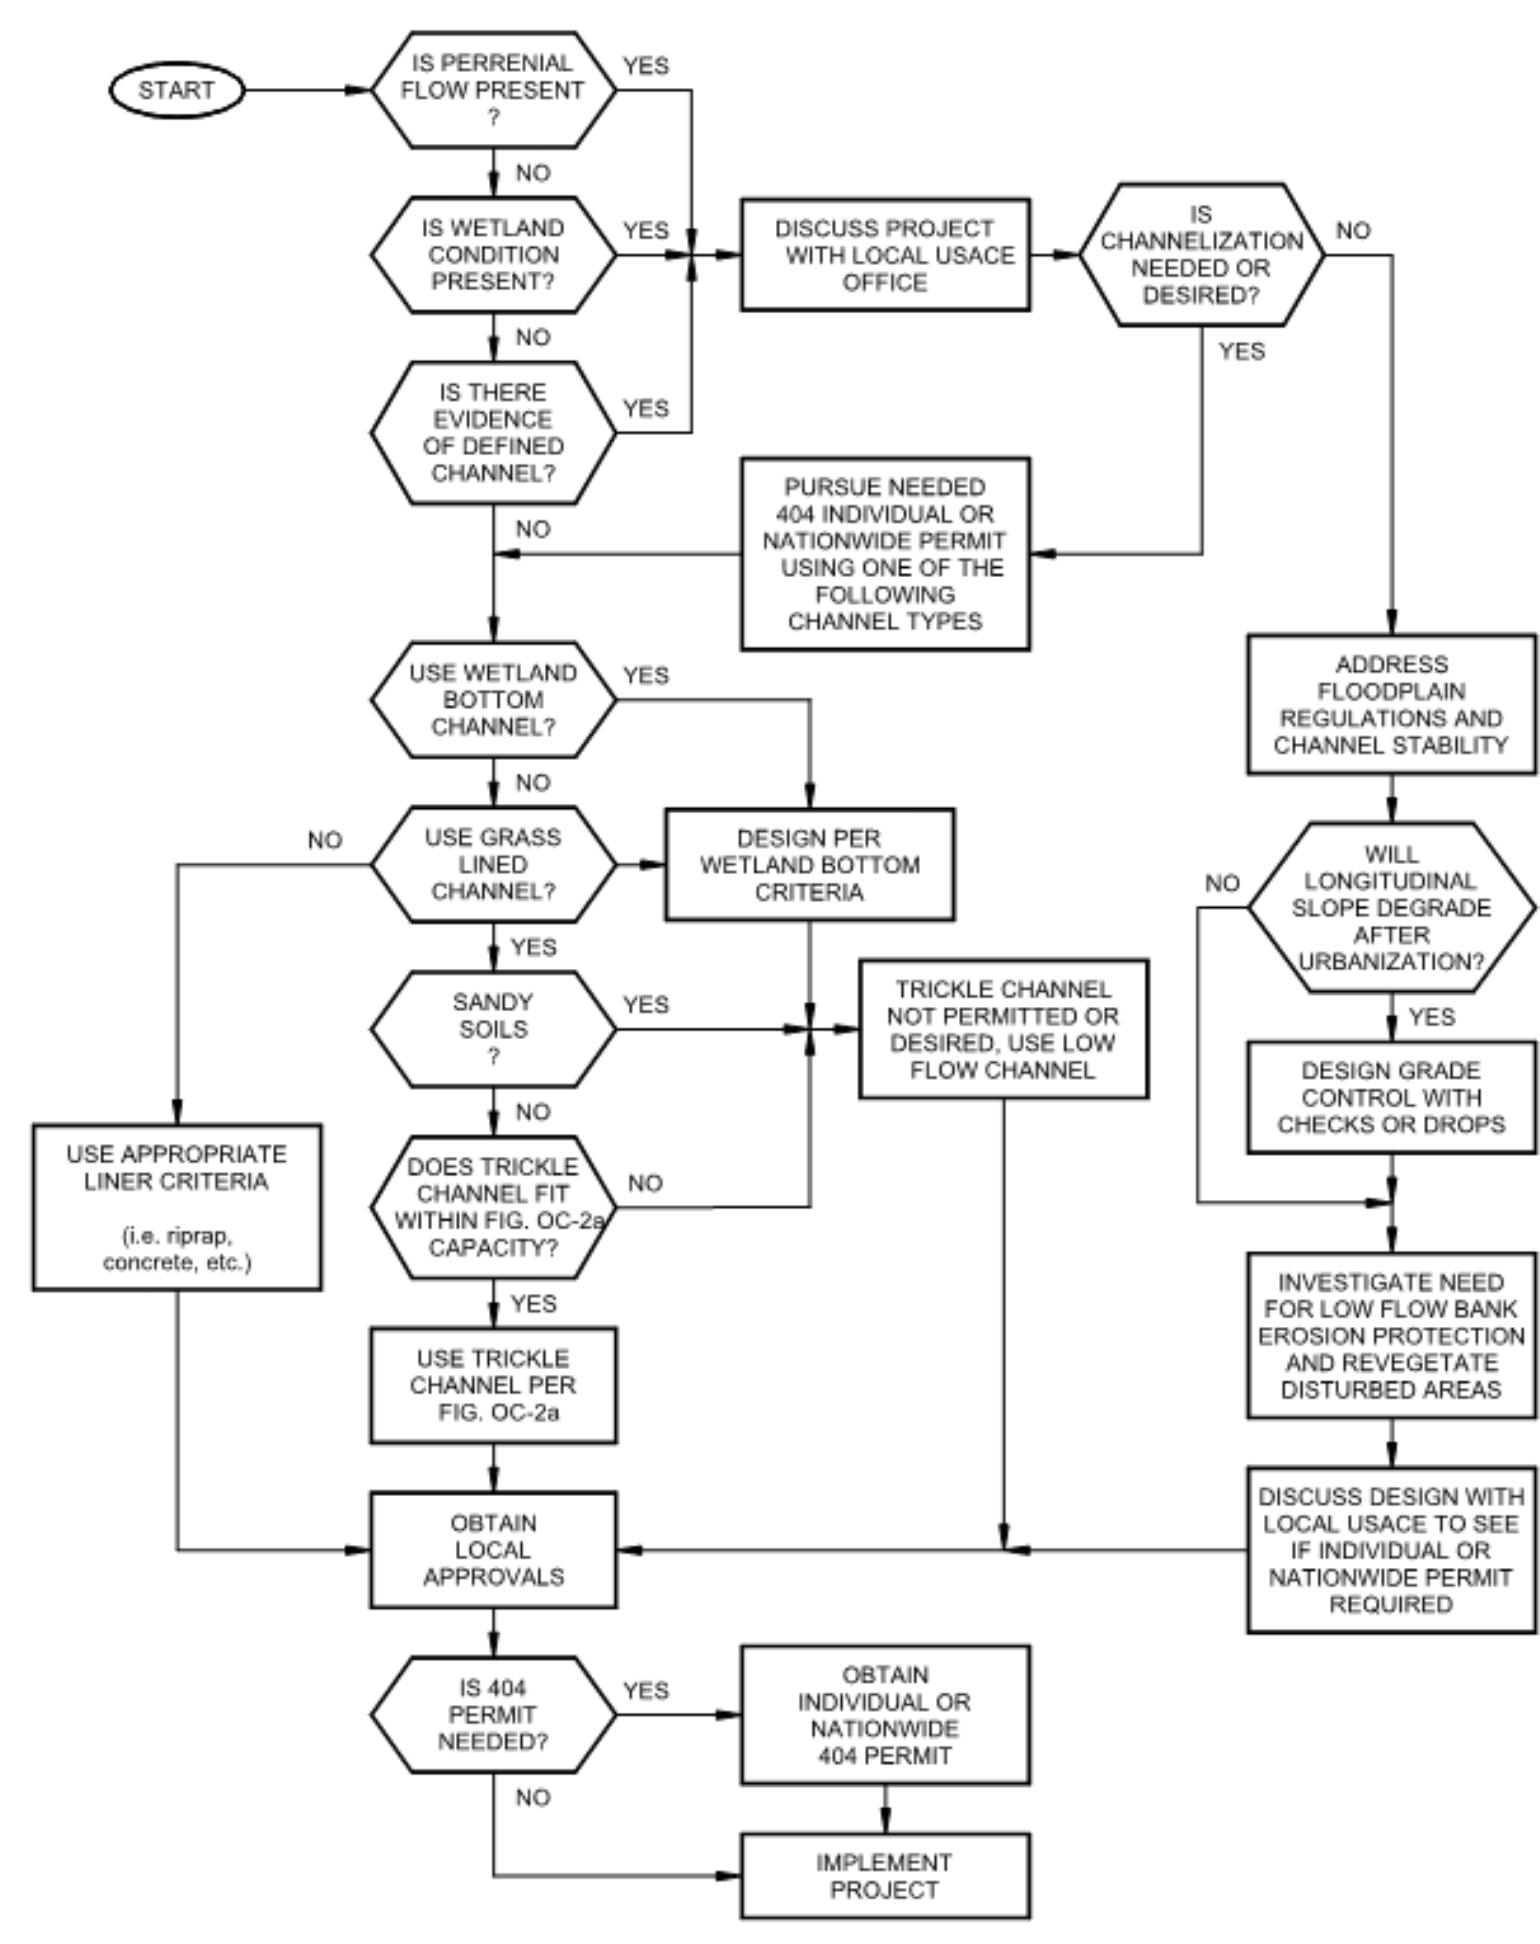
2.3.4. Maintenance
All drainage channels in urban areas will require periodic maintenance to ensure they are capable of conveying their design flow and to ensure that channels do not become a public nuisance and eyesore. Routine maintenance (i.e., mowing for weed control or annual or seasonal clean-outs), unscheduled maintenance (i.e., inspection and clean-out after large events) and restorative maintenance after some years of operation are expected.
A maintenance access road with a minimum passage width of 12-feet shall be provided along the entire length of all major drainageways except at drop structures, where a 20-foot maintenance road is needed. Maintenance roads shall consist of a 10-foot (minimum) wide stable surface consisting of a typical section directed by the City. This typical section will be determined during the design review process.
Furthermore, it will be necessary to consider the location and implementation of maintenance access ramps along drainage easements and where open channels intersect city streets. The purpose of a maintenance access ramp will be to serve for use by City maintenance vehicles in order to provide definitive and convenient access directly into an open channel. Maintenance access ramps may be something as simple as providing an embankment slope flatter than required for the specific channel type for which access is desired. Or it could include the detailed construction of a permanent heavy duty pavement to provide access for more substantial equipment into the channel. Decisions about the locations and type of these access ramps will be determined by the City during the planning and review process.
Further discussion defining the party responsible for maintaining a specific type of open channel is discussed in Section 2.5.
Table OC-7a – Open Channel Maintenance Classification Physical Criteria5
Channel Designation | Maintenance/Repair Responsibility Assigned to … | Channel Criteria for Design Event |
|---|---|---|
Primary | City, POA, developer | ≥ 2-foot flow depth 1 & ≥ 10-foot bottom width 1 |
Secondary | POA, developer | ≥ 1-foot flow depth 2 & ≥ 5-foot bottom width 2 or ≥ 1.5-foot flow depth 3 & ≥ 10-foot top width of flow 3 |
Tertiary | Property owner / homeowner | ≤ 1-foot flow depth 4 or ≤ 10-foot top width of flow 4 |
| ||
Backwater analysis computer modeling software, such as HEC-RAS, shall be used to design/analyze primary channels while channel design spreadsheets associated with this Manual shall be used in the design of tertiary and secondary channels, though the city may require a backwater analysis for some secondary channels.
3.1.1. Design Criteria
Figure OC-4, Figure OC-5, and Figure OC-6 provide useful representative sketches for grass-lined channels showing the acceptable design criteria for grass-lined channels.
3.1.1.1. Design Velocity and Froude number
In determining flow velocity during the major design storm (100-year event), the designer must recognize the scour potential of the soil-vegetative cover complex. Average velocities need to be determined using backwater calculations, which account for water draw-down at drops, expansions, contractions, and other structural controls. Velocities must be kept sufficiently low to prevent excessive erosion in the channel. The maximum normal depth velocities and Froude numbers for 100-year flows in a grass-lined channel are listed in Table OC-1.
3.1.1.2. Design Depths
The maximum design depths of flow should recognize the scour potential of the soil-vegetative cover complex. The scouring power of water increases in proportion to a third to a fifth power of depth of flow and is a function of the length of time flow is occurring. As preliminary criteria, the design depth of flow for the major storm runoff flow shall not exceed 5.0-feet in areas of the channel cross section outside the low-flow or trickle channel area. Normal water depth can be calculated using Manning’s Equation from Section 2.1.1 of this chapter.
3.1.1.3. Design Slopes
To function without instability, grass-lined channels normally have longitudinal slopes greater than or equal to 0.75%. Where the natural slope becomes steep enough to cause velocities in excess of those in Table OC-1 for grass-lined channels, drop structures shall be utilized.
With respect to side slopes, the flatter the side slope, the more stable it is. For grassed channels, side slopes shall not be steeper than 3H:1V.
3.1.1.4. Curvature
The more gentle the curve, the better the channel will function. At a minimum, centerline curves shall have a radius that is greater than two-times (2x) the top width (i.e., 2·T) of the 100-year design flow (or other major flow) in the channel.
3.1.1.5. Design Discharge Freeboard
Bridge deck bottoms and sanitary sewers (culvert tops, etc.) often control the freeboard along the channel in urban areas. Where such constraints do not control the freeboard, the allowance for freeboard shall be determined by the conditions adjacent to the channel. For instance, localized overflow in certain areas may be acceptable and may provide flow storage benefits. In general, a minimum freeboard of 1-foot (or 2-foot if directed by the City) shall be allowed between the water surface and top of bank. Along major streams such as Osage Creek, Turtle Creek, Prairie Creek, Blossom Way Creek, and others where potential for downed trees and other debris exists during a flood, a 2-foot freeboard is required for the 100-year design flow.
For curves in the channel, superelevation shall be evaluated using Equation OC-9 in Section 2.2.4 and shall be included in addition to freeboard.
3.1.2. Channel Cross Sections
The channel shape may be almost any type suitable to the location and environmental conditions. Often the shape can be chosen to suit open space and recreational needs, to create wildlife habitat, and/or to create additional sociological benefits (Murphy 1971). Typical cross sections suitable for grass-lined channels are shown in Figure OC-4.
3.1.2.1. Bottom Width
The bottom width should be designed to satisfy the hydraulic capacity of the cross section recognizing the limitations on velocity, depth, and Froude number. For a given discharge, the bottom width can be calculated using the depth, velocity, and Froude number constraints in Section 3.1.1.1 and Section 3.1.1.2 using Equation OC-2 from Section 2.1.1 of this chapter. In no case shall the bottom of the channel be any less than 5-feet wide.
3.1.2.2. Trickle and Low-Flow Channels
When base flow is present or is anticipated as the drainage area develops, a trickle or low-flow channel may be required as determined by the City. Steady base flow will affect the growth of grass in the bottom of the channel, create maintenance needs, and can cause erosion. The purpose of a trickle channel is to convey very small perennial flows in a localized section of the overall channel to prevent adverse maintenance and erosion conditions. A trickle channel is a defined (typically narrow) longitudinal channel located at the thalweg of the overall prime channel and is used to transport steady base flows, typically ≤ 1-ft. Steady base flows that would be typical of a trickle channel to convey would be runoff from lawn irrigation, groundwater inflow into the channel, etc. Figure OC-2a should be used to estimate the required capacity of a trickle channel based on the percent of impervious area, Ia.
A low-flow channel on the other hand serves two essential purposes. One purpose of a low-flow channel would be that of a trickle channel just on a larger scale. Should a channel have a steady base flow that exceeds the limits set forth in Figure OC-2a for channel capacity for a specific impervious area, Ia, a low-flow channel having stabilized banks must be used in place of a trickle channel. Secondly, a low-flow channel is designed to carry stormwater runoff conveyed in the channel during smaller and more common design storm events. A low-flow channel is designed to flow full at a depth ≤ 5-ft. More specific sizing and design criteria for low-flow/trickle channels are presented in Section 3.1.4 of this chapter.
Figure OC-2a – Minimum Capacity Requirements for Trickle Channel (UDFCD USDCM 2002)
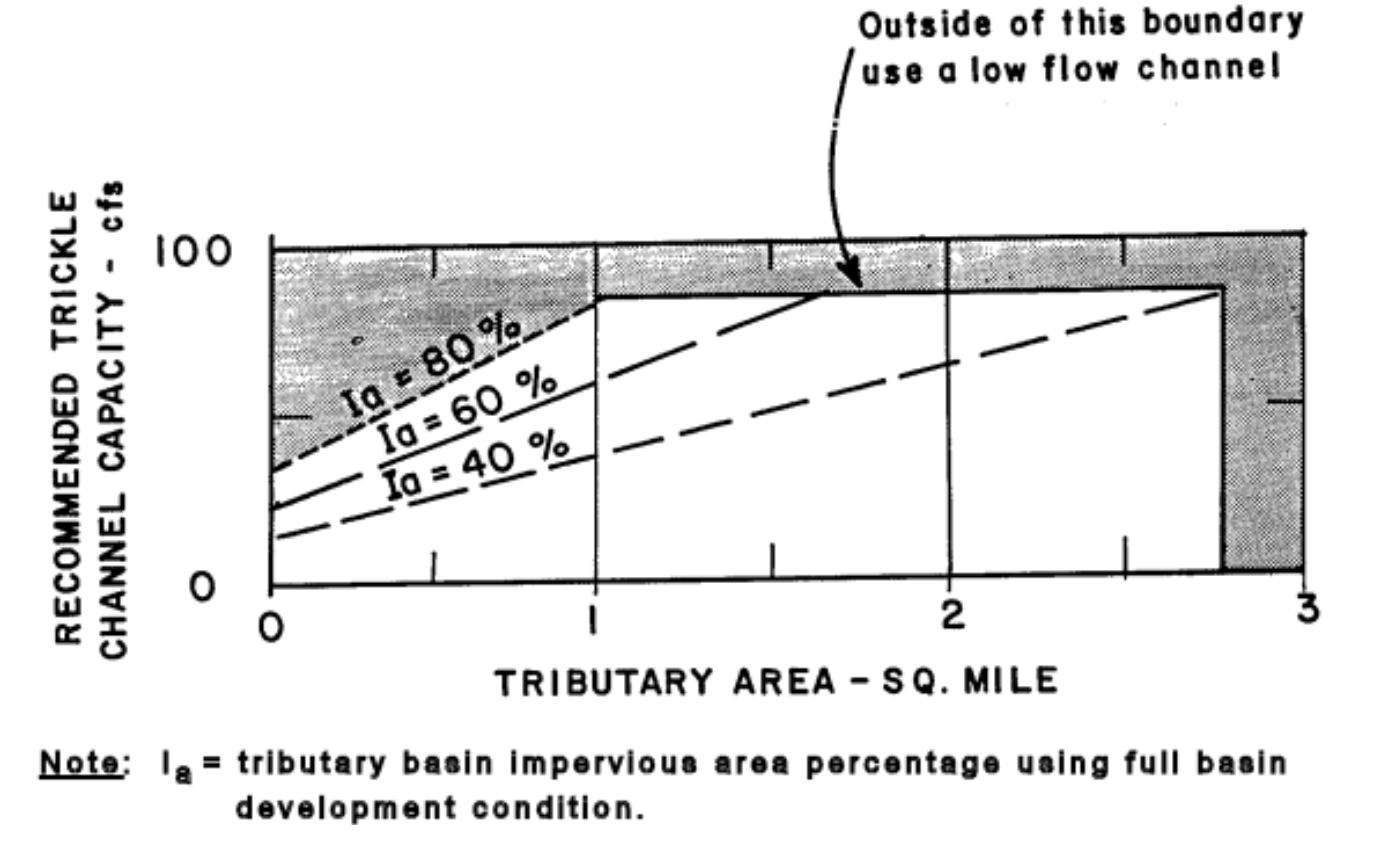
3.1.2.3. Outfalls Into Channel
Outfalls into grass-lined, major channels shall be at least 1-foot above the channel invert with adequate erosion protection provided at the outlet.
3.1.3. Roughness Coefficients
Designers shall use 0.040 and 0.030 for Manning’s roughness coefficients, n, for grass-lined channels when checking design channel capacity (flow depth) and design maximum velocity (channel stability), respectively. In addition to these two set Manning’s n, the designer is allowed to determine project specific roughness coefficients for grass-lined channels. Project specific roughness coefficients for grass-lined channels shall be determined based upon the product of the velocity and the hydraulic radius for different vegetative retardance classes (see Figure OC-3). When using the retardance curves for grass-lined channels, use Retardance C for finding Manning’s n for determining channel capacity (depth) in a mature channel and Retardance D for finding the controlling velocity in a newly constructed channel to determine stability. The designer is referenced to SCS Technical Paper No. 61 – Handbook of Channel Design for Soil and Water Conservation and FHWA’s Hydraulic Engineering Circular No. 15, 3rd Edition (HEC-15 2005) for additional information concerning the background and development of the retardance curves in Figure OC-3.
3.1.4. Trickle and Low-Flow Channels
The low flows and present base flows from urban areas must be given specific attention. Waterways which are normally dry prior to urbanization will often have a continuous base flow after urbanization, both overland and from groundwater inflow. Continuous flow over grass or what used to be intermittent waterways will cause the channel profile to degrade, its cross-section to widen, its meanders to increase, destroy a healthy grass stand and may create boggy nuisance conditions.
A trickle channel with a porous bottom (i.e., unlined or riprapped) or a low-flow channel is required for all urban grass-lined channels. In some cases, a traditional concrete trickle channel may be necessary, but should be limited to headland tributary channels created in areas where no natural channel previously existed. However, low-flow/trickle channels with natural-like linings are preferable. Trickle channels with natural-like linings offer an advantage over concrete-lined trickle channels because they more closely mimic natural channels, have greater aesthetic appeal, and provide habitat benefits and vegetative diversity. These linings are best when porous and allow exchange of water with adjacent groundwater table and sub-irrigate vegetation along the channel. In addition, a vegetated low-flow channel provides a degree of water quality treatment, unlike concrete lined channels that tend to flush pollutants accumulated on the impervious lining downstream during runoff events.
Steady base and/or low flows must be carried in a trickle channel or a low-flow channel. Trickle channels are to be used to pass constant base flows from groundwater or the return flow from irrigation or other constant sources of water runoff. The capacity of a trickle channel shall be 2.0% of the major (100-year storm) design flow for the fully developed condition assuming no upstream detention. Low-flow channels shall be used for larger major drainageways, streams, and rivers and for channels located on sandy soils. A low-flow channel shall have a minimum capacity of passing the 5-year storm peak flow under the fully developed watershed conditions, assuming no upstream detention. To the extent practicable, a low-flow channel shall be gently sloped and shallow to promote flow through the channel’s vegetation. See Figure OC-5 and Figure OC-6 for typical details of grass-lined channels with trickle and low-flow channels.
Using a soil-riprap mix for the low-flow channel lining can provide a stable, vegetated low-flow channel for grass-lined wetland bottom and bioengineered channels. Soil and riprap shall be mixed prior to placement for these low-flow channels. Soil-riprap low-flow channels shall have a cross slope of 1% to 2%. It’s longitudinal slope shall be consistent with the channel type used.
Figure OC-3 – Manning's n vs. VR for Two Retardances in Grass-Lined Channels (taken from SCS-TP-61 Rev. 1954)
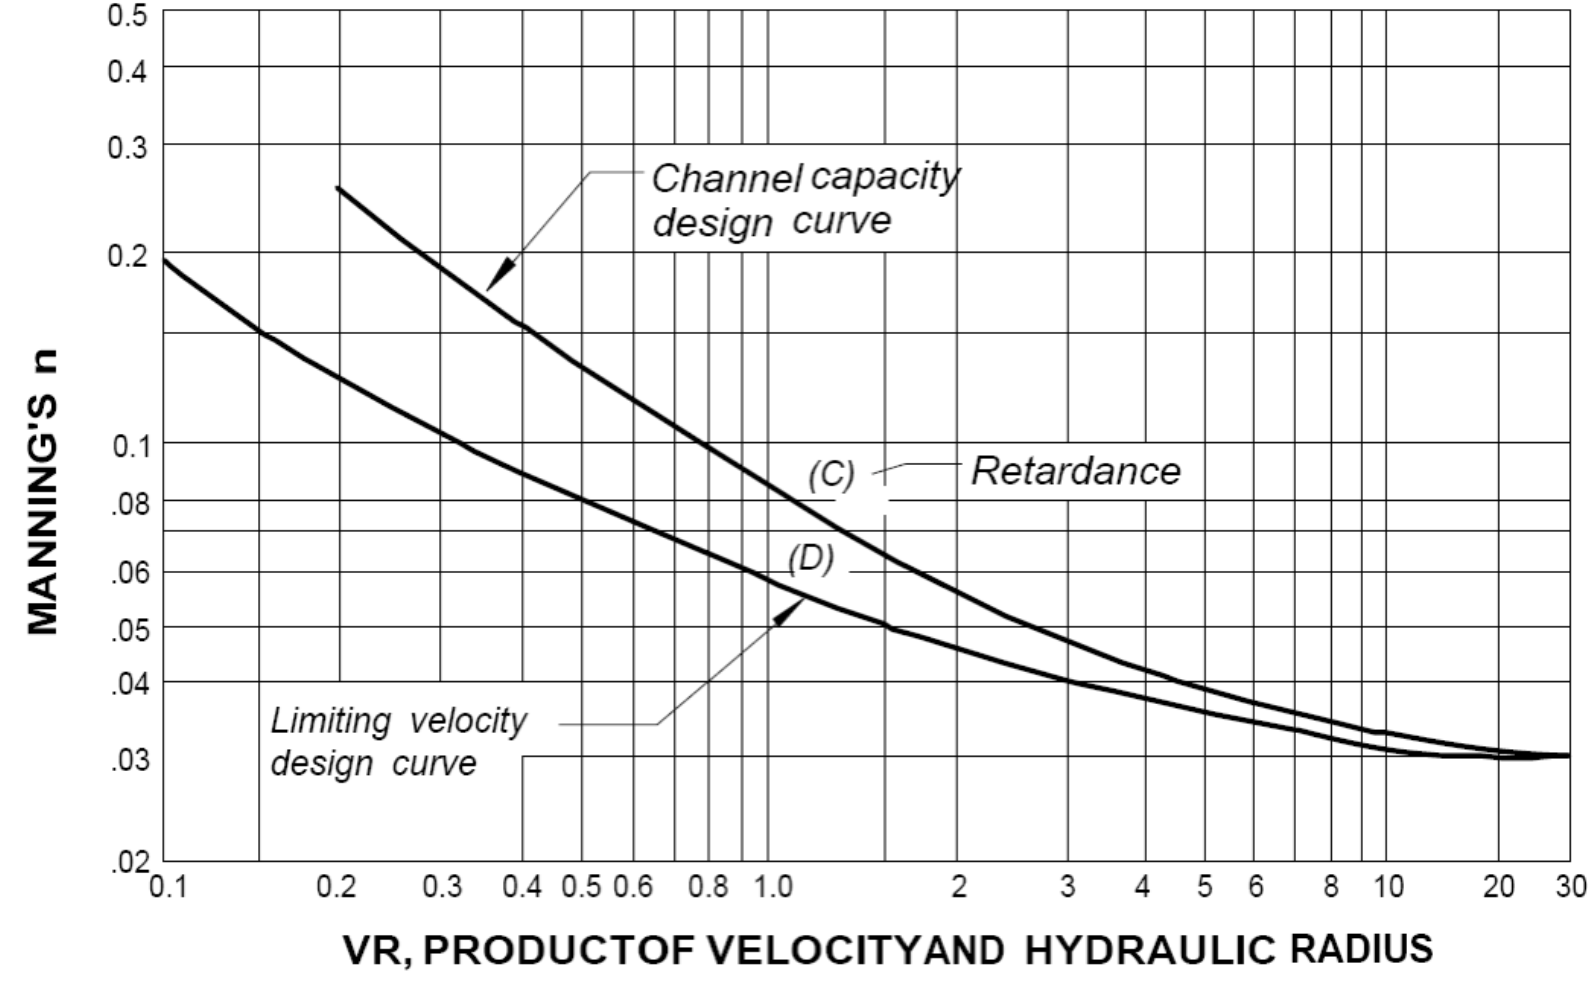
Figure OC-4 – Typical Grassed Channels (IDFCD USDCM 2002)
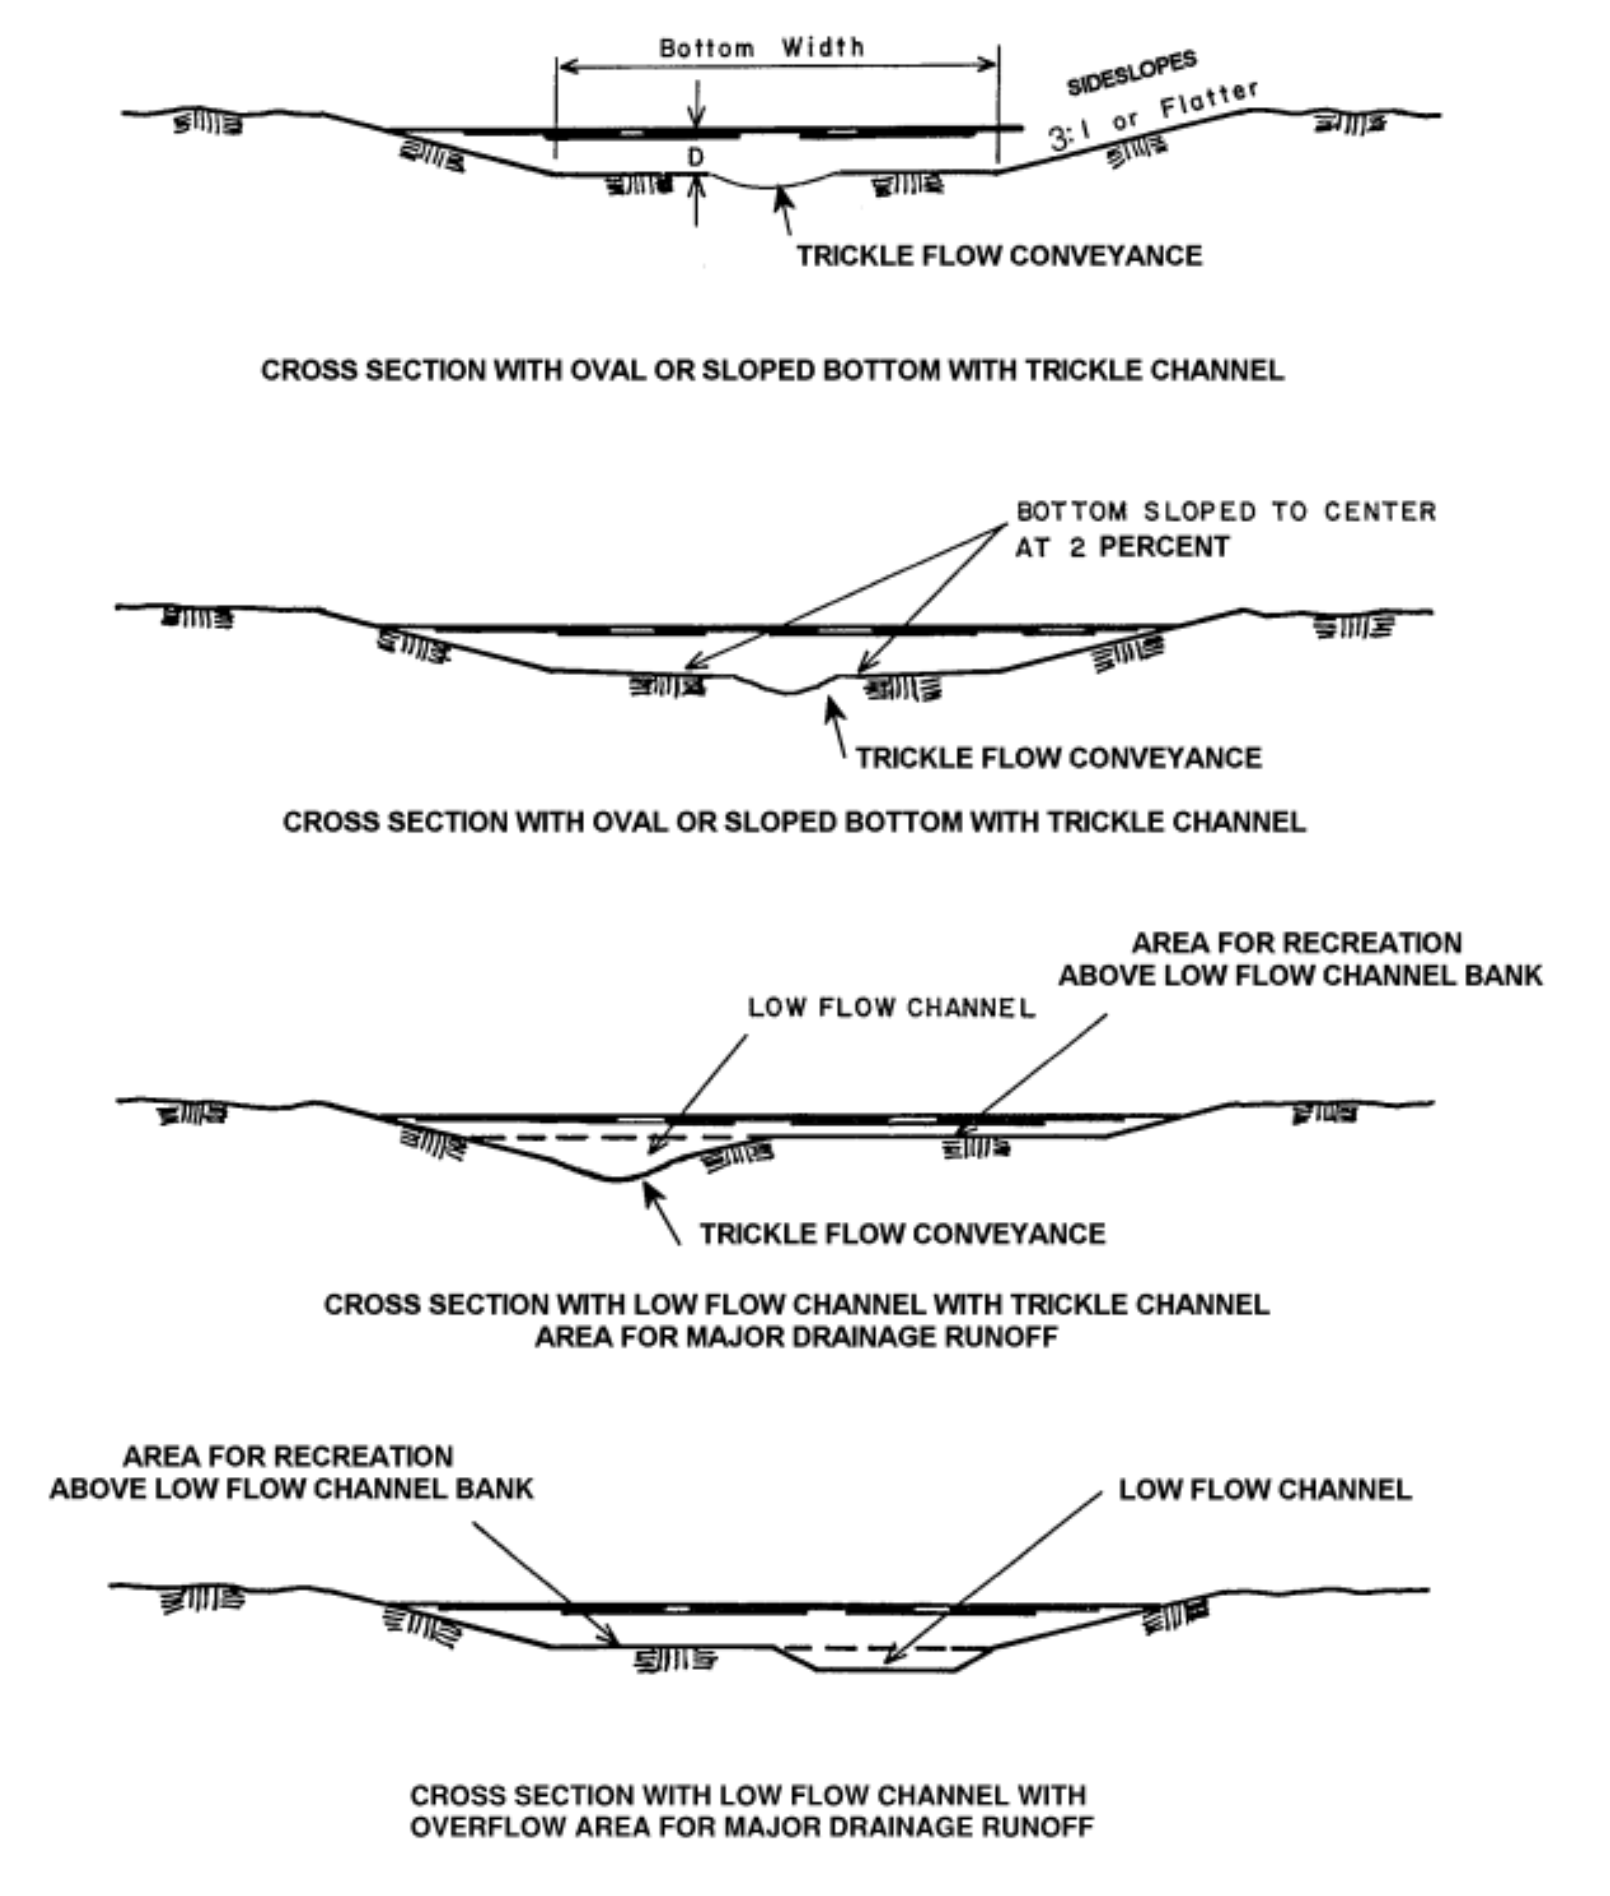
Figure OC-5 – Composite Grass-lined Channel with a Low-Flow Channel, including a Wetland Bottom Low-Flow Channel (UDFCD USDCM 2002)
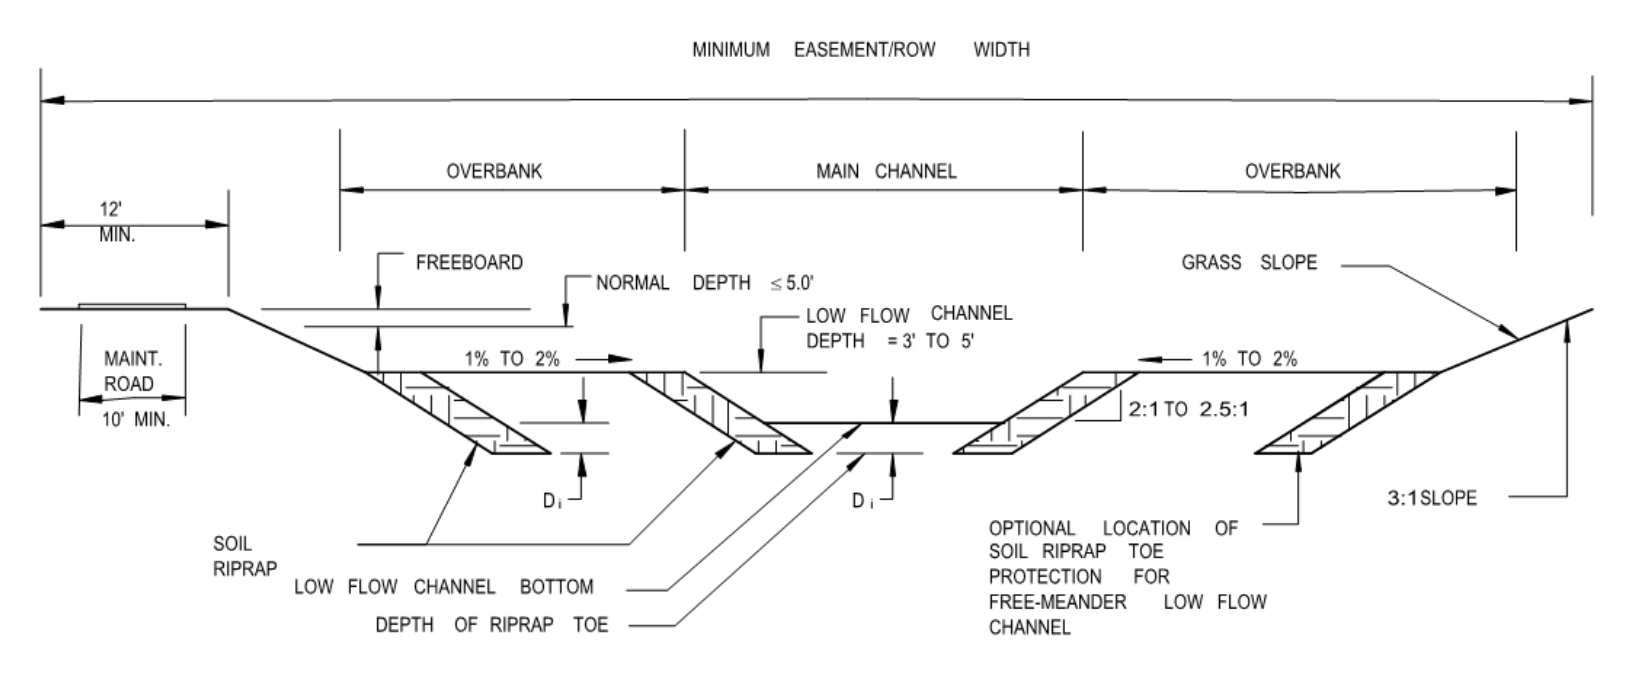
NOTE:
- Low Flow Channel: Capacity to be able to pass the 5-year storm peak discharge based on fully developed tributary watershed peak flow.
- Normal Depth: Flow depth for 100-year flow shall not exceed 5-feet, not including the low flow channel depth. 100-year flow velocity at normal depth shall not exceed 5-ft/sec.
- Freeboard: Freeboard to be 1-foot (min.) for Secondary Channels and 2-foot (min.) for Primary channels.
- Maintenance Access Road: Minimum stable width to be 10-feet with a clear width of 12-feet.
- Right-of-Way / Easement Width: Minimum width to include freeboard and maintenance access road.
- Overbank: Flow in excess of main channel to be carried in this area. Area may be used for recreation purposes.
- Di = 3-foot (minimum)
- Channel sideslope above low-flow channel 3H:1V or flatter, even if lined with soil riprap.
- Froude number for all flows shall not exceed 0.8.
- The channel can be designed to have the low-flow section to have a wetland bottom.
Figure OC-6 – Grass-lined Channel with a Trickle Channel (UDFCD USDCM 2002)
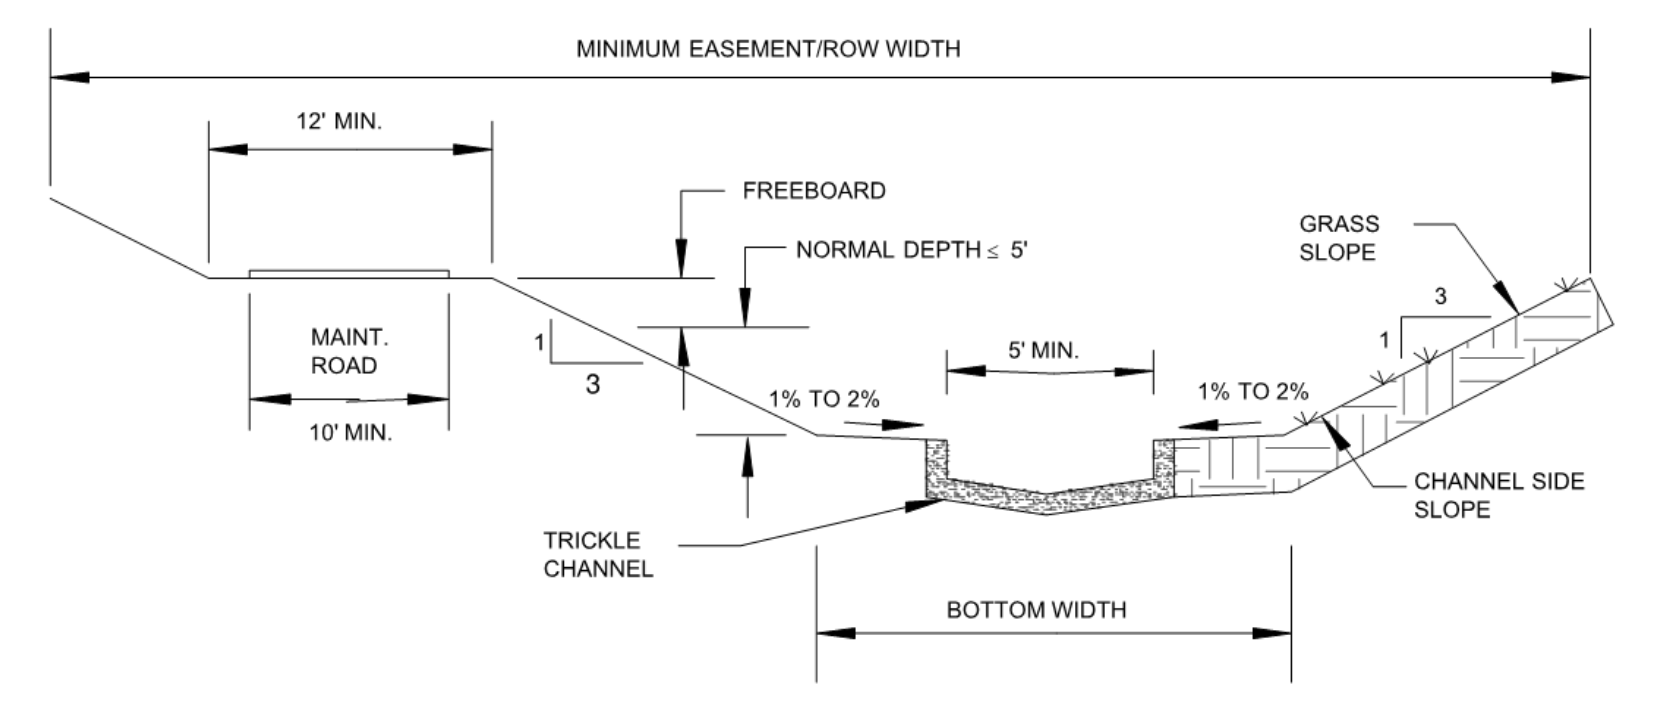
NOTE:
- Bottom Width: Consistent with maximum allowable depth and velocity requirements shall not be less than trickle channel width.
- Trickle Channel: Capacity to be approximately 2.0% of 100-year flow for the fully developed, undetained condition tributary watershed peak flow. Use natural lining when practical.
- Normal Depth: Normal depth at 100-year flow shall not exceed 5-feet. Maximum 100-year flow velocity at normal depth shall not exceed 5-ft/sec.
- Freeboard: Freeboard to be 1-foot (min.) for Secondary Channels and 2-foot (min.) for Primary channels.
- Maintenance Access Road: Minimum stable width to be 10-feet with clear width of 12-feet.
- Easement/Right-of-Way Width: Minimum width to include freeboard and maintenance access road.
- Channel Side Slope: Maximum side slope for grassed channels to be no steeper than 3:1.
- Froude Number: Maximum value for minor and major floods shall not exceed 0.8.
3.1.5. Erosion Control
Grassed channels are erodible to some degree. Experience has shown that it is uneconomical to design a grassed channel that is completely protected from erosion during a major storm. It is far better to provide reasonably erosion-resistant design with the recognition that additional erosion-control measures and corrective steps will be needed after a major runoff event. The use of drops and checks (see HEC-14 2006) at regular intervals in a grassed channel is almost always needed to safeguard the channel from serious degradation and erosion by limiting velocities in the channel and dissipating excess energy at these structures. Take advantage of other infrastructure crossing the channel, such as a concrete-encased sewer crossing the channel that can be designed to also serve the function of a grade control structure or a drop structure. Erosion tends to occur at the edges and immediately upstream and downstream of a drop. Proper shaping of the crest and the use of riprap at all drops is necessary. Grade control structures will also protect healthy and mature native vegetation (i.e., trees, shrubs, grasses, wetlands) and reduce long-term maintenance needs.
3.1.5.1. Erosion at Bends
Special erosion control measures are often needed at bends, (see Section 3.1.1.4). An estimate of protection and velocity along the outside of the bend needs to be made using the following guidelines: When rc/T≥ 8.0 (rc = channel centerline radius, T = top width of water during the major design storm), no erosion protection is needed for the bank on the outside of the bend for channels meeting the velocity and depth criteria specified in this Manual for grass-lined channels. When rc/T< 8.0, protect the bank on the outside of the bend with TRMs or riprap sized per Section 3.4.2.3 using an adjusted channel velocity determined using Equation OC-10. (TRMS are the approved method. The use of riprap will require approval by the City.)
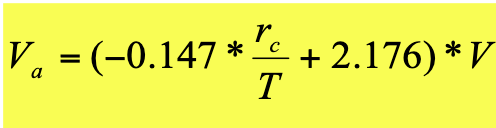 (Equation OC-10)
in which:
Va= adjusted channel velocity for riprap sizing along the outside of channel bends (ft/sec)
V= mean channel velocity for the peak flow of the major design flood (ft/sec)
rc= channel centerline radius (ft)
T= Top width of water during the major design flood (ft)
TRMs or riprap shall be applied to the outside ¼ of the channel bottom and to the channel side slope for the entire length of the bend plus a distance of 1·T upstream and 2·T downstream of the bend. When using riprap, as an alternative to lining the channel bottom, extend the riprap liner at the channel side slope to 5-feet below the channel’s bottom.
3.1.5.2. Riprap Lining of Grass-lined Channels
For long-term maintenance needs, it is required that riprap channel linings be used only in the low-flow channel portion of a composite channel, but not on the banks above the low-flow channel section, nor on the banks of other grass-lined channels, with the exception of use of riprap at bends as discussed above. For this reason whenever soil-riprap linings are used above the low-flow section, a side-slope typically used for grass-line channels is required (i.e., 3H:1V).
3.1.6. Water Surface Profile
Water surface profiles shall be computed for all channels, for the 10-year and 100-year events. Computation of the water surface profile shall include standard backwater methods, taking into consideration all losses due to changes in velocity, drops, bridge openings, and other obstructions. Computations shall begin at a known point and extend in an upstream direction for subcritical flow. It is for this reason that the channel shall be designed from a downstream direction to an upstream direction. It is necessary to show the hydraulic and energy grade lines on all preliminary and final drawings to help ensure against errors. Worksheets (D-Step and S-Step) are available in the RDM-Channels spreadsheet for calculating water surface profiles in channels using Direct Step and Standard Step Methods.
The designer must remember that open-channel flow in urban settings is usually non-uniform because of bridge openings, curves, and structures. This necessitates the use of backwater computations for all final channel design work. Additional information on generating water surface profiles for channels containing bridges and other structures can be found in Chapter 7 – Culvert / Bridge Hydraulic Design. The designer is encouraged to make use of computer modeling software, such as HEC-RAS, to carry out water surface profile calculations and checks. Computer modeling software must be found on the most up to date list of FEMA approved Hydrologic & Hydraulic Numerical Models Meeting the Minimum Requirement of National Flood Insurance Program.
3.1.7. Maintenance
Grass-lined channels must be designed with maintainability in mind. Section 2.3.4 provides guidance for elements of design that permit good maintenance of these installations.
3.1.8. Calculation Tool
Calculations for sizing of a grass-lined channel using hydraulic equations from Section 2.0 and criteria from Section 3.1 can be performed using the Channel Design and/or SCS Retardance worksheetof the RDM-Channels spreadsheet. The Composite Design worksheetof the RDM-Channels spreadsheet can be used for the design of a grass-lined channel with a low-flow channel.
3.2.1. Design Criteria
The simplified design procedures in this Manual are based on assumptions that the flow depth is affected by the maturity of vegetation in the low-flow channel, affects the channel roughness, and the rate of sediment deposition on the bottom. These assumptions are based on modern hydraulic publications and observed sediment loading of stormwater laden streams in urban areas across the country.
The recommended criteria parallel the criteria for the design of grass-lined channels (Section 3.1), with several notable differences. Composite channels are, in essence, grass-lined channels in which more dense vegetation (including wetland-type) is encouraged to grow on the bottom and sides of the low-flow channel. From a design perspective, composite channels are differentiated from smaller grass-lined channels by (1) the absence of an impermeable trickle channel, (2) gentler longitudinal slopes and wider bottom widths that encourage shallow, slow flows, (3) greater presence of hydrophytic vegetation along the channel’s bottom and lower banks, and (4) non-applicability of the 1% to 2% cross-slope criterion (See figures in Section 3.1). Another major difference is that a wetland bottom channel should be designed as a low-flow channel having a capacity to carry the 2-year flood peak, instead of the ⅓ to ½ of the 2-year peak required for low flow channels. Figure OC-5 illustrates a representative wetland bottom composite channel.
The use of an appropriate Manning’s nin the design of a composite channel is critical. In designing low-flow channels for composite channels, the engineer must account for two flow roughness conditions. To ensure vertical stability, the longitudinal slope of the channel should be first calculated and fixed assuming there is no wetland vegetation on the bottom (i.e., “new channel”). Next, in order to ensure adequate flow capacity after the low-flow channel vegetation matures and some sedimentation occurs, the channel’s bottom is widened to find the channel cross section needed to carry the design flow using roughness coefficients under the “mature channel” condition. To allow for the "mature channel" condition and potential sediment accumulation, outfalls into channels with low-flow channels shall be at least 2 feet above the low-flow channel invert. The design procedure outlined below provides the reader with the necessary steps and specific channel criteria to carry out a design of a composite channel.
3.2.2. Design Procedure
If a composite channel is to be used, the designer shall utilize the Composite Design worksheetof the RDM-Channels spreadsheet. The following steps outline the specific design procedures necessary:
- Design Discharge – Determine the 2-year peak flow rate in the wetland channel without reducing it for any upstream ponding or flood routing effects.
- Channel Geometry – Define the newly-built channel’s geometry to pass the design 2-year flow rate at ≤ 4-ft/sec with a channel depth between 2- to 4-feet. The channel cross section should be trapezoidal with side slopes of 3:1 (H/V) or flatter. Bottom width shall be ≥ 5-feet.
- Longitudinal Slope – Set the longitudinal slope using Manning’s equation and a Manning’s roughness coefficient of n=0.035, for the 2-year flow rate but no flatter than 0.0025 ft/ft. If the desired longitudinal slope cannot be satisfied with existing terrain, grade control checks or small drop structures must be incorporated to provide desired slope.
- Low-flow Channel Capacity – Calculate the mature channel capacity during a 2-year flood using a Manning’s roughness coefficient of n=0.065 and the same geometry and slope used when initially designing the channel with n=0.035.
- Full-width Channel Capacity – After the low-flow channel has been designed to pass the 2-year storm peak discharge, complete the composite channel design by providing additional channel capacity through design/analysis of channel overbank areas. The final Manning’s nfor the composite channel shall be determined using Equation OC-11. Use Table OC-7 for Manning’s n values for the middle area (low-flow), left overbank, and right overbank areas of a composite channel.
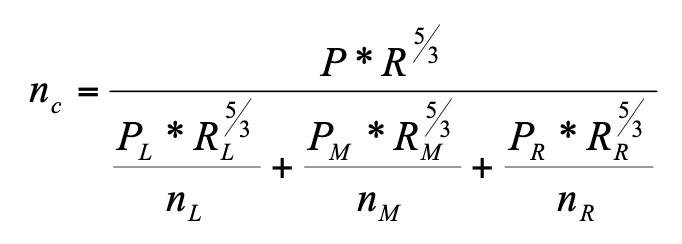 (Equation OC-11)
In which:
nC= Manning’s nfor the composite channel
nL= Manning’s nfor the left overbank (…if grass-lined see Table OC-8)
nR= Manning’s nfor the right overbank (…if grass-lined see Table OC-8)
nM= Manning’s nfor the middle area (low-flow)
when, 2-ft ≤ y0 < 5-ft,
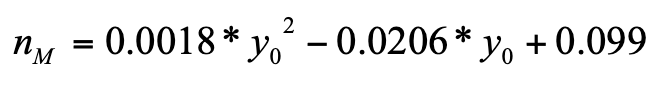 (Equation OC-11a)
or 5-ft ≤ y0 < 10-ft,
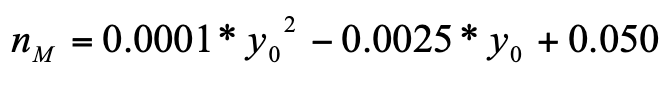 (Equation OC-11b)
where, y0 = depth of flow
PL= Wetted perimeter of the left overbank (ft)
PR= Wetted perimeter of the right overbank (ft)
PM= Wetted perimeter of the middle area (ft)
RL= Hydraulic radius of the left overbank (ft)
R= Hydraulic radius of the right overbank (ft)
RM= Hydraulic radius of the middle area (ft)
Table OC-8 – Values for Manning's n in Grass-lined Overflow Bank Areas in Composite Channel (Guo 2006)
Grass Type
Grass Length
0.1 ft
For Minor Runoff
Depth>3.0 ft
For Major Runoff
Bermuda
2-inch
0.0350
0.0300
4-inch
0.0400
0.0300
Kentucky
2-inch
0.0350
0.0300
4-inch
0.0400
0.0300
Grass (Good Stand)
12-inch
0.0700
0.0350
24-inch
0.1000
0.0350
Grass (Fair Stand)
12-inch
0.0600
0.0350
24-inch
0.0700
0.0350
- Flooding Control Design Capacity – The channel shall also provide enough capacity to contain the flow during a 100-year flood while adhering to free-board requirements for the type of channel (primary, secondary, or tertiary) for which the channel design falls under. Adjustment of the channel capacity may be done by increasing the bottom width of the channel. Minimum bottom width shall be 5-feet.
3.2.3. Water Surface Profile
Whenever a composite bottom channel is crossed by a road, railroad, or a trail requiring a culvert or a bridge, a drop structure shall be provided immediately downstream of such a crossing. This will help reduce sediment deposition in the crossing. A minimum 1-foot to 2-foot drop is required (a larger drop may be preferred in larger systems) on the downstream side of each culvert and crossing of a wetland bottom channel (see Figure OC-7).
Figure OC-7 – Composite Channel At Bridge or Culvert Crossing (UDFCD USDCM 2002)
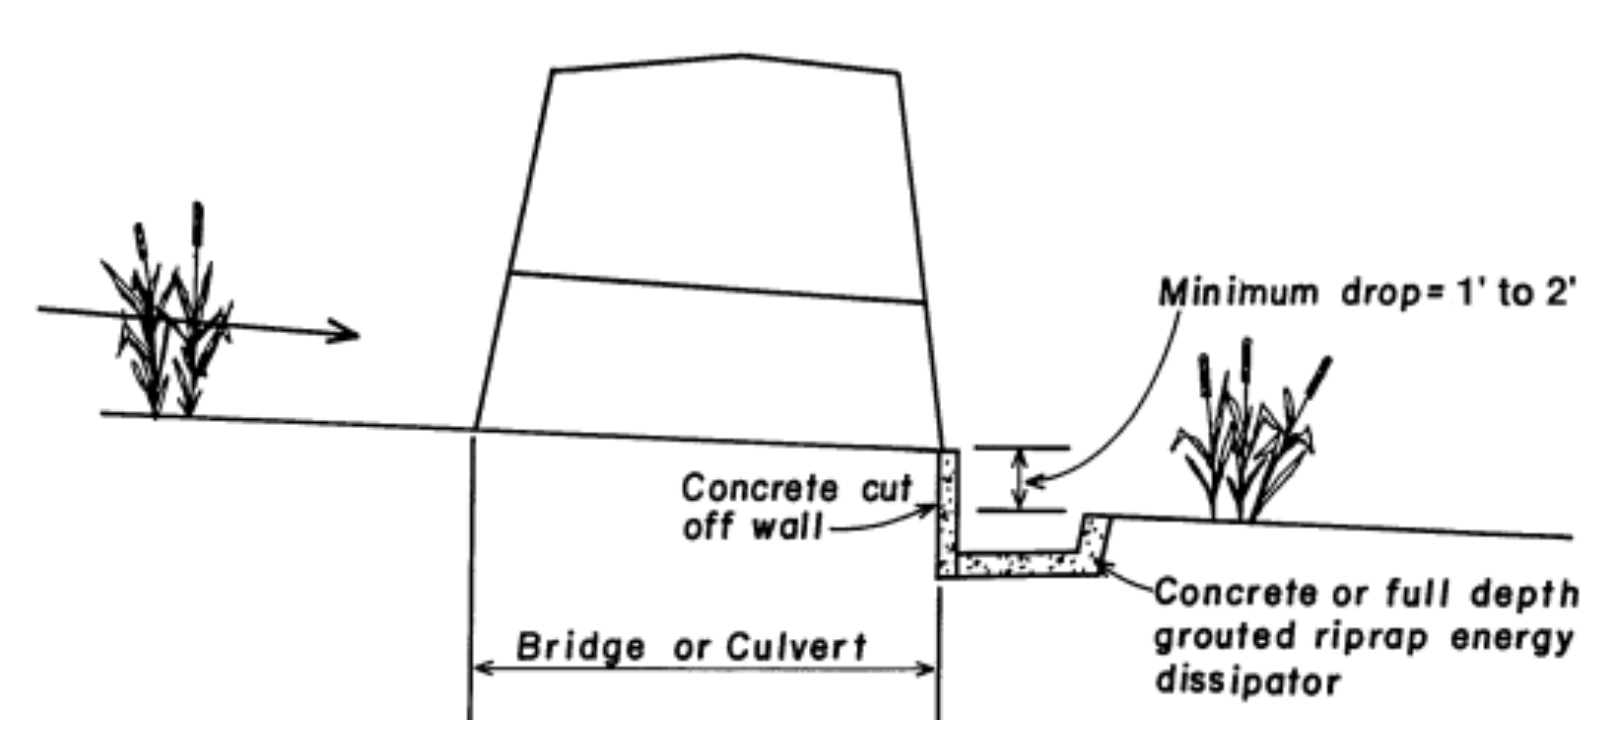
Water surface profiles must be computed, for the 10- and 100-year events. Computation of the water surface profile shall utilize standard backwater methods, taking into consideration all losses due to changes in velocity, drops, bridge openings, and other obstructions. Computations begin at a known point and extend in an upstream direction for subcritical flow. It is for this reason that the channel should be designed from a downstream direction to an upstream direction. It is necessary to show the energy gradient on all preliminary and final drawings to help prevent errors.
The designer must remember that open-channel flow in urban drainage is usually non-uniform because of bridge openings, curves, and structures. This necessitates the use of backwater computations for all final channel design work.
3.2.4. Life Expectancy and Maintenance
The low-flow channel can serve as a productive ecosystem and can also be highly effective at trapping sediment. A composite channel with a wetland bottom is expected to fill with sediment over time. Some sediment accumulation is necessary for a “wetland bottom” channel’s success to provide organic matter and nutrients for growth of biological communities. The life expectancy of such a channel will depend primarily on the land use of the tributary watershed. However, life expectancy can be dramatically reduced to as little as 2 to 5 years, if land erosion in the tributary watershed is not controlled. Therefore, land erosion control practices need to be strictly enforced during land development and other construction within the watershed, and all facilities shall be built to minimize soil erosion to maintain a reasonable economic life for the wetland bottom channel. In addition, sediment traps or forebays located at stormwater runoff points of entry can trap a significant portion of the sediment arising at the wetland channel and, if used, could decrease the frequency of major channel dredging.
3.2.5. Calculation Tool
Calculations for sizing of a composite channel using hydraulic equations from Section 2.0 and criteria from Section 3.2 can be performed using the Composite Design worksheetof the RDM-Channels spreadsheet.
3.3.1. Design Criteria
3.3.1.1. Design Velocity and Froude Number
Concrete channels can be designed to convey supercritical or subcritical flows; however, the designer must take care to prevent the possibility of unanticipated hydraulic jumps forming in the channel. For concrete channels, flows at Froude Numbers between 0.7 and 1.4 are unstable and unpredictable and shall be avoided at all flow levels in the channel. When a concrete channel is unavoidable, the maximum velocity at the peak design flow shall not exceed 18 feet per second.
To calculate velocities, the designer shall utilize Manning’s Equation (Equation OC-2) from Section 2.1.1 of this chapter with roughness values from Table OC-9. When designing a concrete-lined channel for subcritical flow, use a Manning’s n= 0.013 for capacity calculations and 0.011 to check whether the flow could go supercritical. Do not design a subcritical channel for a Froude number greater than 0.7 using the velocity and depth calculated with a Manning’s n= 0.011. Also, do not design a supercritical channel with a Froude Number less than 1.4 when checking for it using a Manning’s n= 0.013.
Table OC-9 – Manning’s n Roughness Coefficients for Concrete-Lined Channels (UDFCD USDCM 2002)
Type of Concrete Finish | Roughness Coefficient (n) | ||
|---|---|---|---|
| Minimum | Typical | Maximum | |
Concrete Trowel finish* Float finish* Finished, with gravel on bottom* Unfinished* Shotcrete, trowelled, not wavy Shotcrete, trowelled, wavy Shotcrete, unfinished On good excavated rock On irregular excavated rock | 0.011 0.013 0.015 0.014 0.016 0.018 0.020 0.017 0.022 | 0.013 0.015 0.017 0.017 0.018 0.020 0.022 0.020 0.027 | 0.015 0.016 0.020 0.020 0.023 0.025 0.027 0.023 0.030 |
* For a subcritical channel with these finishes, check the Froude number using n= 0.011
3.3.1.2. Design Depths
There are no specific limits set for depth for concrete-lined channels, except as required for low-flow channels of a composite section where the low-flow channel is concrete lined (see Section 3.1.4.).
3.3.1.3. Curvature
Curvature is not allowed for channels with supercritical flow regimes. For concrete-lined channels with subcritical flow regimes, the centerline radius of curvature shall be at least two-times (2x) the top width, and superelevation shall be evaluated for all bends using Equation OC-9 in Section 2.2.4 and included in determining freeboard.
3.3.1.4. Design Discharge Freeboard
Freeboard above the design water surface shall not be less than that determined by the following:
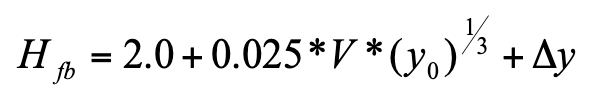 (Equation OC-12)
in which:
Hfb= Freeboard height (ft)
V= Velocity of flow (ft/sec)
yo= Depth of flow (ft)
Δy = Increase in water surface elevation due to superelevation at bends (see Equation OC-9) (no bends allowed in supercritical channels)
In addition to Hfb, add height of estimated standing roll waves and/or other water surface disturbances to calculate the total freeboard. In all cases, the freeboard shall be no less than 2 feet and the concrete lining shall be extended above the flow depth to provide the required freeboard. The Steep Channel worksheet of the RDM-Channels spreadsheet can be used to calculate standing roll wave heights.
3.3.2. Concrete Lining Specifications
3.3.2.1. Concrete Lining Section
All concrete lining shall be designed to withstand the anticipated hydrodynamic and hydrostatic forces, and the minimum thickness shall be no less than 8-inches for supercritical channels and no less than 5-inches for subcritical channels. Free draining granular bedding shall be provided under the concrete liner and shall be no less than 6-inches thick for channels with Froude number ≤ 0.7 and 9-inches thick for channels with Froude number ≥1.4. Concrete shall comply with Class M concrete according to ARDOT’s Standard Specifications for Highway Construction – Section 802 – Concrete for Structures.
3.3.2.2. Concrete Joints and Reinforcement
Concrete joints must satisfy the following criteria:
- Channels shall be constructed of continuously reinforced concrete. Channels constructed as 8-inch thick shall be reinforced with #4’s at 12-inch transverse spacing and #4’s at 18-inch longitudinal spacing. Channels constructed as 6-inch thick shall be reinforced with 6x6–8/8 welded wire mesh. All reinforcement shall be installed to where it is 2-inches from the bottom of the concrete slab.
- Expansion/contraction joints shall be installed where new concrete lining is connected to a rigid structure or to existing concrete lining which is not continuously reinforced. Expansion joints shall be constructed at a minimum distance of 50-feet between joints and in no case shall exceed 75-feet. Expansion joint fillers shall be of a non-extruding type conforming to ASTM designation D1751.
- Saw joints are to be made at 10-foot spacing maximum on all ditch sections. All saw joints shall have backer rod and caulking properly installed per manufacture’s specifications. Materials used to seal saw joints shall be on ARDOT’s Qualified Products List.
- Longitudinal joints, where required, shall be constructed on the sidewalls at least 1-foot vertically above the channel invert.
- All joints shall be designed to prevent differential movement.
- Construction joints are required for all cold joints and where the lining thickness changes. Reinforcement shall be continuous through the joint.
3.3.2.3. Concrete Finish
The surface of the concrete lining may be finished in any of the finishes listed in Table OC-9, provided an appropriate finishing technique is used.
3.3.2.4. Weep Holes
Weep holes shall be required in all impervious lined channels. Weep holes at a minimum shall be 2-inch in diameter and placed at ten-foot on center along the channel sides. Crushed rock (1/2-inch to 5/8-inch) wrapped in 6-oz non-woven filter fabric shall be placed in front of the weep holes to prevent loss of the channel subgrade. See Figure OC-8.
3.3.3. Channel Cross Section
3.3.3.1. Side Slopes
The side slopes shall be no steeper than 1.5V:1H unless designed to act as a structurally reinforced wall to withstand soil and groundwater forces. In some cases, a rectangular cross section may be required. Rectangular cross sections are acceptable, provided they are designed to withstand potential lateral loads and adhere to the safety requirements outlined in Section 3.3.4. Provide design calculations stamped by a structural engineer.
3.3.3.2. Depth
Maximum depth shall be consistent with Section 3.3.1.2. For known channel geometry and discharge, normal water depth can be calculated using Manning’s Equation (Equation OC-2) from Section 2.1.1.
3.3.3.3. Bottom Width
The bottom width shall be designed to satisfy the hydraulic capacity of the cross section recognizing the limitations on velocity, depth, and Froude number. For a given discharge, the bottom width can be calculated from depth, velocity, slope, and Froude number constraints in Section 3.3.1.1, Section 3.3.1.2, and Section 3.3.1.3 using Manning’s Equation. In no case shall the bottom of the channel be any less than 5-feet wide.
3.3.3.4. Trickle and Low-Flow Channels
For a well-designed concrete-lined channel, a trickle or low-flow channel is not necessary since the entire channel is hard-lined. However, if a small base flow is anticipated, it is a good idea to incorporate a trickle flow swale or section to reduce occurrence of bottom slime, noxious odors and mosquito breeding. The trickle flow swale shall be integral to the concrete-lined channel bottom.
3.3.3.5. Outfalls Into Channel
Outfalls into concrete-lined channels shall be at least 1 foot above the channel invert.
3.3.4. Safety Requirements
A 6-foot-high chain-link or comparable fence or handrail shall be installed to prevent access wherever the 100-year channel concrete section depth exceeds 3 feet. Appropriate numbers of gates, with top latch, shall be placed and staggered where a fence is required on both sides of the channel to permit good maintenance access.
In addition, ladder-type steps shall be installed not more than 200 feet apart on alternating sides of the channel. A bottom rung shall be placed approximately 12 inches vertically above the channel invert.
3.3.5. Calculation Tools
Calculations for sizing of a concrete-lined channel using hydraulic equations from Section 2.0 and criteria from Section 3.3 can be performed using the Basics worksheetof RDM-Channels spreadsheet.
3.3.6. Maintenance
Concrete channels require periodic maintenance including debris and sediment removal, patching, joint repair, and other such activities. Their condition should be periodically monitored, especially to assure that flows cannot infiltrate beneath the concrete lining.
Figure OC-8 – Concrete Lined Channel (Trapezoidal)
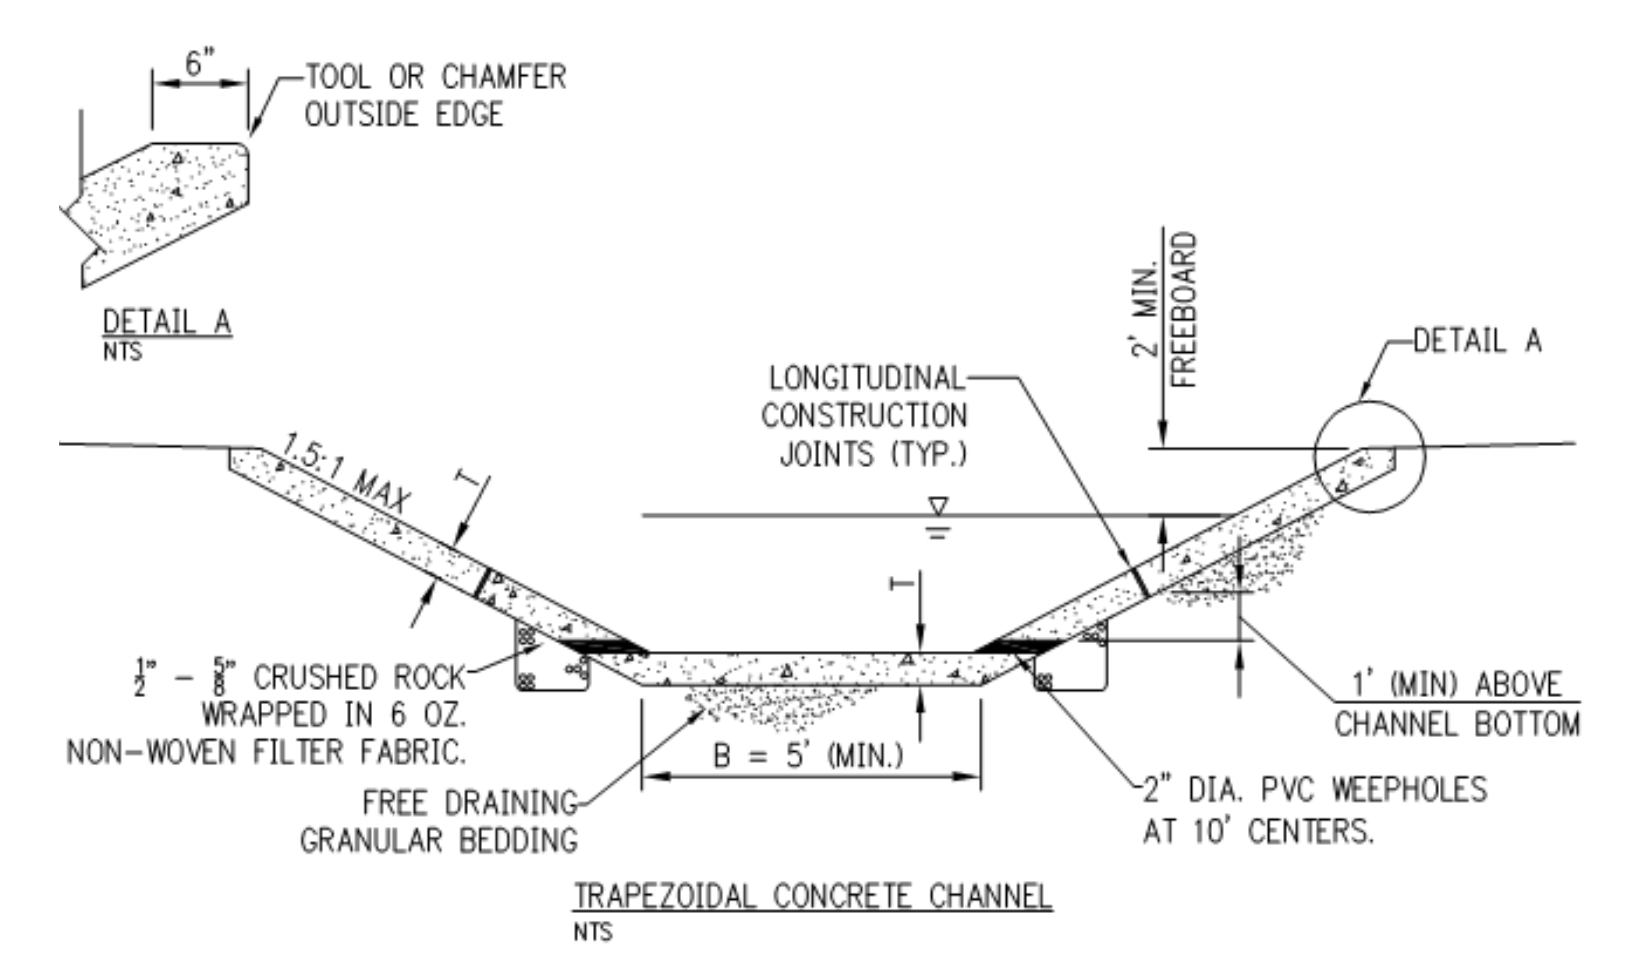
3.4.1. Types of Riprap
3.4.1.1. Riprap and Soil Riprap
Many factors govern the size of the rock necessary to resist the forces tending to move the riprap. For the riprap itself, this includes the size and weight of the individual rocks, shape of the stones, gradation of the particles, blanket thickness, type of bedding under the riprap, and slope of the riprap layer. Hydraulic factors affecting riprap include the velocity, current direction, eddy action, waves, and hydraulic uplift forces.
Experience has shown that riprap failures result from a variety of factors: undersized individual rocks in the maximum size range; improper gradation of the rock, which reduces the interlocking of individual particles; and improper bedding for the riprap, which allows leaching of channel particles through the riprap blanket.
Classification and gradation for riprap and boulders are given in Table OC-10 and Table OC-11 and are based on a minimum specific gravity of 2.50 for the rock. Because of its relatively small size and weight, riprap Types 1 and 2 must be used in soil riprap applications only. Type 3 riprap shall be used for all other riprap lining needs. This practice also protects the rock from vandalism.
Soil Riprap consists of 35% by volume of native soil, taken from the banks of the channel, that is mixed in with 65% by volume of riprap on-site, before placement as channel liner. A typical section for soil riprap installation is illustrated in Figure OC-10.
Table OC-10 – Classification and Gradation of Riprap
Riprap Designation | d50 (inches)* | Maximum Rock Size (inches) | …a gradation such that no more than 15% will be less than ___ (inches) |
|---|---|---|---|
Type 1 | 6** | 10 | 3 |
Type 2 | 12** | 20 | 4 |
Type 3 | 18 | 28 | 6 |
* d50 = mean particle size (intermediate dimension) by weight. ** Mix Type 1 and Type 2 riprap with 35% topsoil (by volume) and bury it with 4 inches of topsoil, all vibration compacted, and revegetate. Note: Bedding material must be used under riprap. Bedding material shall consist of granular bedding as shown in Table OC-14. | |||
Basic requirements for riprap stone are as follows:
- Rock shall be hard, durable, angular in shape, and free from cracks, overburden, shale, and organic matter.
- Neither breadth nor thickness of a single stone shall be less than one-third its length, and rounded stone shall not be used.
- The rock shall be from a source with a percent of wear not greater than 45% calculated by the Los Angeles Abrasion Test (AASHTO T 96) and shall sustain a loss of not more than 10% after 12 cycles of freezing and thawing (AASHTO test 103 for ledge rock procedure A).
- Rock having a minimum specific gravity of 2.65 is preferred; however, in no case shall rock have a specific gravity less than 2.50.
3.4.1.2. Grouted Boulders
Table OC-11 provides the classification and size requirements for boulders. When grouted boulders are used, they provide a relatively impervious channel lining which is less subject to vandalism than riprap. Grouted boulders require less routine maintenance by reducing silt and trash accumulation and are particularly useful for lining low-flow channels and steep banks. The appearance of grouted boulders is enhanced by exposing the tops of individual stones and by cleaning the projecting rocks with a wet broom right after the grouting operation. In addition, it is required that grouted boulders on channel banks and outside of frequent flow areas be buried with topsoil and revegetated with native grasses, with or without shrubs depending on the local setting. Boulders used for grouting shall meet all the properties of rock for riprap, and rock of uniform size shall be used. The boulder sizes are categorized in Table OC-8.
Table OC-11 – Classification of Boulders (UDFCD USDCM 2002)
Boulder Classification | Nominal Size and [Range in Smallest Dimension of Individual Rock Boulders] (inches) | Maximum Ratio of Largest to Smallest Rock Dimension of Individual Boulders |
|---|---|---|
Type B18 | 18 [17 – 20] | 2.5 |
Type B24 | 24 [22 – 26] | 2.0 |
Type B30 | 30 [28 – 32] | 2.0 |
Type B36 | 36 [34 – 38] | 1.75 |
Type B42 | 42 [40 – 44] | 1.65 |
Type B48 | 48 [45 – 51] | 1.50 |
Grouted boulders shall be placed directly on subbase without granular bedding. The top one-half of the boulders shall be left ungrouted and exposed. Weep holes shall be provided at the toe of channel slopes and channel drops to reduce uplift forces on the grouted channel lining. Underdrains shall be provided if water is expected to be present beneath the liner. Grouted boulders on the banks shall be buried and vegetated with dry-land grasses and shrubs. Cover grouted boulders with slightly compacted topsoil, filling depressions and covering the top of the tallest rocks to a height of no less than 6-inches to establish dry-land vegetation. Staked sod shall be placed to the 100-year storm depth. Shrubs also may be planted, but will not grow well over grouted boulders unless irrigated.
Two types of grout, Type A and Type B, are to be selected from for filling the voids for the grouted boulders. The technical specifications for two types of structural grout mix are given in Table OC-12. Type A can be injected using a low-pressure grout pump and can be used for the majority of applications. Type B has been designed for use in streams and rivers with significant perennial flows where scouring of Type A grout is a concern. It requires a concrete pump for injection.
Full penetration of grout around the lower one-half of the rock is essential for successful grouted boulder performance. Inject grout in a manner that ensures that no air voids between the grout, subbase, and boulders will exist. To accomplish this, inject the grout by lowering the grouting nozzle to the bottom of the boulder layer and build up the grout from the bottom up, while using a vibrator or aggressive manual rodding. Inject the grout to a depth equal to one-half of the boulders being used and keep the upper one-half ungrouted and clean. Remove all grout splatters off the exposed boulder portion immediately after grout injection using wet brooms and brushes.
Table OC-12 – Specifications and Placement Instructions for Grout in Grouted Riprap and Grouted Boulders (UDFCD USDCM 2002)
Material Specifications | Placement Specifications |
|---|---|
|
|
3.4.1.3. Wire-Enclosed Rock (Gabions)
Wire-enclosed rock, or gabions, refers to rocks that are bound together in a wire basket so that they act as a single unit. The durability of wire-enclosed rock is generally limited by the life of the galvanized binding wire that has been found to vary considerably under conditions along waterways. Water carrying sand or gravel will reduce the service life of the wire dramatically. Water that rolls or otherwise moves cobbles and large stones breaks the wire with a hammer-and-anvil action, considerably shortening the life of the wire. The wire has been found to be susceptible to corrosion by various chemical agents and is particularly affected by high-sulfate soils. If the designer chooses to utilize gabions, they shall be placed above the low-flow channel or 5-year water surface elevation. All flat mattresses must be filled with topsoil and then covered with a 6-inch layer of topsoil and sodded/seeded. All material and construction requirements of gabions shall follow ARDOT Standard Specifications for Highway Construction – Section 629 – Gabions, except for as amended in this Manual.
3.4.1.4. Alternatives to Riprap Lining/Structures
As discussed above, riprap lined channels are discouraged by the City and approval will be at their discretion. As such, the City is open to alternative types of channel reinforcement to prevent scour and protect the channel bank and its invert. It is the responsibility of the design engineer to show their proposed method for preventing scour is as good if not superior to riprap. Any proposed alternative needs to show this by outlining its cost effectiveness, maintenance characteristics, engineering capabilities and applications, and long term potential. Such alternatives to riprap the City finds sound are turf reinforcement mats (TRMs, such as ScourStop and ShoreMax), erosion control blankets (ECBs), hard-flexible armoring systems/units (ie. CONTECH Hard Armor – Armortec, etc.), gabions (as mentioned in Section 3.4.1.3), among many other systems and devices.
3.4.2. Design Criteria
The following sections present design criteria for riprap-lined channels. Additional information on riprap at storm sewer pipe outlets can be found in Chapter 5 – Storm Sewer System Design.
3.4.2.1. Design Velocity
Riprap-lined channels shall only be used for subcritical flow conditions where the Froude number is 0.8 or less.
3.4.2.2. Design Depths
There is no maximum depth criterion for riprap-lined channels. Wire-enclosed rock sections shall be used on banks only above the low-flow channel or 5-year flood water surface, placed on a stable foundation.
3.4.2.3. Riprap Sizing
The stone sizing for riprap can be related to the channel’s longitudinal slope, flow velocity, and the specific gravity of the stone using the relationship:
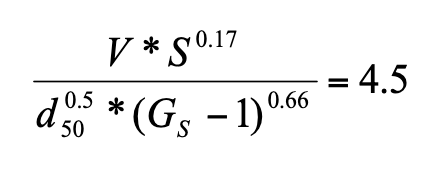 (Equation OC-13)
in which:
V= Mean channel velocity (ft/sec)
S= Longitudinal channel slope (ft/ft)
d50= Mean rock size (ft)
Gs= Specific gravity of stone (minimum = 2.50, Preferred = 2.65)
Note that Equation OC-13 is applicable for sizing riprap for channel lining. This equation is not intended for use in sizing riprap for rundowns or culvert outlet protection. Information on protection downstream of culverts is discussed in Chapter 5 – Storm Sewer System Design.
Table OC-13 shall be used to determine the minimum size of rock type required. Note that rock types for riprap, including gradation, are presented in Table OC-10 .
Table OC-13 – Riprap Requirements for Channel Linings * (UDFCD USDCM 2002 [modified for City of Rogers])
| Rock Type |
|---|---|
< 3.3 | Type 1** (d50 = ½ foot) |
≥ 3.3 to < 4.6 | Type 2 (d50 = 1 foot) |
≥ 4.6 to 5.6 | Type 3 (d50 = 1½ foot) |
* Applicable only for a Froude number of < 0.8 and side slopes no steeper than 2.5H:1V. ** Use Gs= 2.5 unless the source of rock and its density are known at time of design. | |
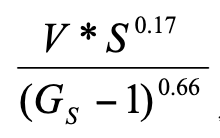 **
**Table OC-13 provides riprap requirements for all channel side slopes up to and including 2.5H:1V. Rock-lined side slopes steeper than 2.5H:1V are unacceptable under any circumstances because of stability, safety, and maintenance considerations. Proper bedding is required both along the side slopes and the channel bottom for a stable lining. The riprap blanket thickness shall be at a minimum two-times (2x) d50 and shall extend up the side slopes at least 1-foot above the design water surface. At the upstream and downstream termination of a riprap lining, the thickness shall be increased 50% for at least 3-feet to prevent undercutting.
Where the required riprap size from Equation OC-13 exceeds those as defined in Table OC-10 the design engineer shall look at adjusting the channels geometry and/or slope in order to satisfy the requirements of Equation OC-13, review alternate channel linings, etc.
3.4.2.4. Riprap Toes
Where only the channel sides are to be lined and the channel bottom remains unlined, additional riprap extending below the channel bottom is needed to protect undermining the channel side lining. In this case, the riprap blanket shall extend at least 5-feet below the channel thalweg (invert/flowline), and the thickness of the side slope blanket below the existing channel bed shall be increased to at a minimum three-times (3x) d50 to accommodate possible channel scour during higher flows. The designer shall compute the scour depth for the 100-year flow and, if this scour depth exceeds 5-feet, the depth of the riprap blanket shall be increased accordingly.
3.4.2.5. Curves and Bends
The potential for erosion increases along the outside bank of a channel bend due to acceleration of flow velocities on the outside part of the bend. Thus, it is often necessary to provide erosion protection in channels that otherwise would not need protection. TRMs, riprap, among other structural controls provide the needed protection in these areas. The need for protection of the bank on the outside of the bend has been discussed in Section 3.1.5 for channel bends that have a radius less than eight-times (8x) the top width of the channel cross section.
The minimum allowable radius for a riprap-lined bend is two-times (2x) the top width of the design flow water surface. The riprap protection shall be placed along the outside of the bank and shall be extended upstream and downstream from the bend a distance of not less than one-times (1x) and two-times (2x) the top width of the channel, respectively. Whenever an outside bend in a grass-lined channel needs protection, soil riprap, TRMs (e.g. ScourStop, ShoreMax, etc.), or other alternative shall be used, then covered with native topsoil and revegetated to provide a grassed-line channel appearance.
Where the mean channel velocity exceeds the allowable non-eroding velocity so that riprap protection is required for straight channel sections, increase the rock size using the adjusted flow velocity found using Equation OC-10. Use the adjusted velocity in Table OC-13 to select appropriate riprap size.
3.4.2.6. Transitions
Scour potential is amplified by turbulent eddies near rapid changes in channel geometry such as transitions and at structures (culverts, bridges, etc.). Table OC-13 may be used for selecting riprap protection for subcritical transitions (Froude numbers 0.8 or less) by using the maximum velocity in the transition and then increasing the velocity by 25%.
Protection must extend upstream from the transition entrance at least 5 feet and downstream from the transition exit for a distance equal to at least five-times (5x) the design flow depth. This is not intended as culvert outlet protection, refer to Chapter 5 – Storm Sewer System Design.
3.4.2.7. Design Discharge Freeboard
Freeboard above the design water surface shall not be less than that determined by Equation OC-12 in Section 3.3.1.4.
In addition to the freeboard height calculated using Equation OC-12, add the height of estimated standing waves and/or other water surface disturbances and calculate total freeboard. In all cases, the riprap lining shall be extended above the flow depth to provide freeboard.
3.4.3. Roughness Coefficient
The Manning's roughness coefficient, n, for a riprap-lined channel may be estimated for riprap using:
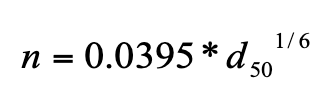 (Equation OC-14)
In which, d50 = the mean stone size (ft)
This equation does not apply to grouted boulders or to very shallow flow (where hydraulic radius is less than, or equal to two-times (2x) the maximum rock size). In those cases the roughness coefficient will be greater than indicated by Equation OC-14 and shall be adjusted accordingly.
3.4.4. Bedding Requirements
The long-term stability of riprap erosion protection is strongly influenced by proper bedding conditions. A large percentage of all riprap failures is directly attributable to bedding failures.
Properly designed bedding provides a buffer of intermediate-sized material between the channel bed and the riprap to prevent channel particles from leaching through the voids in the riprap. Two types of bedding are commonly used: (1) a granular bedding filter and (2) filter fabric.
3.4.4.1. Granular Bedding
The acceptable method for establishing gradation requirements for granular bedding for riprap consists of a single- or two-layer bedding that uses what are defined as Type I and Type II gradations. These gradations are shown in Table OC-14.
Table OC-14 – Gradation for Granular Bedding
U.S. Standard Sieve Size | Percent Weight by Passing Square-Mesh Sieves | |
|---|---|---|
Type I ARDOT Sect. 501.02 Materials (b) Fine Aggregate | Type II ARDOT Sect. 303 Aggregate Base Course, Class 3 | |
3 inches | ----- | 90-100 |
1½ inches | ----- | ----- |
¾ inches | ----- | 60-90 |
3/8 inches | 100 | 40-80 |
#4 | 95-100 | 30-60 |
#8 | 70-95 | ----- |
#10 | ----- | 20-45 |
#16 | 45-85 | ----- |
#30 | 20-65 | ----- |
#40 | ----- | 10-35 |
#50 | 5-30 | ----- |
#100 | 0-5 | ----- |
#200 | ----- | 3-12 |
The Type I bedding in Table OC-14 is designed to be the lower layer in a two-layer filter for protecting fine-grained soils and has a gradation identical to ARDOT concrete fine aggregate specification AASHTO T 27 (ARDOT Section 501.02 (b)). Type II bedding, the upper layer in the two-layer filter, is equivalent to ARDOT’s Class 3 aggregate base course specification AASHTO T 11 and T 27 (ARDOT Section 303). When the channel is excavated in coarse sand and gravel (50% or more of coarse sand and gravel retained on the #40 sieve by weight), only the Type II filter is required. Otherwise, a two-layer bedding (Type I topped by Type II) is required. Alternatively, a single 12-inch layer of Type II bedding can be used, except at drop structures. For required bedding thickness, see Table OC-15.
Table OC-15 – Granular Bedding Thickness Requirements (UDFCD USDCM 2002)
Riprap Designation | Minimum Bedding Thickness (inches) | ||
|---|---|---|---|
| Fine-Grained Soils* | Coarse-Grained Soils** | ||
| Type I | Type II | Type II | |
Type 1 (d50 = 6 in) | 4 | 4 | 6 |
Type 2 (d50 = 12 in) | 4 | 4 | 6 |
Type 3 (d50 = 18 in) | 4 | 6 | 8 |
* May substitute one 12-inch layer of Type II bedding. The substitution of one layer of Type II bedding shall not be permitted at drop structures. The use of a combination of filter fabric and Type II bedding at drop structures is acceptable. ** Fifty percent or more by weight retained on the # 40 sieve. | |||
3.4.4.2. Filter Fabric
Filter fabric is not a substitute for granular bedding. Filter fabric provides filtering action only perpendicular to the fabric and has only a single equivalent pore opening between the channel bed and the riprap. Filter fabric has a relatively smooth surface, which provides less resistance to stone movement. As a result, it is recommended that the use of filter fabric be restricted to slopes no steeper than 3H:1V. Tears in the fabric greatly reduce its effectiveness; therefore, direct dumping of riprap on the filter fabric is not allowed, and due care must be exercised during construction. Nonetheless, filter fabric has proven to be a workable supplement to granular bedding in many instances, provided it is properly selected, installed and not damaged during installation.
At drop structures and sloped channel drops, where seepage forces may run parallel to the fabric and cause piping along the bottom surface of the fabric, special care is required in the use of filter fabric. Seepage parallel with the fabric must be reduced by folding the edge of the fabric vertically downward about 2 feet (similar to a cutoff wall) at 12-foot intervals along the installation, particularly at the entrance and exit of the channel reach. Filter fabric has to be lapped a minimum of 12 inches at roll edges, with upstream fabric being placed on top of downstream fabric at the lap.
Fine silt and clay has been found to clog the openings in filter fabric. This prevents free drainage, increasing failure potential due to uplift. For this reason, a double granular filter is often more appropriate bedding for fine silt and clay channel beds. See Figure OC-11 for details on acceptable use of filter fabric as bedding.
3.4.5. Channel Cross Section
3.4.5.1. Side Slopes
For long-term maintenance needs, it is required that riprap channel linings be used only as toe protection in natural channel and in low-flow channel portion of an engineered channel, but not on the banks above the low-flow channel section. For this reason whenever soil-riprap linings are used above the low-flow section or above what is needed for toe protection, a slope typically used for grass-lined channels is required (i.e., 3H:1V).
Riprap-lined and soil riprap-lined side slopes when used as described above that are steeper than 2.5H:1V are considered unacceptable because of stability, safety, and maintenance considerations. In some cases, such as under bridges and in retrofit situations where right-of-way is very limited, use of slopes up to 2H:1V may be allowed subject to City approval.
3.4.5.2. Depth
The maximum depth shall be consistent with the guidelines in Section 3.4.2.2 of this chapter. For known channel geometry and discharge, normal water depth can be calculated using Manning’s Equation from Section 2.1.1 of this chapter.
3.4.5.3. Bottom Width
The bottom width must be designed to satisfy the hydraulic capacity of the cross section, recognizing the limitations on velocity, depth, and Froude number. For a given discharge, the bottom width can be calculated from depth, velocity, slope, and Froude number constraints in Section 3.4.2.1, Section 3.4.2.2, and Section 3.4.2.3 using Manning’s Equation from Section 2.1.1 of this chapter.
3.4.5.4. Outfalls Into Channel
Outfalls into riprap-lined channels shall be at least 1 foot (preferably 2 feet) above the channel invert.
3.4.6. Erosion Control
For a properly bedded and lined riprap channel section, in-channel erosion should not generally be a problem. As with concrete channels, the primary concern with erosion is control of erosion in the watershed tributary leading up to the channel. Good erosion control practices in the watershed will reduce channel maintenance. In addition, accumulation of debris in the channel, especially after a large event, may be of concern due to the potential for movement of riprap and damming.
3.4.7. Maintenance
The greatest maintenance concern is the long-term loss of riprap. Also, grout used in grouting riprap can deteriorate with time, and this should be monitored, as well. Improper grout installation creates long-term maintenance problems.
Figure OC-9 – Riprap Channel Bank Lining, Including Toe Protection (UDFCD USDCM 2002)
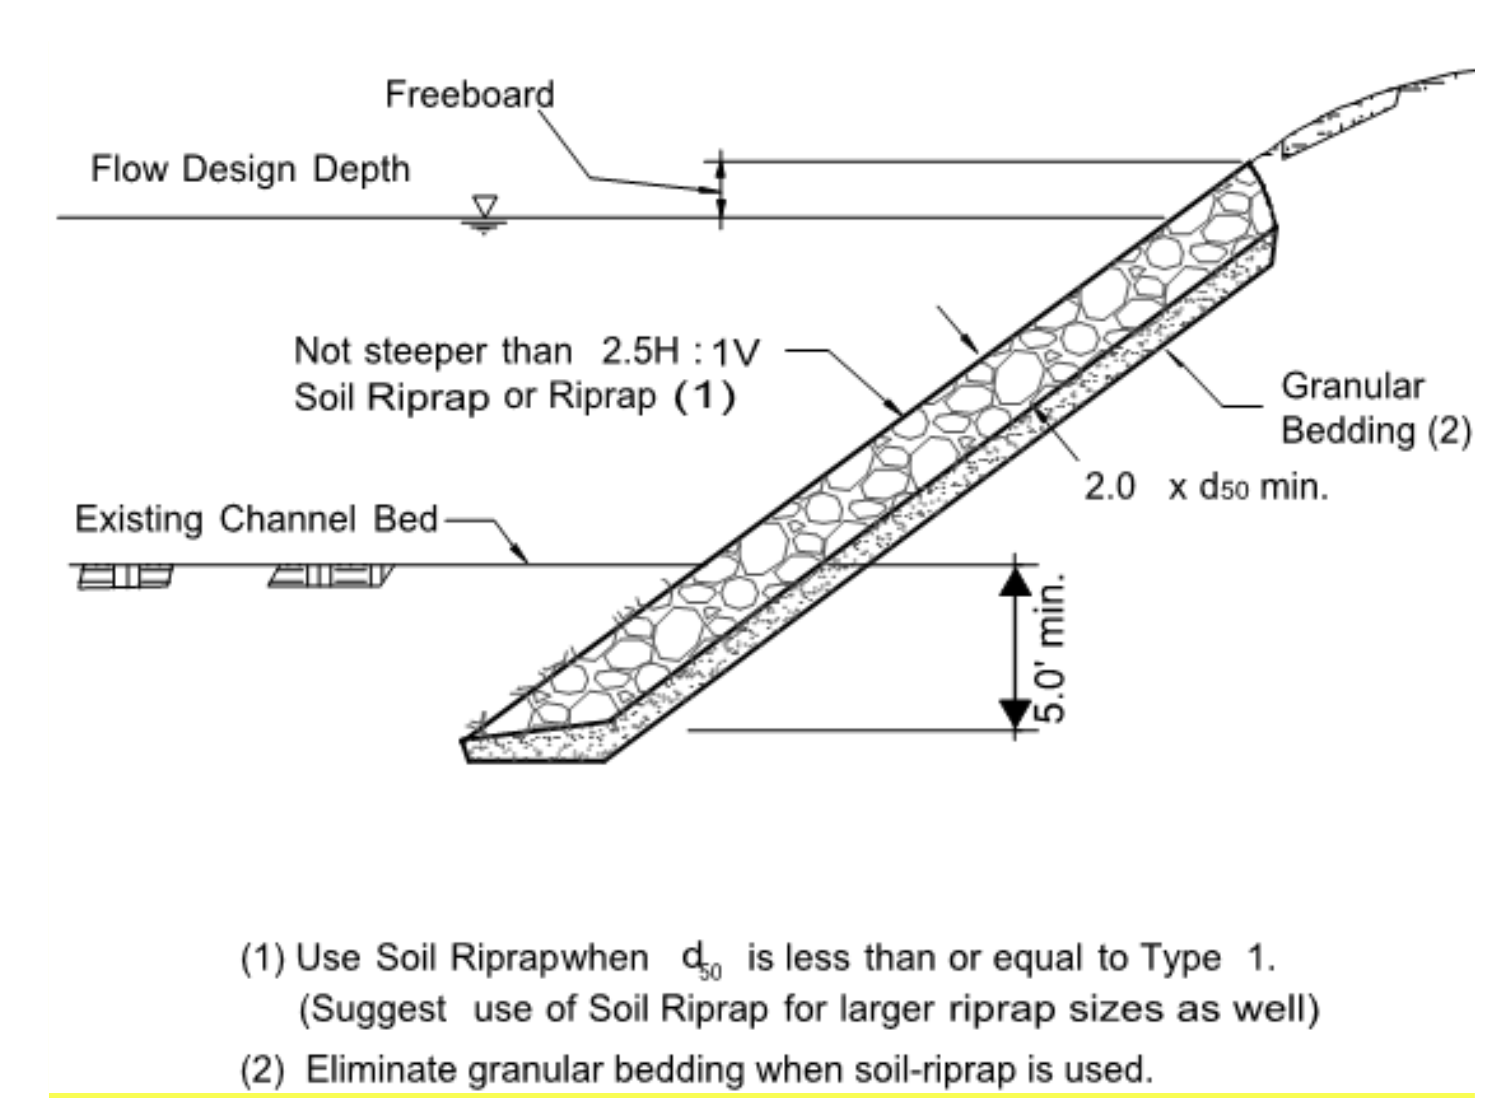
Figure OC-10 – Filter Fabric Details (UDFCD USDCM 2002)
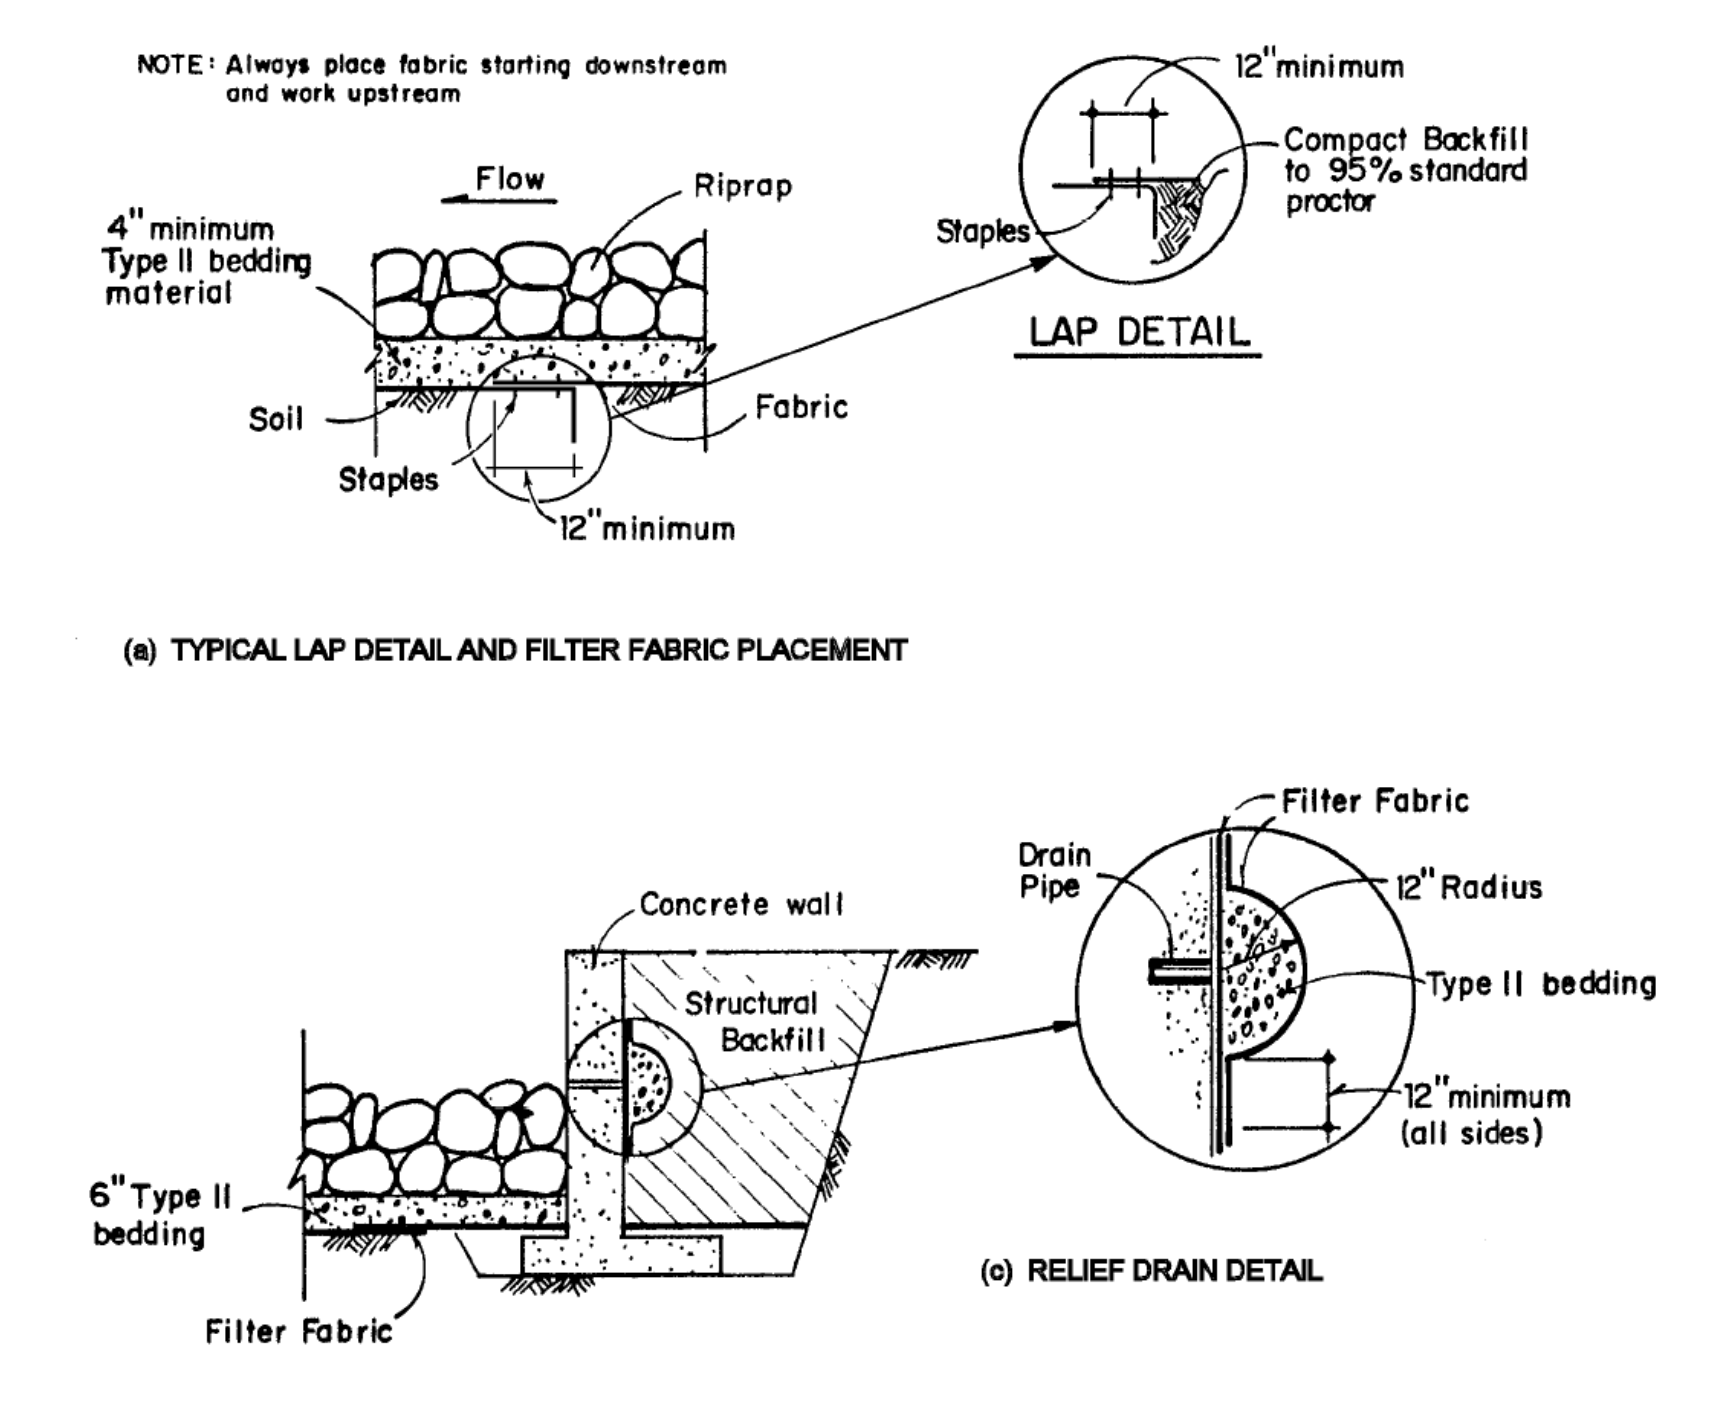
Figure OC-11 – Detail – Boulder Edged Low-Flow Channel (UDFCD USDCM 2002)
3.5.1. Components
Vegetation is the basic component of what is known as “bioengineering” (Schiechtl 1980). Schiechtl (1980) states that, “bioengineering requires the skills of the engineer, the learning of the biologist and the artistry of the landscape architect.”
It has been hypothesized that vegetation can function as either armor or indirect protection, and, in some applications, can function as both simultaneously (Biedenharn, Elliot, and Watson 1997 and Watson, Biedenharn, and Scott 1999). Grassy vegetation and the roots of woody vegetation may function as armor, while brushy and woody vegetation may function as indirect protection; the roots of the vegetation may also add a degree of geotechnical stability to a bank slope through reinforcing the soil (Biedenharn, Elliot, and Watson 1997 and Watson, Biedenharn, and Scott 1999), but these premises have not yet been technically substantiated through long-term field experience in urban settings. Each species of grass or shrub has differing ecological requirements for growth and differing characteristics such as root strength and density. Species shall be selected based on each site’s individual characteristics. Bioengineered channels must be designed with care and in full recognition of the physics and geomorphic processes at work in urban waterways and changing watersheds. Representative components of bioengineered channels include:
- Planted riprap
- Planted, grouted boulders
- Turf reinforcement mats
- Brush layering
- Fiber rolls
- Fascines
- Live willow stakes (with and without joint plantings in soil filled rock)
- Live plantings in conjunction with geotextile mats
- Wide ranges of planting of wetland and upland vegetation
- Wrapped soil lifts for slope stability
See Figure OC-11 through Figure OC-14 for more guidance.
3.5.2. Applications
Bioengineered channels are applicable when channel designs are firmly grounded in engineering principles and the following conditions are met:
- Hydrologic conditions are favorable for establishment and successful growth of vegetation.
- Designs are conservative in nature, and bioengineered features are used to provide redundancy.
- Maintenance responsibilities are clearly defined.
- Adequate structural elements are provided for stable conveyance of the major runoff flow.
- Species are selected based on individual site characteristics.
3.5.3. Bioengineering Resources
The purpose of this section is to provide the designer with an overview of bioengineering and basic guidelines for the use of bioengineered channels on major drainage projects within the City. There are many sources of information on bioengineering that the designer should consult for additional information when planning and designing a bioengineered channel. Some such resources are: Watson, Biedenharn, and Scott 1999; USFISRWG 1998; Riley 1998; and Biedenharn, Elliot, and Watson 1997. An expert in the design and layout of bioengineering channels shall be consulted when attempting such channel design work within the City.
3.5.4. Characteristics of Bioengineered Channels
The following characteristics are generally associated with bioengineered channels:
- Their design must address the hydrologic changes associated with urbanization (increased peak discharges, increased runoff volume, increased base flow, and increased bank-full frequency). These changes typically necessitate the use of grade control structures. In the absence of grade control structures purely bioengineered channels will normally be subject to bed and bank erosion, channel instability, and degradation.
- In addition to grade controls, most bioengineered channels require some structural methods to assist the vegetation with maintaining channel stability. Examples include buried riprap at channel toes and at outer channel banks (see Figure OC-12, Figure OC-13 and Figure OC-14).
- The designer must ensure that there will be sufficient flow in the channel (or from other sources, such as locally high groundwater) to support the vegetation. A complicating factor is that, in newly developing areas, base flows will not be present; whereas, if the tributary drainage area is large enough, base flows will often materialize after substantial urbanization has occurred. Therefore, it is important to match the channel stabilization technique to the water available at the time of construction, whether naturally or from supplemental water sources.
- The extent to which vegetative techniques for channel stabilization will need to be supplemented with structural measures is a function of several factors:
- Slope
- Maximum velocity during 5-year event
- Maximum velocity during 100-year event
- Froude number during 5-year event
- Froude number during 100-year event
- Tractive force
- Sinuosity
- Timing of period of construction relative to the growing season
- Other site-specific factors
In general, slight channel slopes, lower velocities, lower Froude numbers, lower tractive force values, and higher sinuosity are conducive to channel stabilization approaches that emphasize bioengineering. These factors indicate that park-like settings (areas of open space, parks, office parks, etc.) are often conducive to bioengineered projects because they provide space for the channel to have a meandering pattern that increases flow length and decreases channel slope, velocities, and tractive forces.
A technique that can be utilized is stabilization of the outer banks of a defined low-flow channel to withstand the major storm. Within the defined low-flow channel, base flows and small storm flows can then assume their own flow path (meandering pattern). This pattern can either be pre-established (with a “pilot” channel) or the flows can move freely from one side of the hardened low-flow channel to the other, thereby establishing their own pattern.
Figure OC-11 shows examples of details for boulder toe protection (grouted and ungrouted, for one- and two-boulder high toe walls) that can be used to define a hardened, low-flow channel within which base flows and small storm flows can freely meander. Boulders shall be placed on a Type 1 riprap foundation, and boulders shall be aligned so that they are wider than they are tall. Boulders shall be placed so that the top of the toe protection wall is flat. If stacking is stable, grouting may not be necessary. In areas where the channel is easily accessible to the public, the top row of boulders may be grouted in place so that vandals cannot remove them.
3.5.5. Advantages of Bioengineered Channels
Public reaction to bioengineered channels is generally favorable. In contrast to major drainageway stabilization projects that focus on structural measures, such as concrete-lined or riprap-lined channels, bioengineered channels:
- Appear more natural in character and, often, more like a channel prior to urbanization. When post-urbanization hydrology permits, riparian areas may be created where there previously was little vegetation. Also, wetlands can often be created in conjunction with bioengineered channels.
- Have a “softer” appearance and are generally judged by most to be more aesthetic.
- Are often found where space is not a limitation, such as in public parks and open space areas.
- Generally, provide wildlife habitat.
- Provide other benefits such as passive recreational opportunities for the public (like bird watching), open space creation/preservation, potentially water temperature moderation, and/or water quality enhancement.
- Create a living system that may strengthen over time.
- Can facilitate obtaining 404 permits.
3.5.6. Technical Constraints
The following constraints are associated with bioengineered channels:
- There is only limited experience to rely on for successful design of urban channels. The majority of the experience with bioengineering techniques relates to channels in nonurban settings.
- Careful species selection that reflects the site’s soils and water availability characteristics is essential to ensure survivability of the vegetation chosen for the channel.
- A basic design criterion within the City is to demonstrate channel stability during the major (100-year) storm to ensure public safety and property protection within urban areas. There is little evidence (locally, regionally, or nationally) as to whether purely bioengineered channels can withstand 100-year (or lesser) flood forces.
- Significant space can be required for bioengineered channels, yet space is often at a premium in urban areas.
- Bioengineered facilities can be more expensive than their traditional counterparts.
- Bioengineered channels can be maintenance intensive, particularly in their early years.
- During the early years while the vegetation is becoming established, if a significant storm occurs, the probability of significant damage to the facility and adjacent infrastructure and properties (i.e., economic loss) is high.
Additional potential constraints of vegetative stabilization methods are summarized by Biedenharn, Elliot, and Watson (1997), as follows:
- Even well executed vegetative protection cannot be planned and installed with the same degree of confidence, or with as high a safety factor, as structural protection. Vegetation is especially vulnerable to extremes of weather, disease, insects, and inundation before it becomes well established.
- Most vegetation has constraints on the season of the year that planting can be performed.
- Growth of vegetation can cause a reduction in flood conveyance or erosive increases in velocity in adjacent un-vegetated areas.
- Vegetation can deteriorate due to mismanagement by adjacent landowners or natural causes.
- Trunks of woody vegetation or clumps of brushy vegetation on armor revetments can cause local flow anomalies, which may damage the armor.
- Large trees can threaten the integrity of structural protection by root invasion, by toppling and damaging the protection works, by toppling and directing flow into an adjacent unprotected bank, or by leaving voids in embankments due to decomposition.
- Roots can infiltrate and interfere with internal bank drainage systems or cause excess infiltration of water into the bank.
Many of these problems may be avoided through selection of the appropriate type and species of vegetation. Such selections and expert advice must be obtained from qualified individuals in revegetation and bioengineering. Invasion by other species is quite likely over the years the bioengineered channel is in operation.
3.5.7. Design Guidelines
To provide the designer with guidelines for the applicability of bioengineered channels, a comparison of hydraulic characteristics is provided in Table OC-16 for four types of channels, ranging from a fully bioengineered channel to a structural channel. To allow for growth of vegetation and accumulation of sediment, outfalls into bioengineered channels shall be 2 feet above the channel invert.
Table OC-16 – Guidelines for Use of Various Types of Channels (UDFCD USDCM 2002)
(Note: All channel types typically require grade control structures.)
Design Parameter | Fully Bioengineered Channel | Bioengineered Channel Including Structural Elements | Structural Channel With Bioengineered Elements | Structural Channel |
|---|---|---|---|---|
Maximum Slope | 0.2% | 0.5% | 0.6% | 1.0% |
Is base flow necessary? | Yes | Yes | Yes | No |
Vmaxfor Q5-year* | 3.5 ft/sec (2.5) | 4.0 ft/sec (3.0) | 5.0 ft/sec (3.5) | ** |
Vmaxfor Q100-year* | 5.0 ft/sec (3.5) | 6.0 ft/sec (4.5) | 7.0 ft/sec (5.0) | ** |
Fr5-year | 0.4 (0.3) | 0.6 (0.4) | 0.7 (0.5) | ** |
Fr100-year | 0.4 (0.3) | 0.8 (0.5) | 0.8 (0.5) | ** |
Maximum tractive force (100-year event) | 0.30 lb/ft2 | 0.60 lb/ft2 | 1.00 lb/ft2 | 1.30 lb/ft2 |
Maximum sinuosity | 1.6 | 1.2 | 1.2 | 1.0 |
* Values presented for both non-erosive and erosive soils. Erosive soil values are in parenthesis ( ). ** With a purely structural channel, such as a reinforced concrete channel, allowable velocities and allowable Froude numbers, Fr, are based on site-specific design calculations. | ||||
Figure OC-12 – Live Willow Staking for Bare Ground and Joint Installation (UDFCD USDCM 2002)
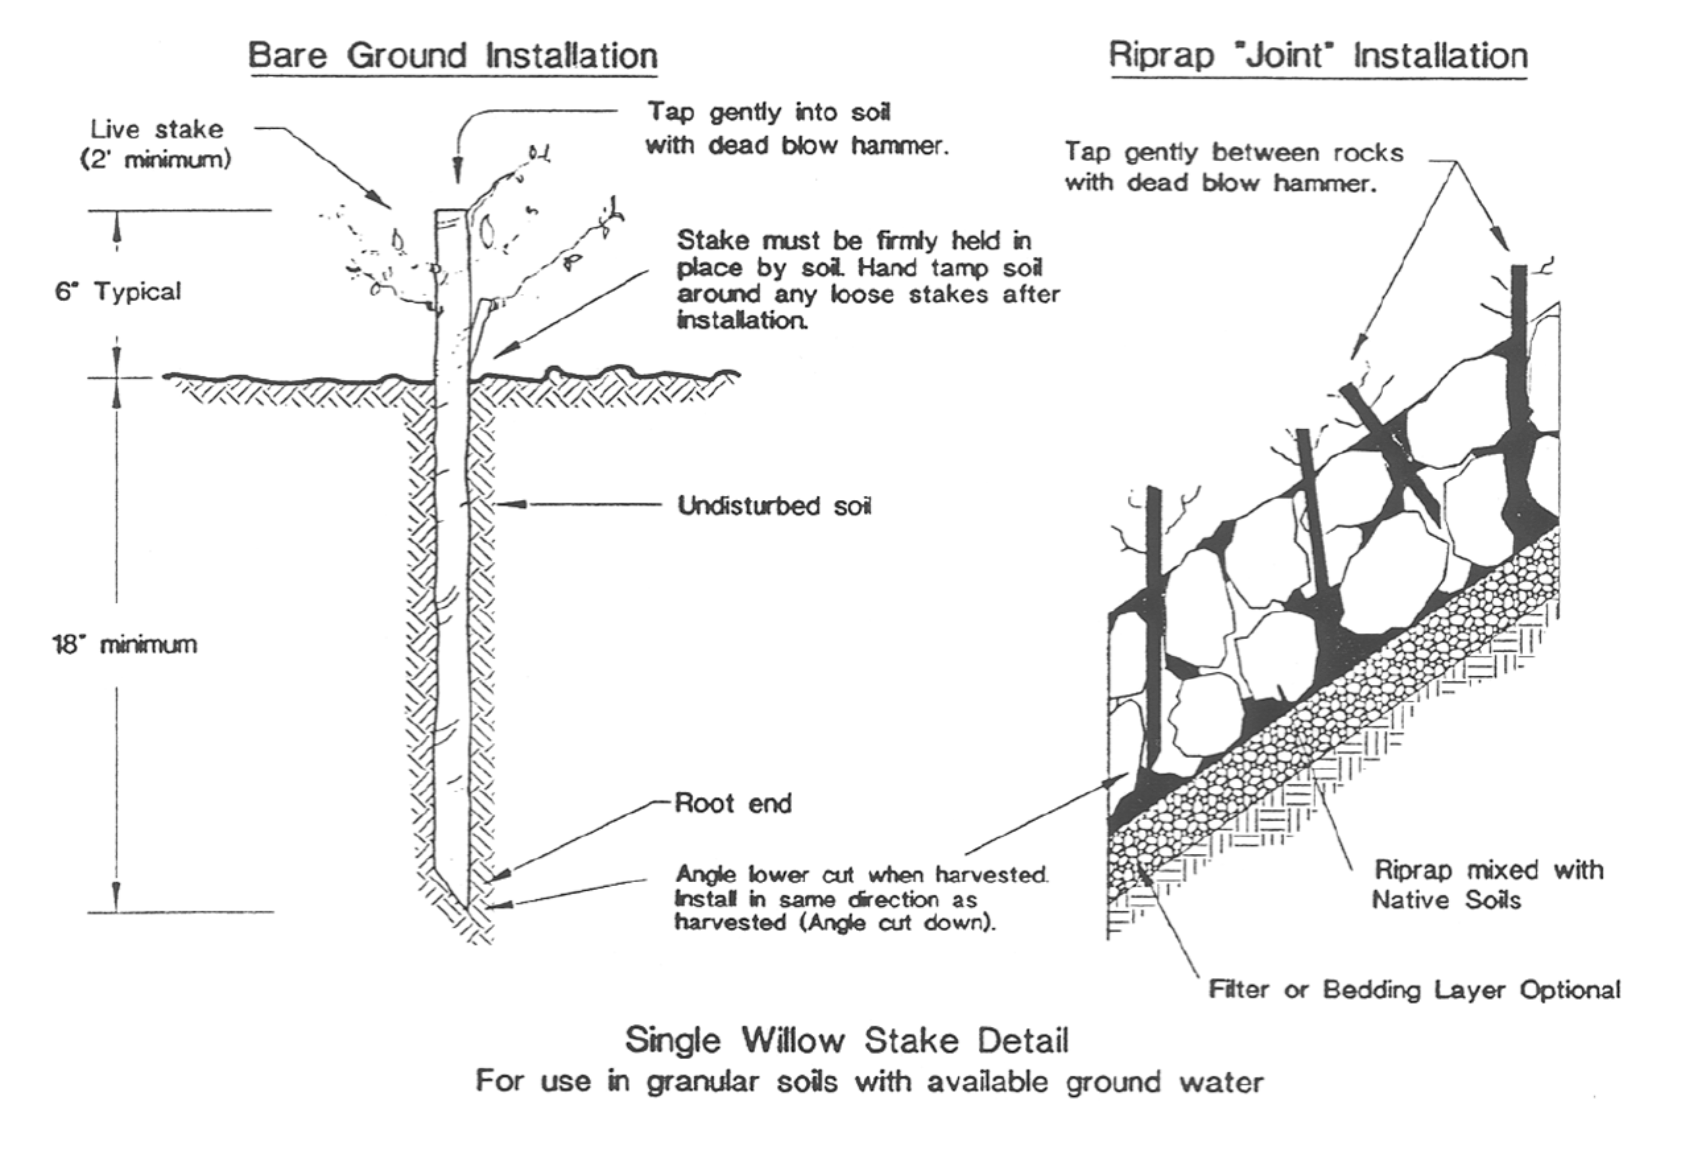
Figure OC-13 – Fascine in Conjunction With Jute Mesh Mat (UDFCD USDCM 2002)
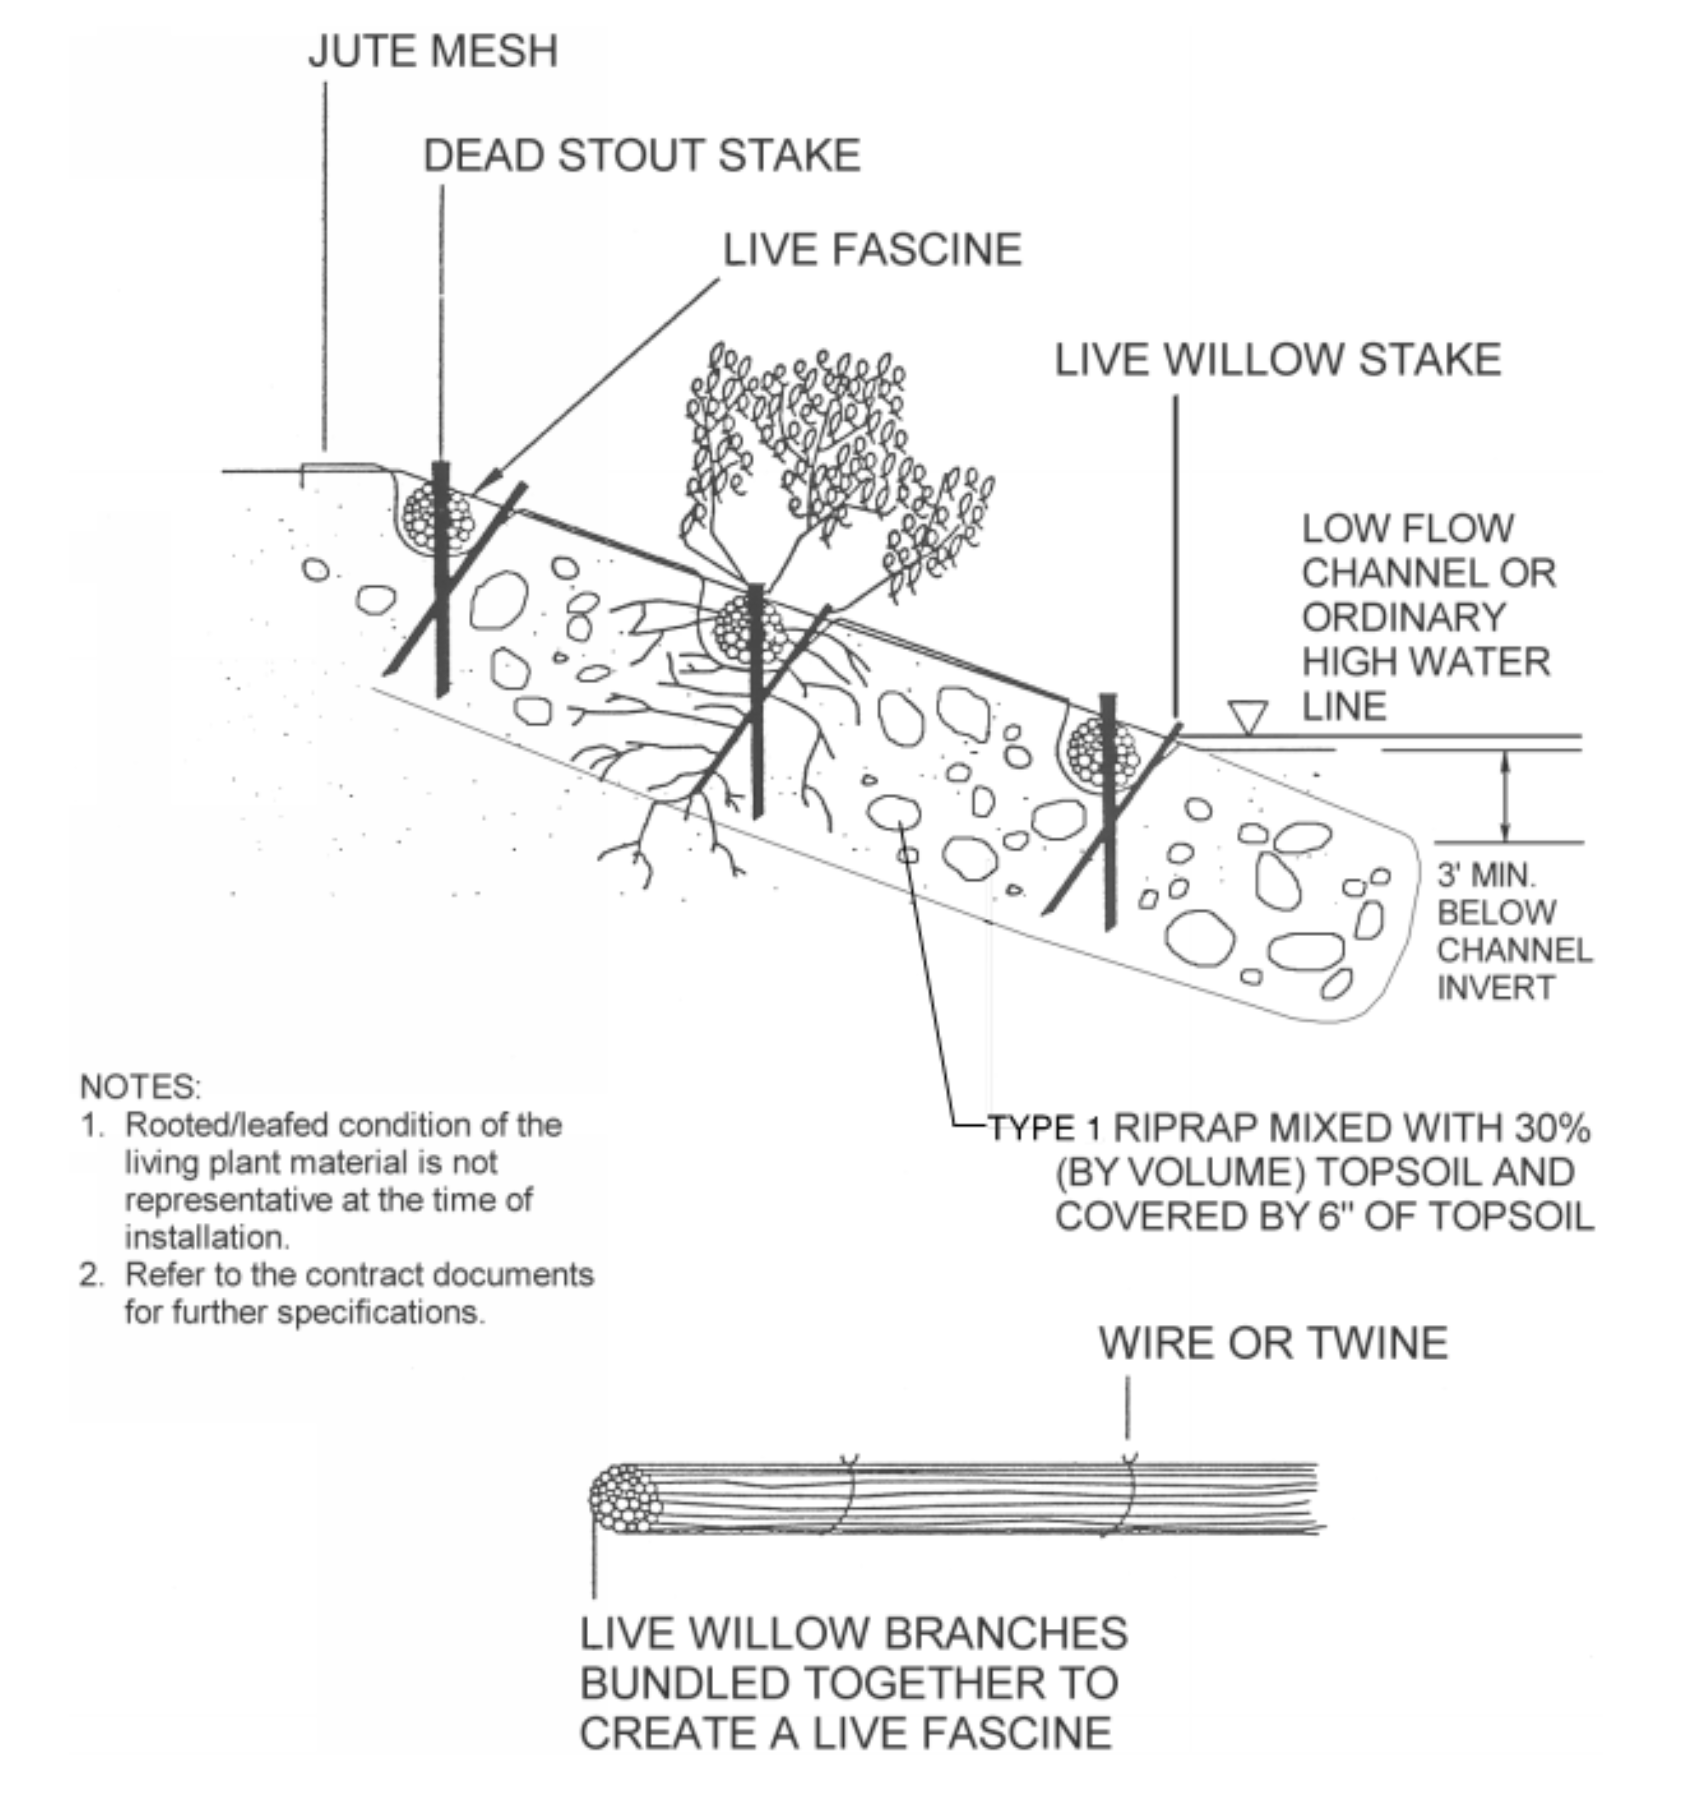
Figure OC-14 – Fiber Roll (UDFCD USDCM 2002)
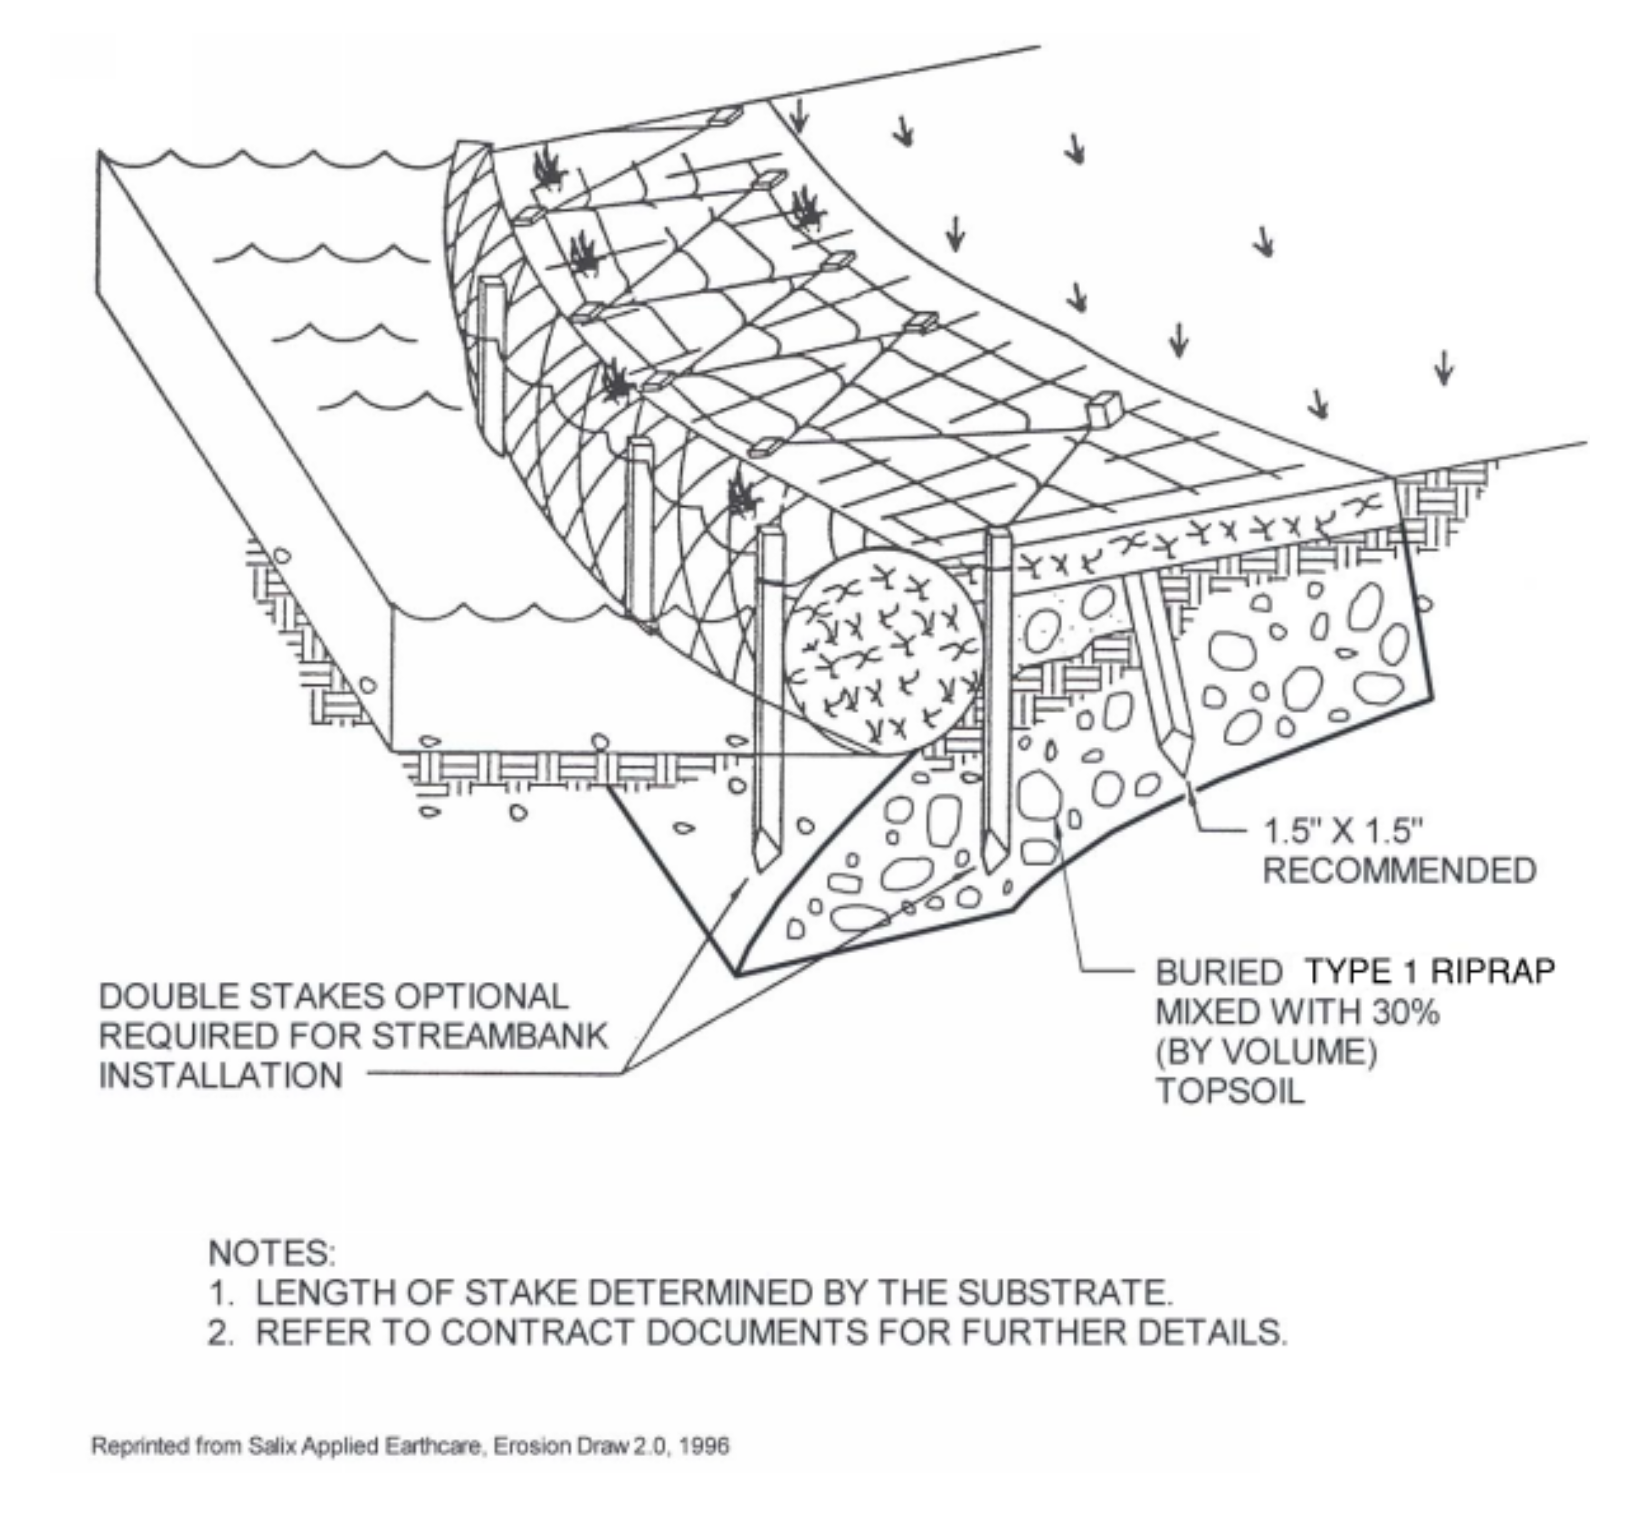
Culverts
Culverts are available in a variety of sizes, shapes, and materials. These factors, along with several others, affect their capacity and overall performance. Sizes and shapes may vary from small circular pipes to extremely large arch sections that are sometimes used in lieu of bridges.
The most commonly used culvert shape is circular, but arches, boxes, and elliptical shapes are used, as well. Pipe arch, elliptical, and rectangular shapes are generally used in lieu of circular pipe where there is limited cover. Arch culverts have application in locations where less obstruction to a waterway is a desirable feature, and where foundations are adequate for structural support. Box culverts can be designed to pass large flows and to fit nearly any site condition. A box or rectangular culvert lends itself more readily than other shapes to reduced allowable headwater situations since the height may be decreased and the span increased to satisfy the location requirements.
The material selected for a culvert is dependent upon various factors, such as durability, structural strength, roughness, bedding condition, abrasion and corrosion resistance, and water tightness. The more common culvert materials used are concrete and steel (smooth and corrugated).
Another factor that significantly affects the performance of a culvert is its inlet configuration. The culvert inlet may consist of a culvert barrel projecting from the roadway fill or mitered to the embankment slope. Other inlets have headwalls, wingwalls, and apron slabs or standard end-sections of concrete or metal.
A careful approach to culvert design is essential, both in new land development and retrofit situations, because culverts often significantly influence upstream and downstream flood risks, floodplain management and public safety. Culverts can be designed to provide beneficial upstream conditions and to avoid negative visual impact.
Bridges
Bridge openings shall be designed to have as little effect on the flow characteristics as reasonable, consistent with good bridge design and economics. The method of planning for bridge openings must include water surface profiles and hydraulic gradient analyses of the channel for the major storm runoff. The design of a bridge opening generally determines the overall length of the bridge. The hydraulic engineering in the design of bridges has more impact on the bridge cost than does the structural design. All structural calculations shall be in compliance with the AASHTO LRFD Bridge Design Specifications (current edition) and stamped by a structural engineer licensed in the State of Arkansas. Trail bridges shall be designed according to the LRFD Guide Specifications for Design of Pedestrian Bridges (current edition) and stamped by a structural engineer licensed in the State of Arkansas. The construction specifications shall be ARDOT’s specifications modified appropriately to reflect Rogers as the owner rather than ARDOT.
A majority of bridge failures are the result of scour. The added cost of reducing a bridge’s vulnerability to damage from scour is small in comparison to the total cost of a bridge failure. Scour investigation is required by the AASHTO LRFD Bridge Design Specifications.
Required Design Information
Information necessary for the design of culverts is summarized below:
- Design flood frequency and the corresponding design flow rate that the culvert must convey.
- Identify the impacts of various culvert sizes and dimensions on upstream and downstream flood risks, including the implications of embankment overtopping.
- Determine how the proposed culvert will fit into the relevant major drainageway master plan, and determine if there are multipurpose objectives that should be satisfied.
- Identify the necessary alignment, grade, and length of culvert.
- Determine the culvert size and type (material and shape).
- Determine the headwater depth, outlet velocity, and end treatment.
- Determine the inlet and outlet design and the need for special considerations.
- Determine the amount and type of cover.
- Identify public safety issues, including the key question of whether or not to include a safety/debris rack; handrails and/or guardrail.
- Identify the need for protective measures against abrasion and corrosion.
- Identify potential structural and geotechnical considerations that need to be addressed (these are beyond the scope of this chapter). The City may require a structural or geotechnical analysis.
Culvert Shapes and Sizes
- Refer to Section 3.3.2 of this chapter for more detailed information/explanation.
- Box
- Circular
- Elliptical
- Arch
Culvert Sizes
- Refer to Section 3.3.2 of this chapter for more detailed information/explanation.
- Minimum Pipe Size = 18 inches
- Minimum Box Size = “W” x 18 inches (width x height)
Culvert Material
- All pipe shall be installed per the manufacturer’s specifications.
- Reinforced Concrete Pipe (RCP)
- RCP ASTM Class III shall be used in all areas unless otherwise required due to fill heights; use ARDOT standards to determine.
- Shall be used in all right-of-way areas and under all traffic areas (including parking lots, driveways, etc.)
- RCP shall conform to:
- Circular Pipe – AASHTO M170/ASTM C76
- Arch-shaped Pipe – AASHTO M206/ASTM C506
- Elliptical Pipe – AASHTO M207/ASTM C507.
- All storm sewer pipe having a diameter or hydraulically equivalent pipe size diameter of 36-inches or greater must be RCP.
- Minimum one-foot cover.
- Reinforced Concrete Box (RCB)
- Box culverts shall be structurally designed to accommodate the earth and live loads to be imposed upon the culvert.
- Shall comply with ARDOT’s Reinforced Concrete Box Culvert Standard Drawings.
- When installed within public right of way, all culverts shall be capable of withstanding a minimum HL-93 loading.
- Materials other than reinforced concrete shall be approved by the City.
- Corrugated Metal Pipe (CMP) [including Smooth Lined (SLCMP)]
- CMP can only be used in areas outside of street right-of-way, but shall not be used under traffic areas.
- CMP shall conform to shall conform to the following:
- Galvanized Steel - AASHTO M218/ASTM A929; AASHTO M36/ASTM A760 and AASHTO Section 12/ASTM A796
- Aluminized Steel Type 2 – AASHTO M274/ASTM A929; AASHTO M36/ASTM A760 and AASHTO Section 12/ASTM A796
- Aluminum – AASHTO M197/ASTM B744; AASHTO M196/ASTM B745 and AASHTO Section 12/ASTM B790.
- CMP shall have a minimum cover of 2-feet.
- Corrugated Polyethylene Pipe (CPP) [including Smooth Lined (SLCPP)]
- CPP may not be used:
- in City right-of-way
- under traffic areas
- in City drainage easements
- to convey water through a development from properties upstream
- on properties where drainage structures are maintained by a residential POA
- CPP can only be used in situations where it is not draining off-site properties, after approval by the City.
- CPP up to 30-inches can be used in areas outside of the right-of-way and outside of city drainage easements.
- CPP shall conform to AASHTO M 294, Type S specification or ASTM F2648, ASTMD3350 and ASTMF2306.
- CPP shall have a minimum cover of 2-feet.
- CPP may not be used:
Culvert Physical and Operational Constraints
- Maximum Allowable Discharge Velocity:
Downstream Condition
Maximum Allowable Discharge Velocity (ft/sec)
Grass
5
Riprap
12
Concrete
18
Turf Reinforcement Mat
Manufacturer’s Specs.
- Culvert flow velocity (minimum) = 3-ft/sec (when flowing full per HEC-22)
- Three methods of energy dissipation/erosion control (Section 6.2 of this chapter) are Drop Structures, Turf Reinforcement Mats and Riprap. Riprap must be approved by City prior to use.
- Design Storm Frequency and Freeboard Policy:
Description | Design Storm Frequency | Minimum Freeboard (ft) |
|---|---|---|
Culverts (Local Street) | 10 | 1 |
Culverts (Collector) | 25 | 1 |
Culverts (Minor Arterial & Major Arterial) | 50 | 1 |
Bridges (Local & Collector Roadways) | 50** | 1* |
Bridges (Arterial & Critical Service Access Roadways/Drives) | 100 | 1* |
* – from “Low Chord” / “Low Steel” ** – must pass 100 year water surface elevation below “Low Chord”/”Low Steel” | ||
Refer to Chapter 4 Storm Sewer System Design Table ST-1 for allowable pavement encroachment and gutter depths.
1.1.1. Discharge
The discharge used in culvert design is usually estimated on the basis of a preselected storm recurrence interval, and the culvert is designed to operate within acceptable limits of risk at that flow rate. The design recurrence interval shall be based on the criteria set forth in Section 3.1.1 of this chapter. Peak discharge rates for the design storm can be calculated using design methods described in Chapter 3 – Determination of Stormwater Runoff.
1.1.2. Headwater
Culverts generally constrict the natural stream flow, which causes a rise in the upstream water surface. The elevation of this water surface is termed headwater elevation, and the total flow depth in the stream measured from the culvert inlet invert is termed headwater depth.
In selecting the design headwater elevation, the designer shall consider the following:
• Roadway elevation above the structure and low point in roadway grade line.
• Elevation at which water will flow to the next cross drainage.
• Anticipated upstream and downstream flood risks, for a range of return frequency events.
• Potential damage to the culvert and the roadway caused by various headwater depths.
• Traffic interruption caused by overtopping a roadway with flood flows.
• Hazard to human life and safety caused by roadway or trail overtopping.
• Headwater/Culvert Depth (HW/D) ratio.
• Relationship to stability of embankment that culvert passes through.
The headwater elevation for the design discharge shall be consistent with the freeboard and overtopping criteria in Section 3.1.1 (Table CB-2) of this chapter and Chapter 4 – Storm Sewer System Design. The designer shall verify that the watershed divides are higher than the design headwater elevations. In flat terrain, drainage divides are often undefined or nonexistent and culverts shall be located and designed for the least disruption of the existing flow distribution.
1.1.3. Tailwater
Tailwater is the flow depth in the downstream channel measured from the invert at the culvert outlet. It can be an important factor in culvert hydraulic design because a submerged outlet may cause the culvert to flow full rather than partially full, which affects the capacity of the culvert.
A field inspection of the downstream channel should be made to determine whether there are obstructions that will influence the tailwater depth. Tailwater depth may be controlled by the stage in a contributing stream, headwater from structures downstream of the culvert, reservoir water surface elevations, or other downstream features.
1.1.4. Outlet Velocity
The outlet velocity of a culvert is the velocity measured at the downstream end of the culvert. The outlet velocity is usually higher than the maximum natural stream velocity and can cause streambed scour and bank erosion downstream from the culvert outlet. Permissible velocities at the outlet will depend upon streambed characteristics, and the type of energy dissipation (outlet protection) that is provided.
Variations in shape and size of a culvert seldom have a significant effect on the outlet velocity. Slope and roughness of the culvert barrel are the principal factors affecting the outlet velocity.
2.1.1. Energy and Hydraulic Grade Lines
Figures CB-1 and CB-2 illustrate the energy grade line (EGL) and hydraulic grade line (HGL) and related terms.
Energy Grade Line
The energy grade line, also known as the line of total head, is the sum of velocity head ![]() , the depth of flow or pressure head
, the depth of flow or pressure head ![]() , and the elevation above an arbitrary datum represented by the distance Z (see Figure CB-1). The energy grade line slopes downward in the direction of flow by an amount equal to the energy gradient HL/L, where HL equals the total energy loss over the distance L.
, and the elevation above an arbitrary datum represented by the distance Z (see Figure CB-1). The energy grade line slopes downward in the direction of flow by an amount equal to the energy gradient HL/L, where HL equals the total energy loss over the distance L.
Hydraulic Grade Line
The hydraulic grade line is the sum of the elevation Z and the depth of flow or pressure head ![]() .
.
For open channel flow, the term is equivalent to the depth of flow and the hydraulic grade line is the same as the water surface (see Figure CB-1). For pressure flow in closed conduits (e.g., culverts), ![]() is the pressure head and the hydraulic grade line falls above the top of the conduit as long as the pressure relative to atmospheric pressure is positive.
is the pressure head and the hydraulic grade line falls above the top of the conduit as long as the pressure relative to atmospheric pressure is positive.
Figure CB-1 – Definition of Terms for Closed Conduit Flow
(UDFCD USDCM, 2001)
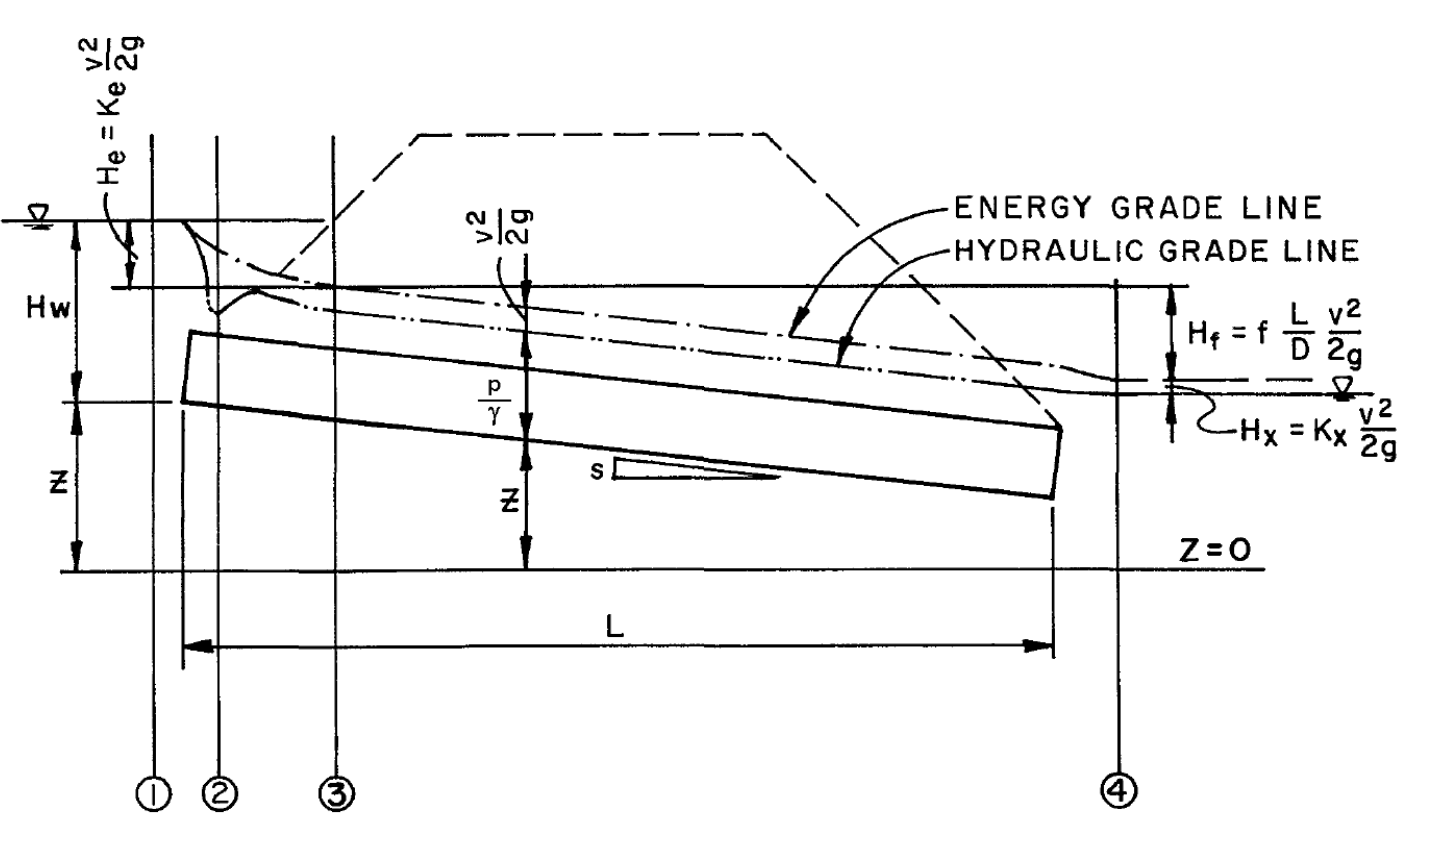
Figure CB-2 – Definition of Terms for Open Channel Flow
(UDFCD USDCM, 2001)
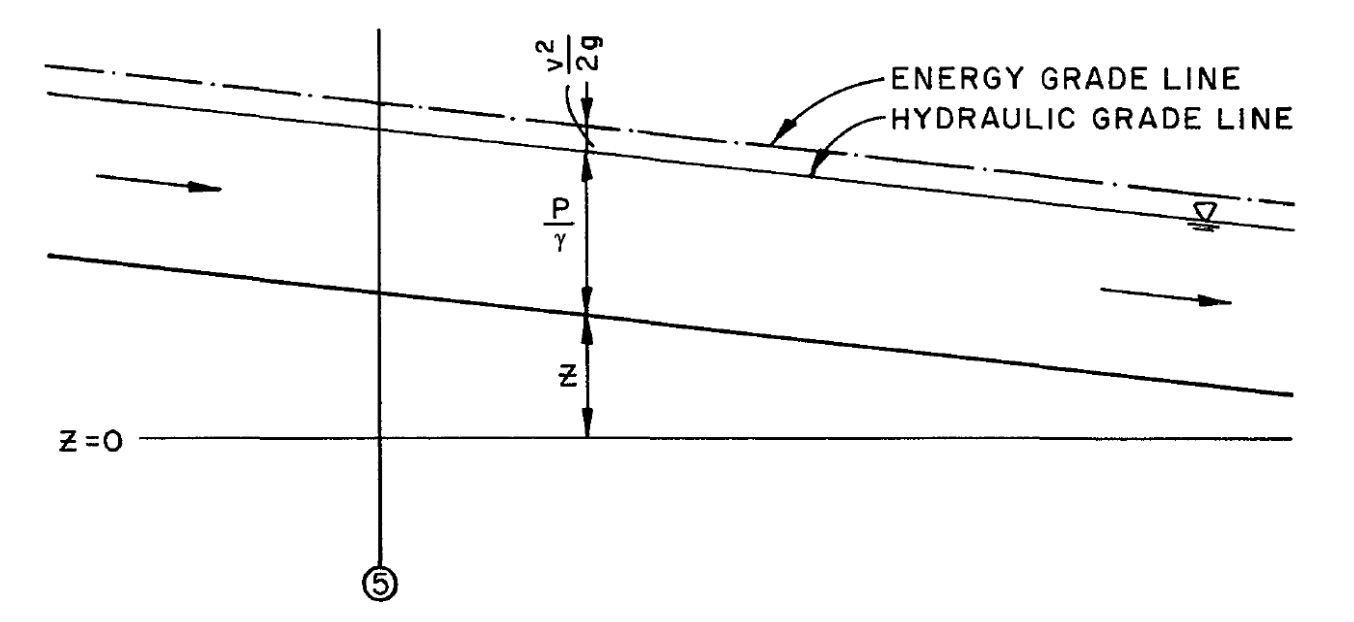
Approaching the entrance to a culvert (refer to Point 1 of Figure CB-1) the flow is essentially uniform and the hydraulic grade line and energy grade lines are almost the same. As water enters the culvert at the inlet, the flow is first contracted and then expanded by the inlet geometry, which causes a loss of energy at Point 2. As normal turbulent velocity distribution is reestablished downstream of the entrance at Point 3, a loss of energy is incurred through friction or from resistance. In short culverts, the entrance losses are likely to be high relative to the friction loss. At the exit, Point 4, an additional loss is incurred through turbulence as the flow expands and is retarded by the water in the downstream channel. At Point 5 of Figure CB-2 open channel flow is established and the hydraulic grade line is the same as the water surface.
2.1.2. Culvert Flow Conditions
There are two major types of flow conditions in culverts: (1) inlet control and (2) outlet control. For each type of control, a different combination of factors is used to determine the hydraulic capacity of a culvert. The determination of actual flow conditions can be difficult; therefore, the designer must check for both types of control and design for the most adverse condition. Inlet and outlet control are described in the following sections.
2.1.2.1. Inlet Control
A culvert operates with inlet control when the flow capacity is controlled at the entrance by these factors:
• Depth of headwater
• Culvert cross-sectional area at inlet
• Inlet edge configuration
• Barrel shape
When a culvert operates under inlet control, headwater depth and the inlet edge configuration determine the culvert capacity, with the culvert barrel usually flowing only partially full.
Inlet control for culverts may occur in two ways. The least common occurs when the headwater depth is not sufficient to submerge the top of the culvert and, concurrently, the culvert invert slope is supercritical as shown in Figure CB-3.
Figure CB-3 – Inlet Control—Unsubmerged Inlet
(UDFCD USDCM, 2001)
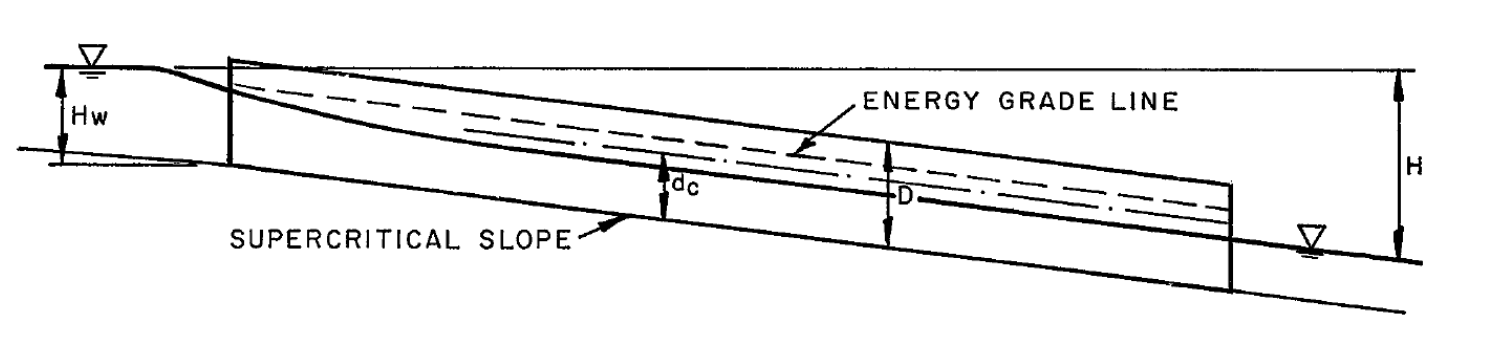
The most common occurrence of inlet control is when the headwater submerges the top of the culvert (Figure CB-4), and the pipe does not flow full. A culvert flowing under inlet control is defined as a hydraulically short culvert.
Figure CB-4 – Inlet Control—Submerged Inlet
(UDFCD USDCM, 2001)
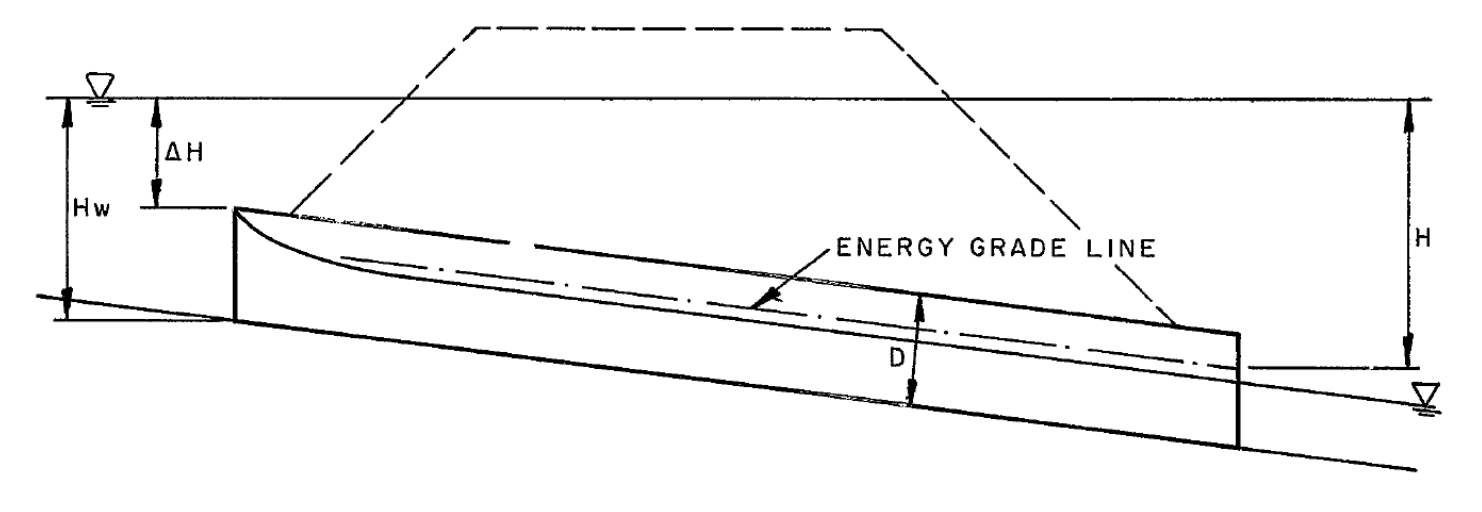
For a culvert operating with inlet control, the roughness, slope, and length of the culvert barrel and outlet conditions (including tailwater) are not factors in determining culvert hydraulic performance.
2.1.2.2. Outlet Control
If the headwater is high enough and the culvert is sufficiently long and flat, the control will shift to the outlet. In outlet control, the discharge is a function of the inlet losses, the headwater depth, the culvert roughness, the culvert length, the barrel diameter, the culvert slope, and sometimes the tailwater elevation.
In outlet control, culvert hydraulic performance is determined by these factors:
• Depth of headwater
• Culvert cross-sectional area
• Inlet edge configuration
• Culvert shape
• Barrel slope
• Barrel length
• Barrel roughness
• Depth of tailwater
Outlet control will exist under two conditions: 1) the most common condition occurs when the culvert is flowing full (Figure CB-6), and 2) the least common condition occurs where the headwater is insufficient to submerge the top of the culvert and, concurrently, the culvert slope is subcritical (Figure CB-5). A culvert flowing under outlet control is defined as a hydraulically long culvert.
Figure CB-5 – Outlet Control—Partially Full Conduit
(UDFCD USDCM, 2001)
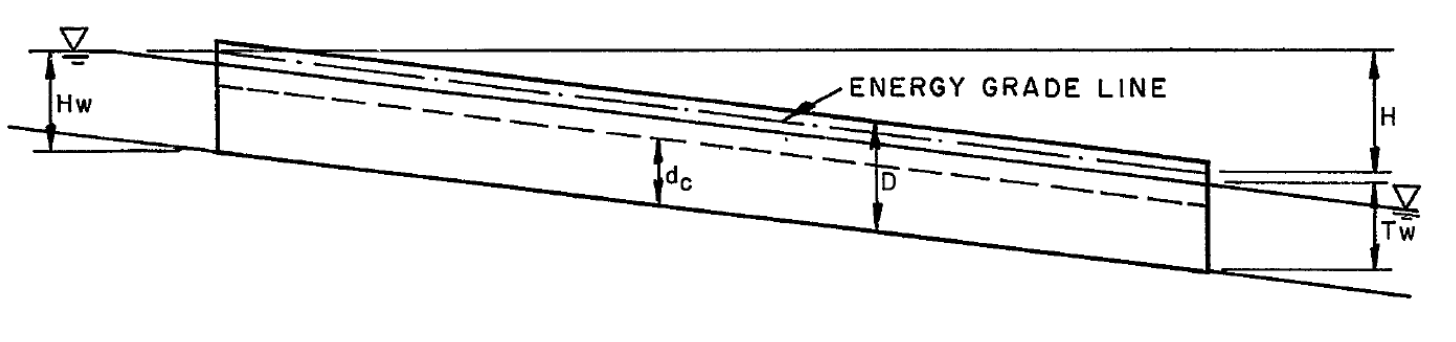
Figure CB-6 – Outlet Control—Full Conduit
(UDFCD USDCM, 2001)
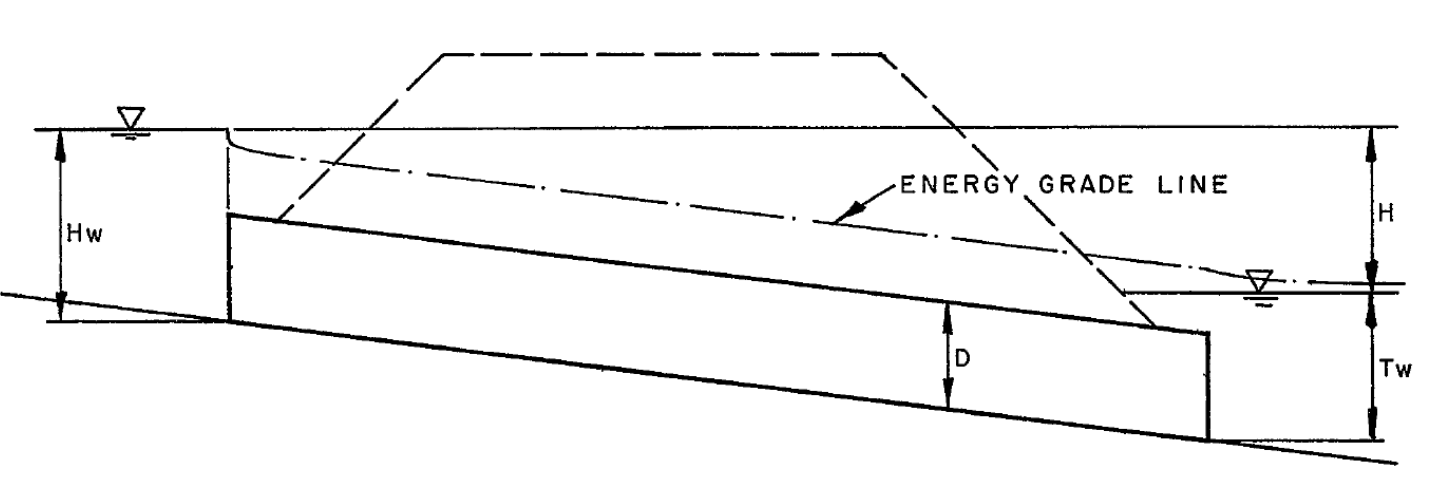
Culverts operating under outlet control may flow full or partly full depending on various combinations of the factors described above. In outlet control, factors that may affect performance appreciably for a given culvert size and headwater are barrel length and roughness, and tailwater depth.
2.2.1. Inlet Losses
For inlet losses, the governing equations are:
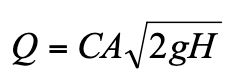 (Equation CB-4)
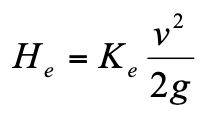 (Equation CB-5)
where:
Q = Flow rate or discharge (ft3/sec)
C = Contraction coefficient (dimensionless) (see Table CB-1 below)
A = Cross-sectional area (ft2)
g = Acceleration due to gravity, 32.2 (ft/sec2)
H = Total head (ft)
He = Head loss at entrance (ft)
Ke = Entrance loss coefficient (dimensionless)
v = Average velocity (ft/sec)
Table CB-1 – Contraction Coefficient
Transition Description | Contraction Coefficient, C |
|---|---|
No transition loss computed | --- |
Gradual transitions | 0.3 |
Intermediate transitions | 0.5 |
Abrupt transitions | 0.8 |
2.2.2. Outlet Losses
For outlet losses, the governing equations are related to the difference in velocity head between the pipe flow and that in the downstream channel at the end of the pipe.
2.2.3. Friction Losses
Friction head loss for turbulent flow in pipes flowing full can be determined from the Darcy-Weisbach equation.
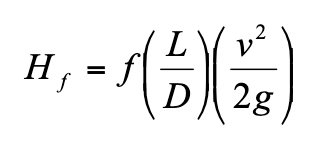 (Equation CB-6)
where:
Hf = Frictional head loss (ft)
f = Friction factor (dimensionless)
L = Length of culvert (ft)
D = Hydraulic diameter of culvert (ft) (internal diameter for circular pipe)
v = Average velocity (ft/sec)
g = Acceleration due to gravity, 32.2 (ft/sec2)
The friction factor has been determined empirically and is dependent on relative roughness, velocity, and barrel diameter. Moody diagrams can be used to determine the friction factor. The friction losses for culverts are often expressed in terms of Manning’s n (see Table ST-9 in Chapter 4 – Storm Sewer System Design), which is independent of the size of pipe and depth of flow. Another common formula for pipe flow is the Hazen-Williams formula. Standard hydraulic texts should be consulted for the limitations of these formulas.
3.1.1. Design Frequency and Freeboard Criteria
The storm frequencies and freeboard used as the basis for culvert design are summarized in Table CB-2:
Table CB-2 – Design Storm Frequencies and Minimum Freeboard
Description | Design Storm Frequency | Minimum Freeboard (ft) |
|---|---|---|
Trails | 2 | 1 |
Local Street | 10 | 1 |
Collector | 25 | 1 |
Minor Arterial & Major Arterial | 50 | 1 |
Bridges (Local & Collector Roadways) | 50 | 1* |
Bridges (Arterial & Critical Service Access Roadways/Drives) | 100 | 1* |
| * – from “Low Chord” / “Low Steel” | ||
3.3.1. Invert Elevations
After determining the allowable headwater elevation, tailwater elevation, and approximate culvert length, the culvert invert elevations must be assumed. To reduce the chance of failure due to scour, invert elevations corresponding to the natural grade shall be used as a first trial.
For natural channels, the flow conditions in the channel upstream from the culvert should be investigated to determine if scour will occur. For more information on scour, see Section 6.1 of this chapter.
3.3.2. Culvert Shape, Size and Material
After the invert elevations have been assumed, the shape of the culvert must be selected. The permissible shapes of culverts under all roadways and embankments are box, circular, elliptical and arch.
Next, the diameter of pipe that will meet the headwater requirements should be determined. Because small diameter pipes are often plugged by sediment and debris, the minimum size of pipe for all culverts is 18-inches or the equivalent sized elliptical pipe or arch pipe. The minimum size box culvert shall have a minimum height of 18-inches and a width (“W”) designed to meet the loading (vehicular/overburden) and hydraulic requirements for the desired application.
Reinforced concrete shall be used for all culverts under roadways and running parallel to the roadway in the street right of way and under all traffic and parking areas. Materials other than reinforced concrete must have City approval prior to use.
Table CB-3 – Maximum Allowable Discharge Velocities
Downstream Condition | Maximum Allowable Discharge Velocity (ft/sec) |
|---|---|
Grass | 5 |
Riprap | 12 |
Concrete | 18 |
Turf Reinforcement Mat | Manufacturer’s Specs. |
Figure CB-7 – Common Projecting Culvert Inlets
(USFCD USDCM, 2001)
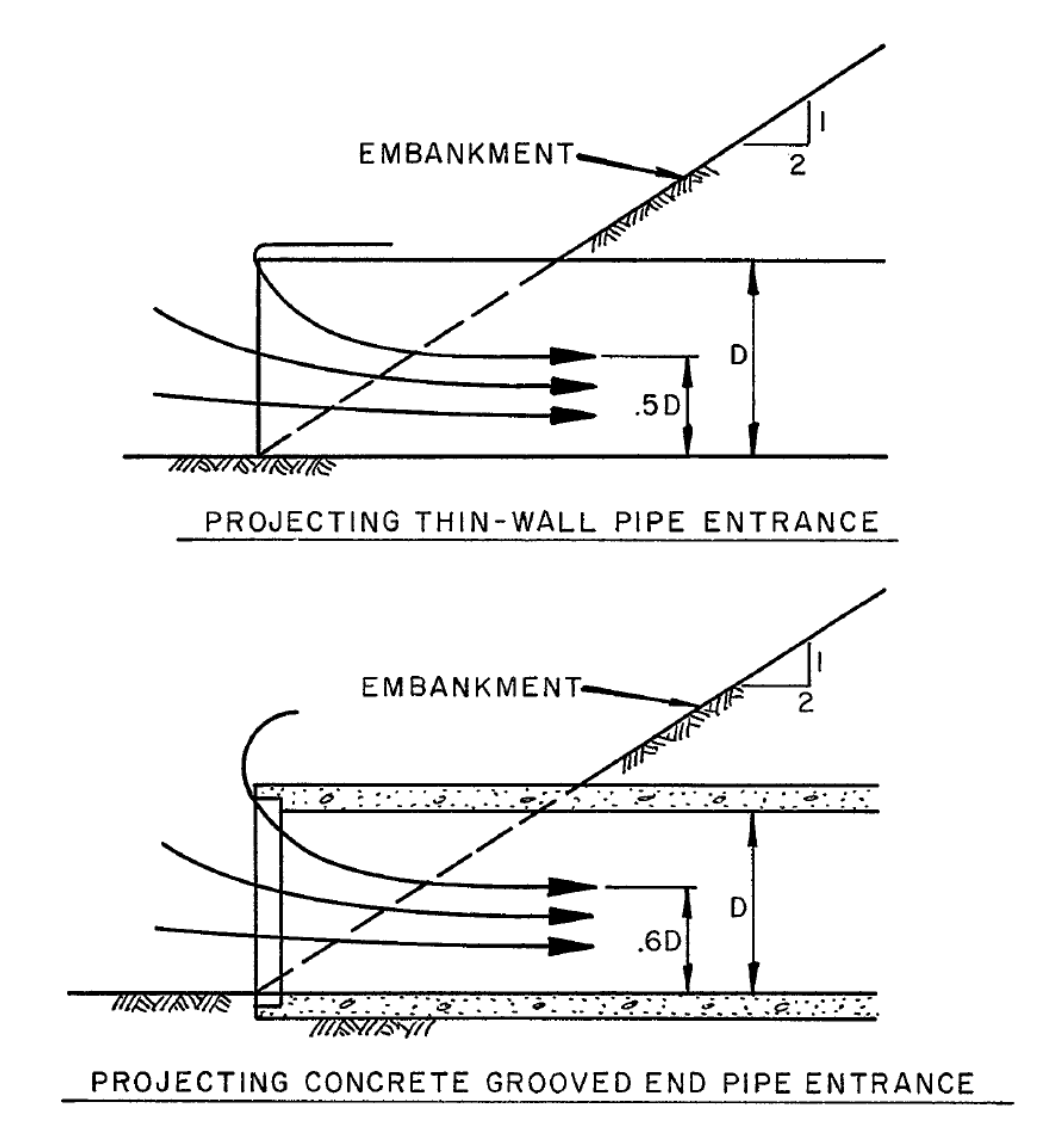
Corrugated metal pipe projecting inlets have limitations which include low hydraulic efficiency, damage resulting from maintenance of the channel and the area adjacent to the inlet, and restrictions imposed on maintenance crews to work around the inlet. In contrast, concrete grooved or bell-end pipe has hydraulic efficiency that is superior to corrugated metal pipe and, therefore, the primary restriction placed on the use of concrete pipe for projecting inlets is the requirement for maintenance of the channel and the embankment surrounding the inlet. Where equipment will be used to maintain the embankment around the inlet, it is not recommended that a projecting inlet of any type be used.
4.1.1. Corrugated Metal Pipe
A projecting entrance of corrugated metal pipe is equivalent to a sharp-edged entrance with a thin wall and has an entrance coefficient of 0.9 (see Table CB-4).
4.1.2. Concrete Pipe
Bell-and-spigot concrete pipe or tongue-and-groove concrete pipe with the bell-end or grooved-end used as the inlet section, are relatively efficient hydraulically with an entrance coefficient of 0.2. For concrete pipe that has been cut, the entrance is square edged, and the entrance coefficient is 0.5 (see Table CB-4).
Figure CB-8 – Inlet with Headwall and Wingwalls
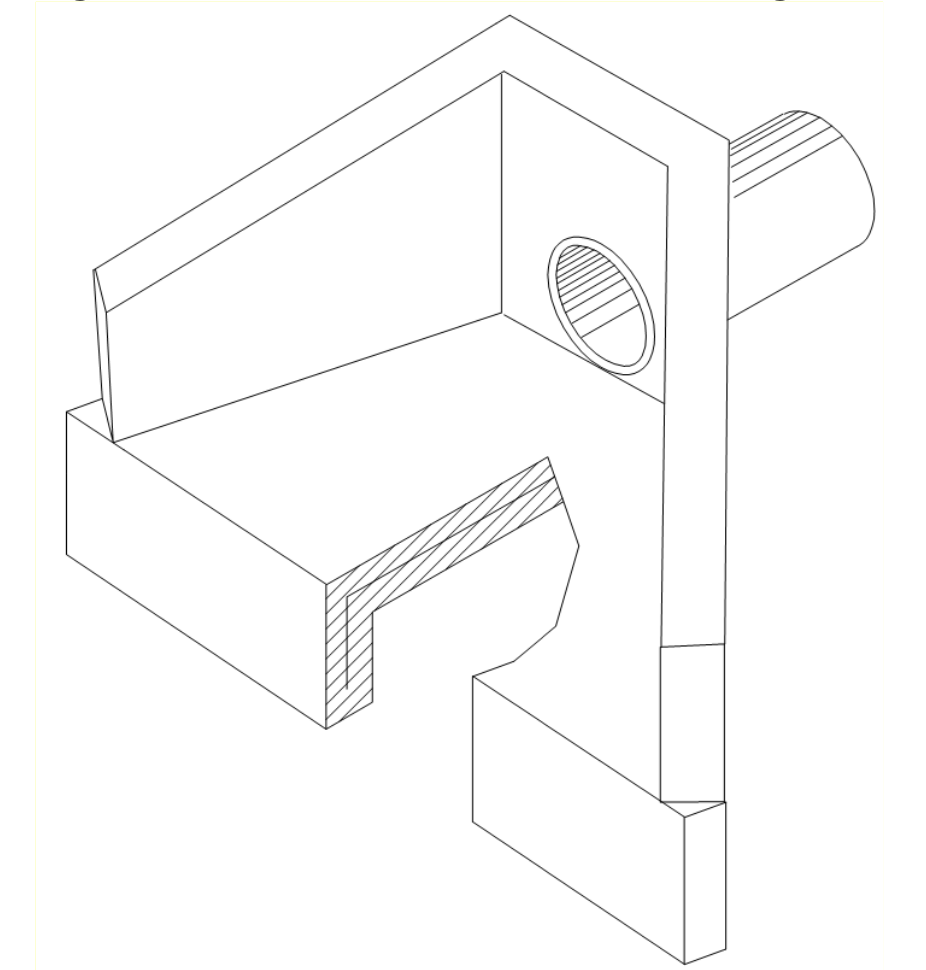
4.2.1. Corrugated Metal Pipe
Corrugated metal pipe in a headwall is characterized as a square-edged entrance with an entrance coefficient of 0.5. The entrance losses may be reduced by rounding the entrance. The entrance coefficient may be reduced to 0.15 for a rounded edge with a radius equal to 0.15 times the culvert diameter, and to 0.10 for rounded edge with a radius equal to 0.25 times the diameter of the culvert.
4.2.2. Concrete Pipe
For tongue-and-groove or bell-end concrete pipe, little increase in hydraulic efficiency is realized by adding a headwall. The primary reason for using headwalls is for embankment protection and for ease of maintenance. The entrance coefficient is equal to about 0.2 for a tongue-and-grooved and bell-end pipe, and equal to 0.5 for cut concrete pipe.
4.2.3. Wingwalls
Wingwalls are used where the side slopes of the channel adjacent to the entrance are unstable and where the culvert is skewed to the normal channel flow. Little increase in hydraulic efficiency is realized with the use of wingwalls, regardless of the pipe material used and, therefore, the use should be justified for reasons other than an increase in hydraulic efficiency. Figure CB-9 illustrates several cases where wingwalls are used. For parallel wingwalls, the minimum distance between wingwalls shall be at least 1.25 times the diameter of the culvert pipe.
4.2.4. Aprons
If high headwater depths will exist, or if the approach velocity of the channel will cause scour, a short channel apron shall be provided at the toe of the headwall. The apron shall extend at least one pipe diameter upstream from the entrance, and the top of the apron shall not protrude above the normal streambed elevation.
Culverts with wingwalls shall be designed with a concrete apron extending between the walls. Aprons must be reinforced to control cracking. As illustrated in Figure CB-9, the actual configuration of the wingwalls varies according to the direction of flow and will also vary according to the topographical constraints of the site.
For conditions where scour may be a problem because of high approach velocities and/or the soil conditions, a toe wall is required for apron construction.
Figure CB-9 – Typical Headwall-Wingwall Configurations
(UDFCD USDCM, 2001)
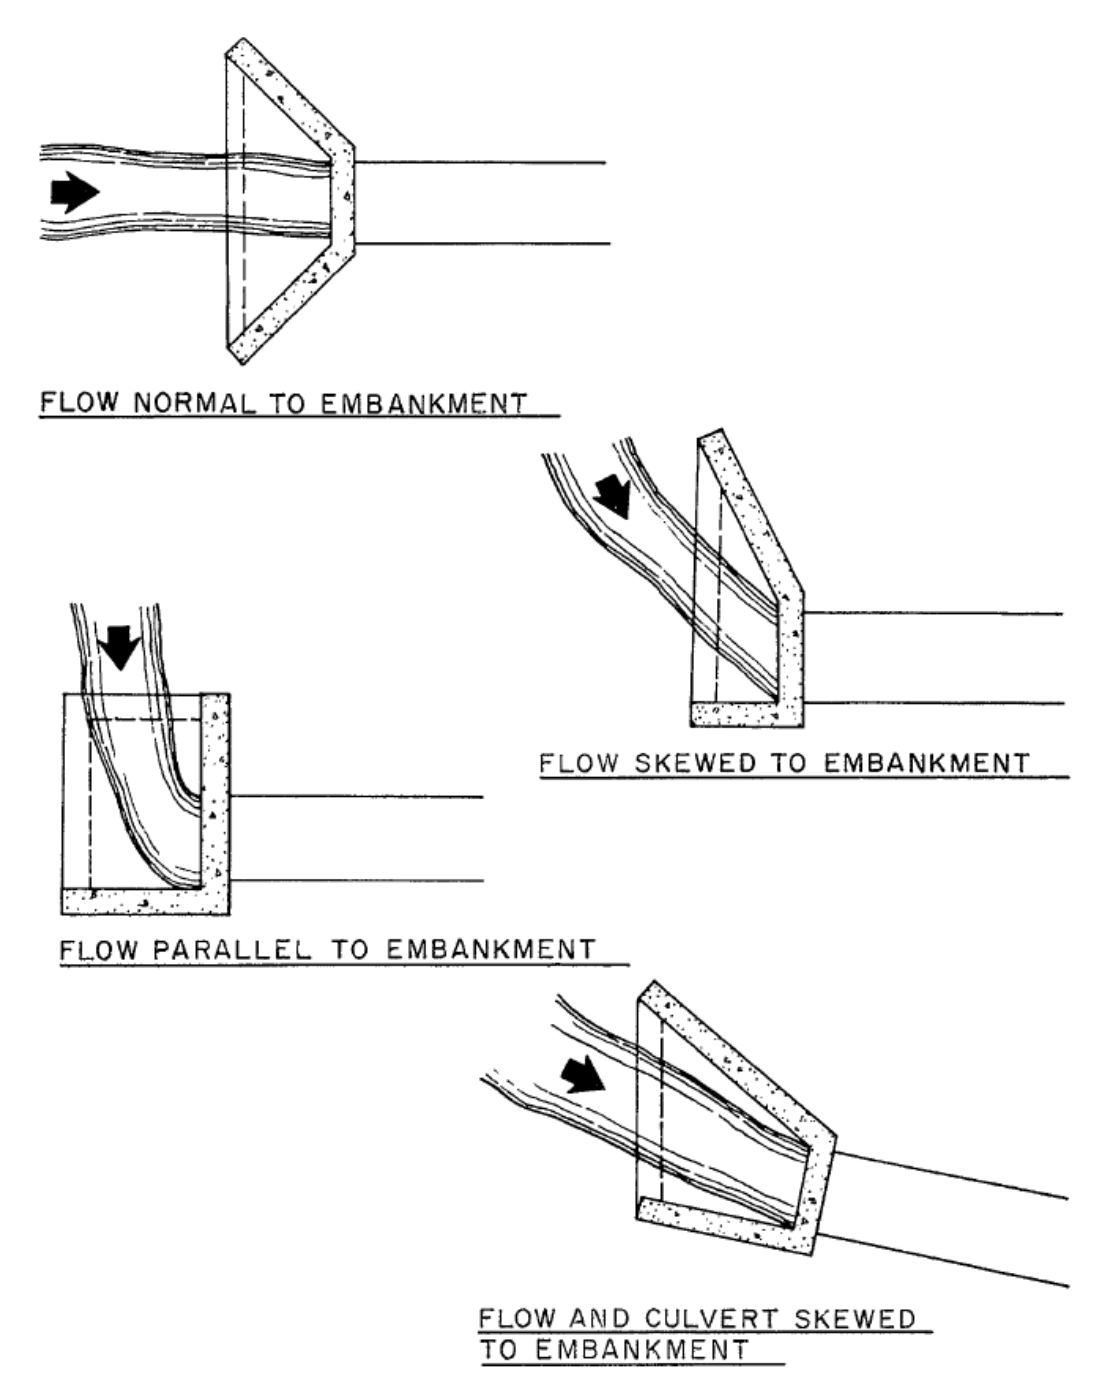
4.3.1. Corrugated Metal Pipe
Special flared end-sections for corrugated metal pipe add little to the overall cost of the culvert and have the following advantages:
1. Require less maintenance around the inlet.
2. Sustain less damage from maintenance work and from accidents compared to a projecting entrance.
3. Provide increased hydraulic efficiency.
4.3.2. Concrete Pipe
As in the case of corrugated metal pipe, special concrete flared end-sections, similar to flared end-sections for corrugated metal pipe, may increase the embankment stability and retard erosion at the inlet. They should be used where maintenance equipment must be used near the inlet or where, for aesthetic reasons, a projecting entrance is considered too unsightly.
The hydraulic efficiency of a concrete flared end section is dependent on the geometry of the end-section to be used. Where the full contraction to the culvert diameter takes place at the first pipe section, the entrance coefficient, Ke, is equal to 0.5, and where the full contraction to the culvert diameter takes place in the throat of the end-section, the entrance coefficient, Ke, is equal to 0.2.
4.3.3. Mitered Inlets
Mitered inlets are predominantly used with corrugated metal pipe and their hydraulic efficiency is dependent on the construction procedure used. If the embankment is not paved, the entrance, in practice, usually does not conform to the side slopes, resulting in a projecting entrance with Ke = 0.9. If the embankment is paved, a sloping headwall is obtained with Ke = 0.7 and, by beveling the edges, Ke = 0.2.
Uplift is an important factor for mitered inlets. It is not good practice to use unpaved embankment slopes where a mitered entrance may be submerged above the top of the pipe to an elevation one-half the diameter of the culvert.
4.3.4. Long Conduit Inlets
Inlets are important in the design of culverts for road crossings and other short sections of conduit; however, inlets are even more significant in the economical design of long culverts and pipes. Unused capacity in a long conduit will result in wasted investment. Long conduits are costly and require detailed engineering, planning, and design work. The inlets to such conduits are extremely important to the functioning of the conduit and must receive special attention.
Most long conduits require special inlet considerations to meet the particular hydraulic characteristics of the conduit. Generally, on larger conduits, hydraulic model testing will result in better and less costly inlet construction.
4.3.5. Improved Inlets
Inlet edge configuration is one of the prime factors influencing the performance of a culvert operating under inlet control. Inlet edges can cause a severe contraction of the flow, as in the case of a thin edge, projecting inlet. In a flow contraction, the effective cross-sectional area of the barrel may be reduced to approximately one-half of the actual available barrel area. As the inlet configuration is improved, the flow contraction is reduced, thus improving the performance of the culvert.
A tapered inlet is a flared culvert inlet with an enlarged face section and a hydraulically efficient throat section. Tapered inlets improve culvert performance by providing a more efficient control section (or culvert throat). However, tapered inlets are not recommended for use on culverts flowing under outlet control because a simple beveled edge inlet is of equal benefit. The two most common improved inlets are the side-tapered inlet and the slope-tapered inlet. HDS-5 (FHWA 2005 - http://isddc.dot.gov/.../FHWA) provides guidance on the design of improved inlets.
6.2.1. Drop Structures
Drop structures are commonly used for flow control and energy dissipation. Changing the channel slope from steep to mild, by placing drop structures at intervals along the channel reach, changes a continuous steep slope into a series of gentle slopes and vertical drops. Instead of slowing down and transferring high velocities that produce erosion into low non-erosive velocities, drop structures control the slope of the channel in such a way to prevent high, erosive velocities from developing. The kinetic energy or velocity gained by the water as it drops over the crest of each structure is dissipated by a specially designed apron or stilling basin. HEC-14 (FHWA 2006) provides guidance for the design and selection of drop structures.
6.2.2. Turf Reinforcement Mat
Turf reinforcement mat (TRM) is a long term non-biodegradable biotechnical alternative for hard armor such as riprap. It is mechanically-anchored polymer matting designed with voids throughout the structure which enables vegetative growth to cover the material while still providing mechanical protection in areas where design discharges exert velocities and shear stresses that exceed the limits of natural vegetation. TRMs are used to extend the performance limits of natural vegetation by, retaining soil particles and vegetative seeds, promoting conditions for accelerated vegetative growth, and reinforcement of the vegetative cover. The EPA has documented TRMs as useful BMPs for stormwater runoff. The EPA’s Storm Water Technology Fact Sheet for TRMs can be found at http://www.epa.gov/owm/mtb/turfrein.pdf and provides a useful general discussion on the benefits, specific locations for use, and other general information for TRMs.
Many different manufacturers produce TRMs, each with its own patented methods and material combinations. Some of the manufacturers/distributors of TRMs include ScourStop, North American Green, Propex, ShoreMax, among others. TRMs shall be selected, designed, and installed according to the manufacturer’s recommendation. When attempting to implement such reinforcement into the design of energy dissipation/erosion control, it will be the responsibility of the design engineer to provide the City with appropriate material specifications and design information. Enough information needs to be provided to ensure the product selected and specified in a design is adequately suited for the situation in the field.
Figure CB-10 – Typical Turf Reinforcement Mat Application
(Scourstop.com)
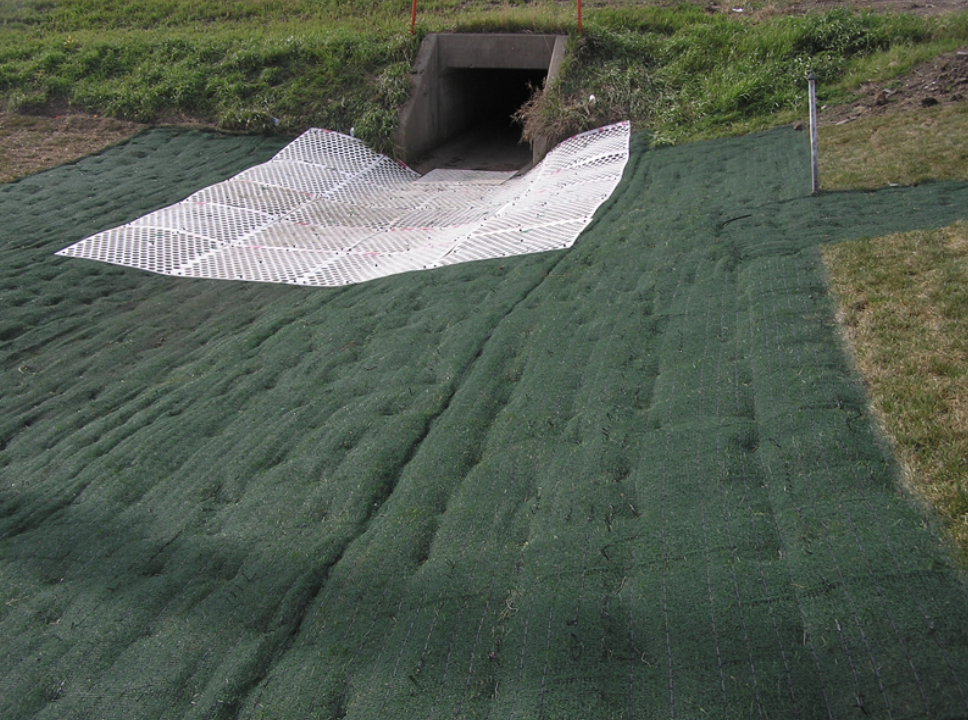
6.2.3. Hydraulic Jump Energy Dissipators
Hydraulic Jump Energy Dissipators create a hydraulic jump by placing staggered rows of blocks at the culvert outlet. The block height (h) shall be 0.31 to 0.91 of the approach flow’s average depth yA and the ratio of L/h shall be equal to 6 or 12. The design of these dissipators is based on the momentum equation as shown in Equation CB-7. This equation is applicable for slopes up to 10%; see HEC-14 (FHWA 2006) for design methods on slopes greater than 10%.
Figure CB-11 – Hydraulic Jump Energy Dissipators
(FHWA – HEC 14, 2006)
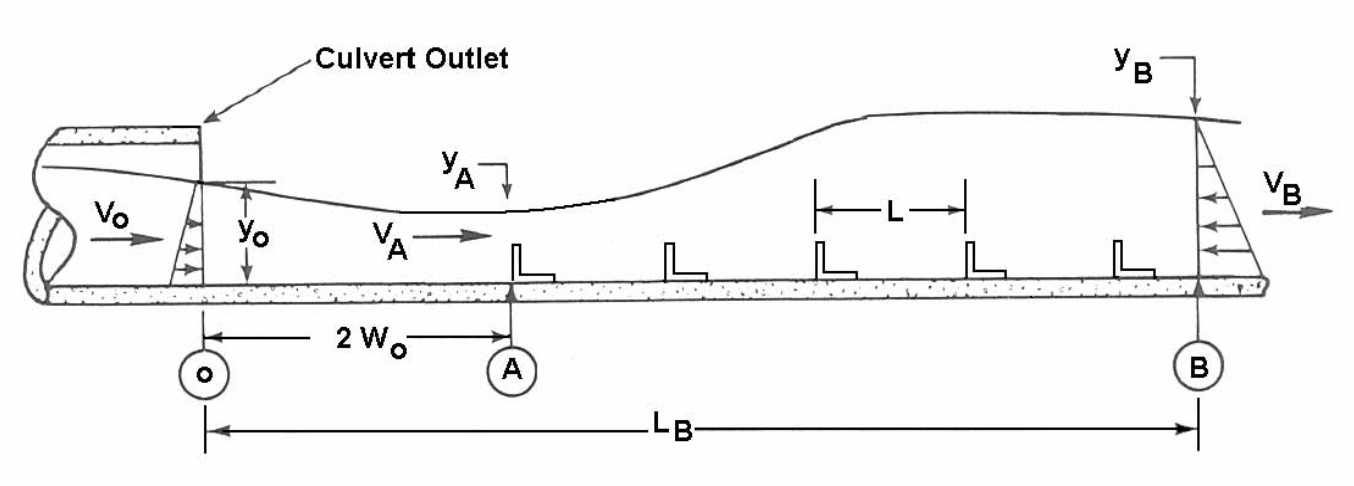
 (Equation CB-7)
where:
y0 = depth at the culvert outlet (ft)
V0 = velocity at the culvert outlet (ft/s)
W0 = culvert width at the culvert outlet (ft)
VA = approach velocity at two culvert widths downstream of the culvert outlet (ft/s)
VB = exit velocity, just downstream of the last row of roughness elements (ft/s)
WB = basin width, just downstream of the last row of roughness elements (ft/s)
N = total number of roughness elements in the basin
AF = frontal area of one full roughness element (ft2)
CB = basin drag coefficient
CP = momentum correction coefficient for the pressure at the culvert outlet
γ = unit weight of water (62.4 lbs/ft3)
ρ = density of water (1.94 slugs/ft3)
Table CB-5 shows empirical drag coefficients CB for the basin configurations shown in Figure CB-12.
Figure CB-12 – Basin Configurations
(FHWA HEC 14, 2006)
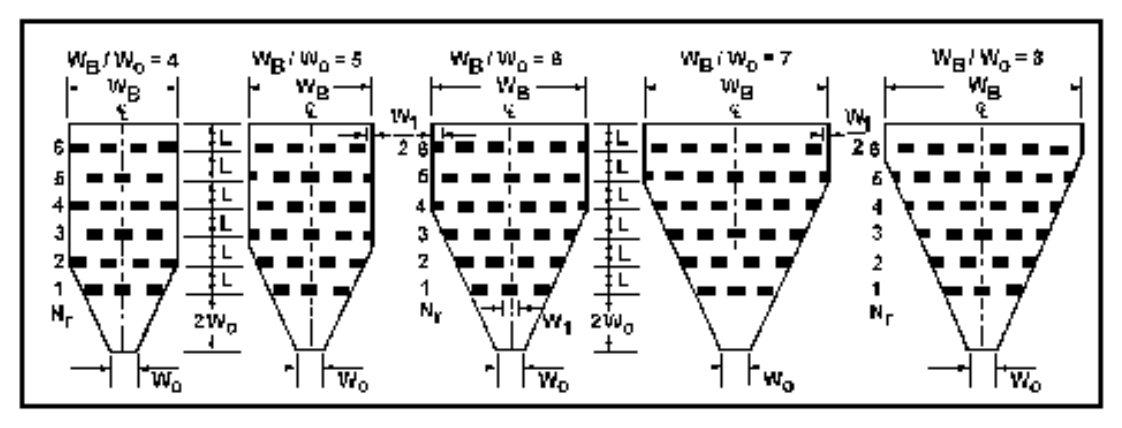
Table CB-5 – Design Values for Roughness Elements
(FHWA HEC-14, 2006)
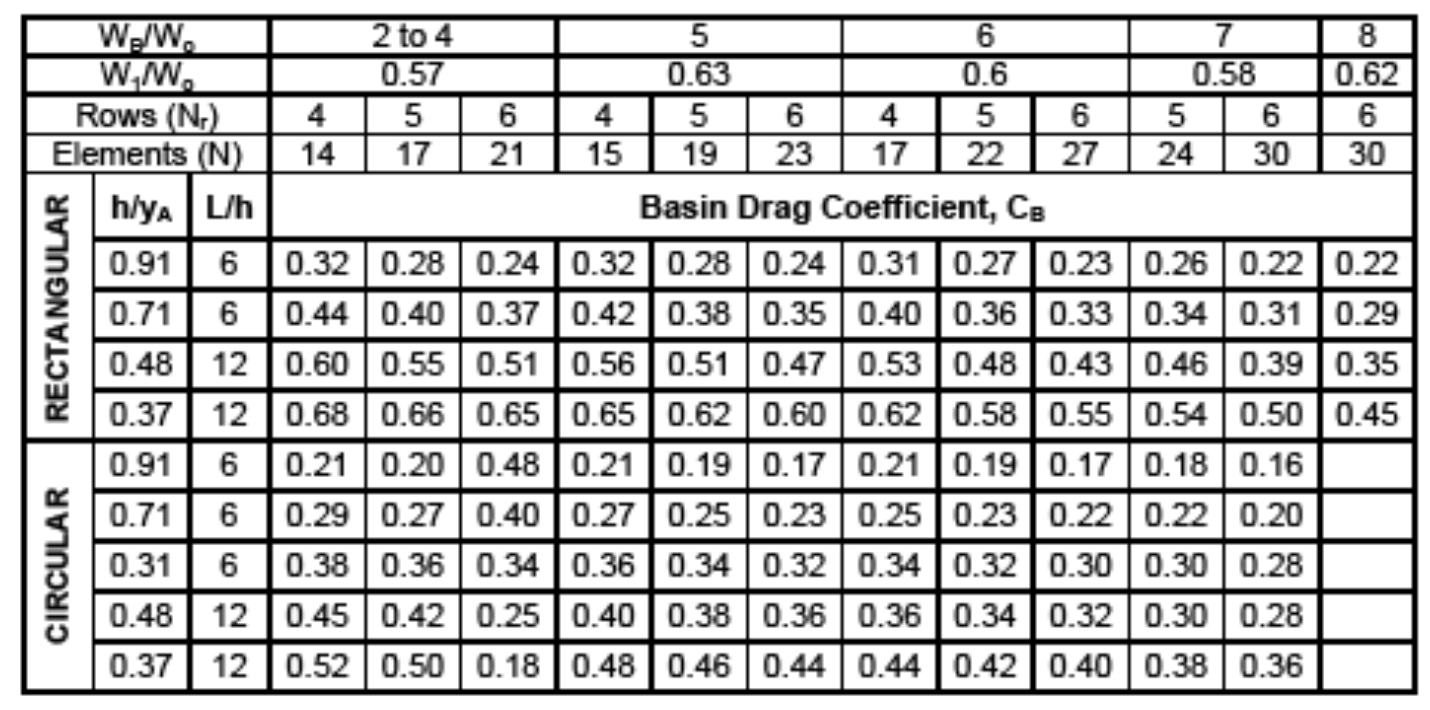
6.2.4. Riprap as Outlet Protection
Riprap can be an effective measure for erosion and scour protection, but is a nuisance to maintain and an eyesore to the public. Information regarding the sizing of riprap is provided in Chapter 6 – Open Channel Flow Design. Riprap can only be used with City approval and riprap must also be grouted in place. Riprap shall not be the first choice for energy dissipation/erosion control and City approval will be dependent upon the design engineer showing the ineffectiveness of other types of energy dissipation devices for the specific situation under consideration. The City requires the use of the RDM-Culvert spreadsheet for calculating the size and extents of riprap as outlet protection for circular and equivalent diameter noncircular pipe. The Riprap Outlet Protection tab in the RDM-Culvert spreadsheet calculates the minimum riprap size (d50) and minimum apron length required for riprap outlet protection for circular and equivalent diameter noncircular pipe. However, should riprap as outlet protection need to be designed for an outlet and/or culvert scenario not applicable to the conditions set forth in the Riprap Outlet Protection tab in the RDM-Culvert spreadsheet, the following sections shall be used in the design of riprap as outlet protection. In all cases the thickness/structural layer of riprap as outlet protection shall be constructed as shown in Figure CB-14.
6.2.4.1. Length of Protection
Riprap, when used as an outlet velocity control measure, shall be applied to the channel area immediately downstream of the culvert outlet for a length, Lp, determined using one of the following formula(s):
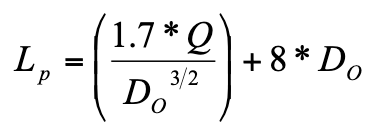 if culvert is flowing < half full (Equation CB-8)
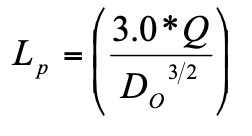 if culvert is flowing ≥ half full (Equation CB-9)
where:
Lp= Length of protection (length of riprap apron) (ft)
Q = Design discharge (ft3/sec)
DO = Maximum inside culvert width (ft) (use diameter for circular culverts)
In no instance shall Lp be less than 3*DO nor does Lp need to be greater than 20*DO.
6.2.4.3. Width of Protection
Where there is a well-defined channel downstream of the apron, the bottom width of the apron should be at least equal to the bottom width of the channel. Where no well-defined channel exists immediately downstream of the outlet area, the outlet protection width, W, shall be determined using the following formula(s):
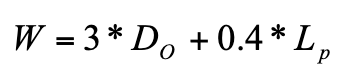 if TW ≥ elevation of center of culvert (Equation CB-10)
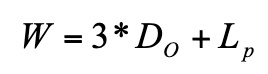 if TW< elevation of center of culvert (Equation CB-11)
where:
W = Width of outlet protection (width of riprap apron) (ft)
Lp= Length of protection (length of riprap apron) (ft)
DO = Maximum inside culvert width (ft) (use diameter for circular culverts)
In no instance shall W be less than 3*DO. See Figure CB-13 for additional details on outlets that don’t have a well-defined channel downstream.
6.2.4.3. Thickness and Stone Size/Gradation
The riprap blanket thickness shall be at a minimum two-times (2x) d50 for the initial half of Lp immediately after the culvert discharge and at least one-and-a-half-times (1.5x) d50 for the final half of Lp. Furthermore, the riprap blanket shall extend up the side slopes at least 1-foot above the design tailwater elevation, but no lower than two-thirds of the vertical culvert dimension above the culvert invert. The riprap thickness on the side slopes shall be at least one-and-a-half-times (1.5x) d50. A geotextile fabric or stone filter (as outlined in Section 3.4 – Riprap-Lined Channels in Chapter 6 – Open Channel Flow Design) must be placed under the riprap to prevent undermining of the soil beneath the riprap layer. See Figure CB-14 for additional details on riprap extents.
The median stone diameter, d50, shall be based on the following equation:
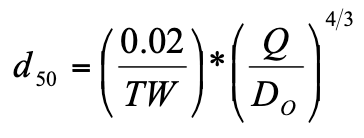 (Equation CB-12)
where:
d50= Median stone size (ft)
TW = Tailwater depth above culvert invert (ft), in areas where TW cannot be computed, use TW=0.20*DO
Q = Design discharge (ft3/sec)
DO = Maximum inside culvert width (ft) (use diameter for circular culverts)
Where required riprap size calculated from Equation CB-12 exceeds those as defined in Table OC-10 of Chapter 6 of this Manual, alternate energy dissipation / erosion control devices shall be used such as stilling basins, baffle chutes, streambed level dissipators, drop structures, etc. (see HEC-14).
Figure CB-13 – Configuration of Conduit Outlet Protection for un-Defined Channel Downstream (NJDOT SESCS, 2008)
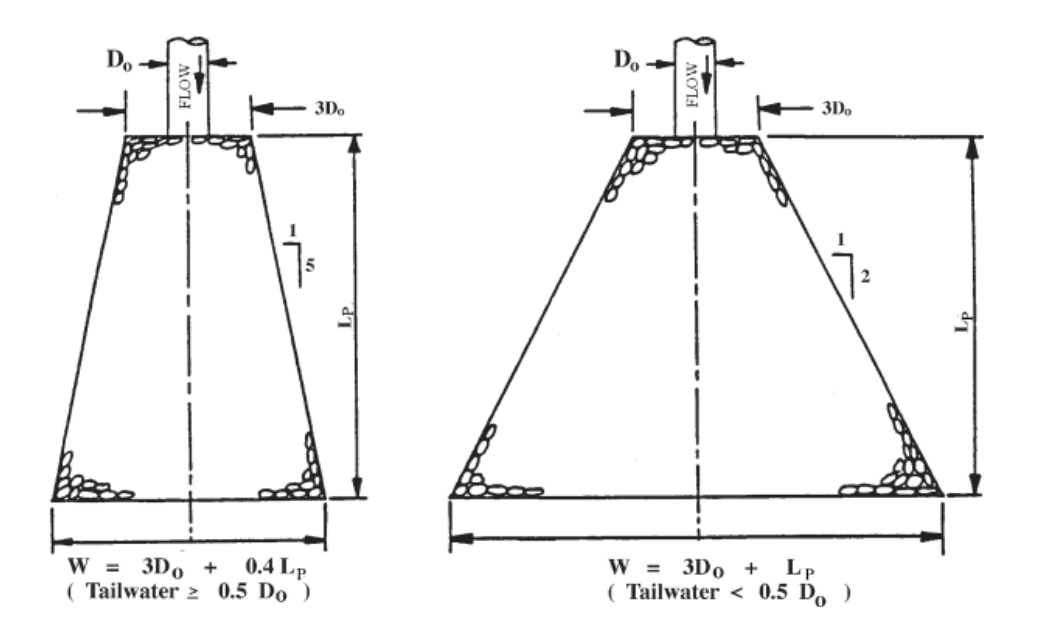
Figure CB-14 – Culvert and Pipe Outlet Erosion Protection
(UDFCD USDCM 2002)
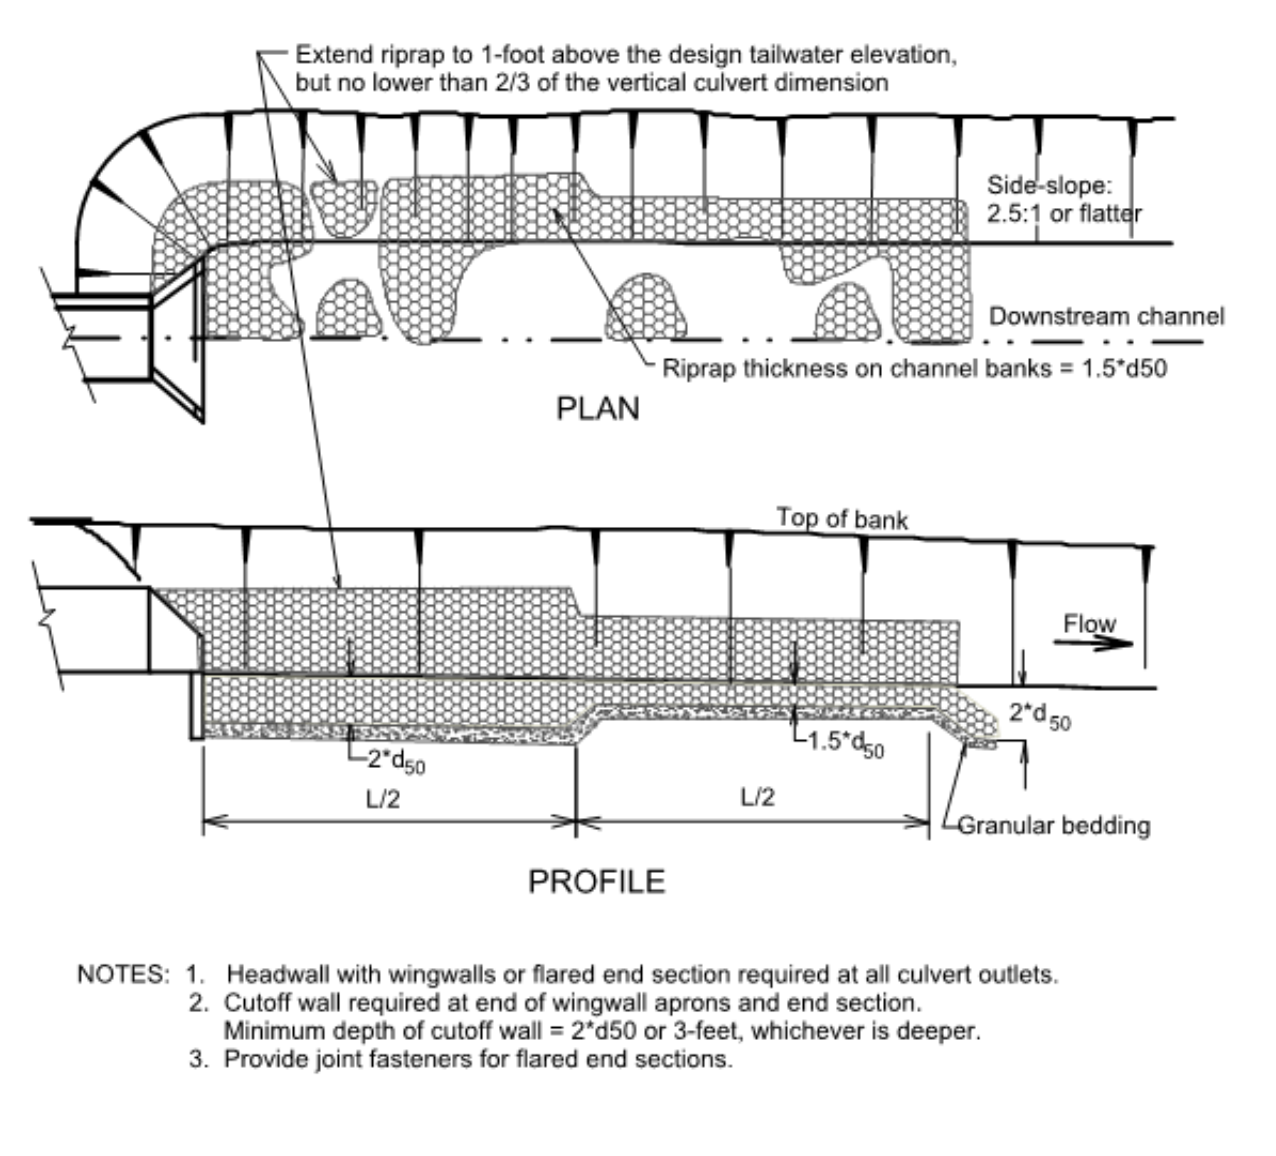
6.2.4.4. Multiple Culverts Outlets
When more than one culvert outlet exists at the same location, use the guidelines below to size the riprap protection apron. See Figure CB-15 for additional information.
- When the spacing between the culverts is less than of the width of one culvert, the riprap size and apron dimensions for one culvert shall accommodate all culverts.
- When the spacing between the culverts is greater than the width of one culvert, the riprap size and apron dimensions shall be 25% larger than the dimensions for one culvert.
Figure CB-15 – Guidance for Outlet Protection for Multiple Culverts (NJDOT, SESCS 2008)
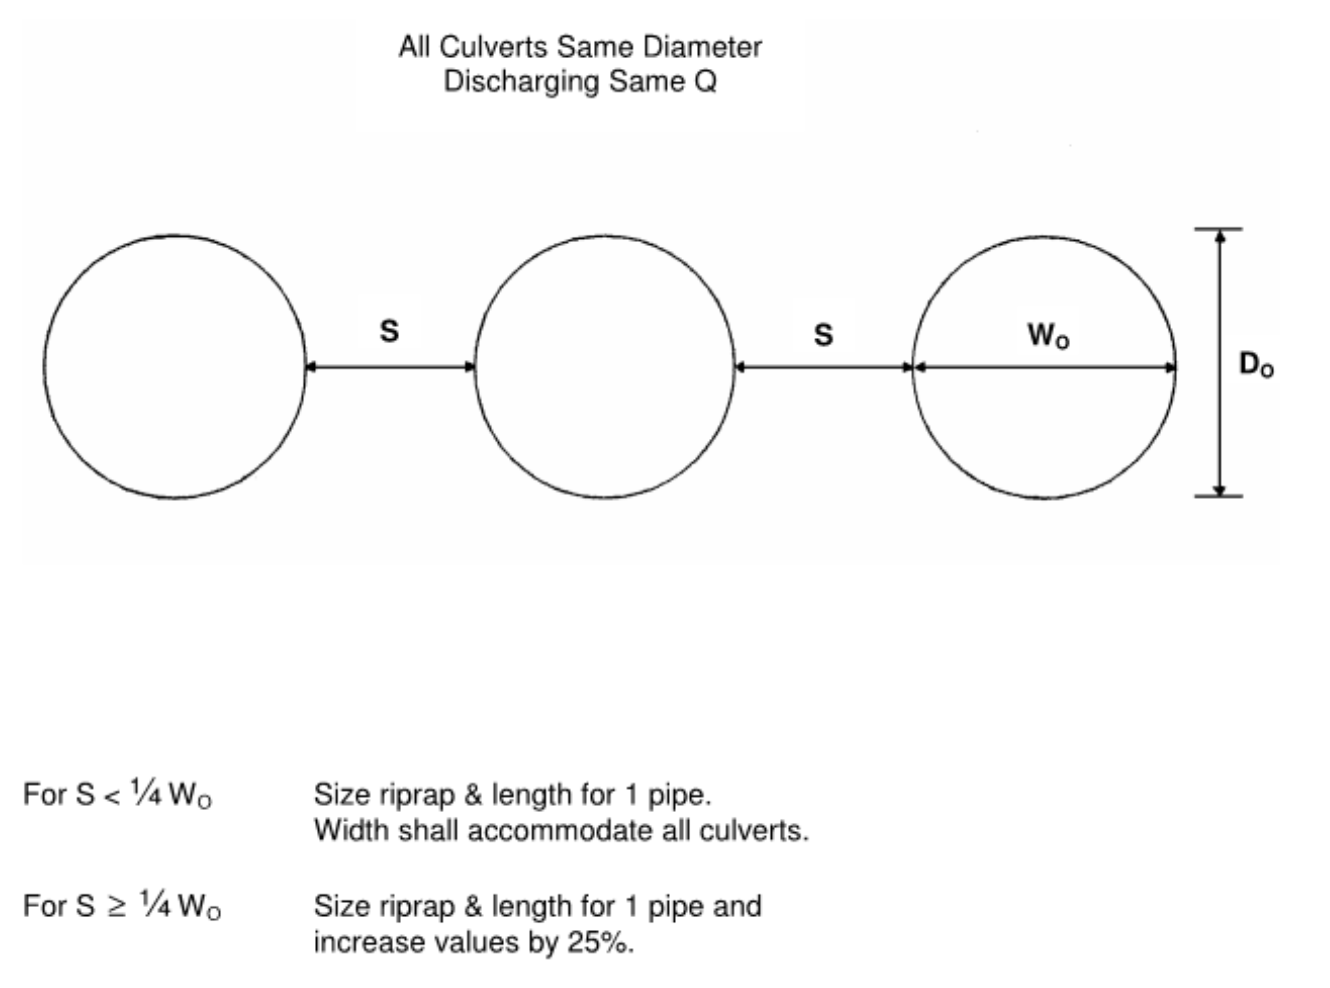
Figure CB-16 – Subcritical Flow Transition
(HEC-14, 2006)
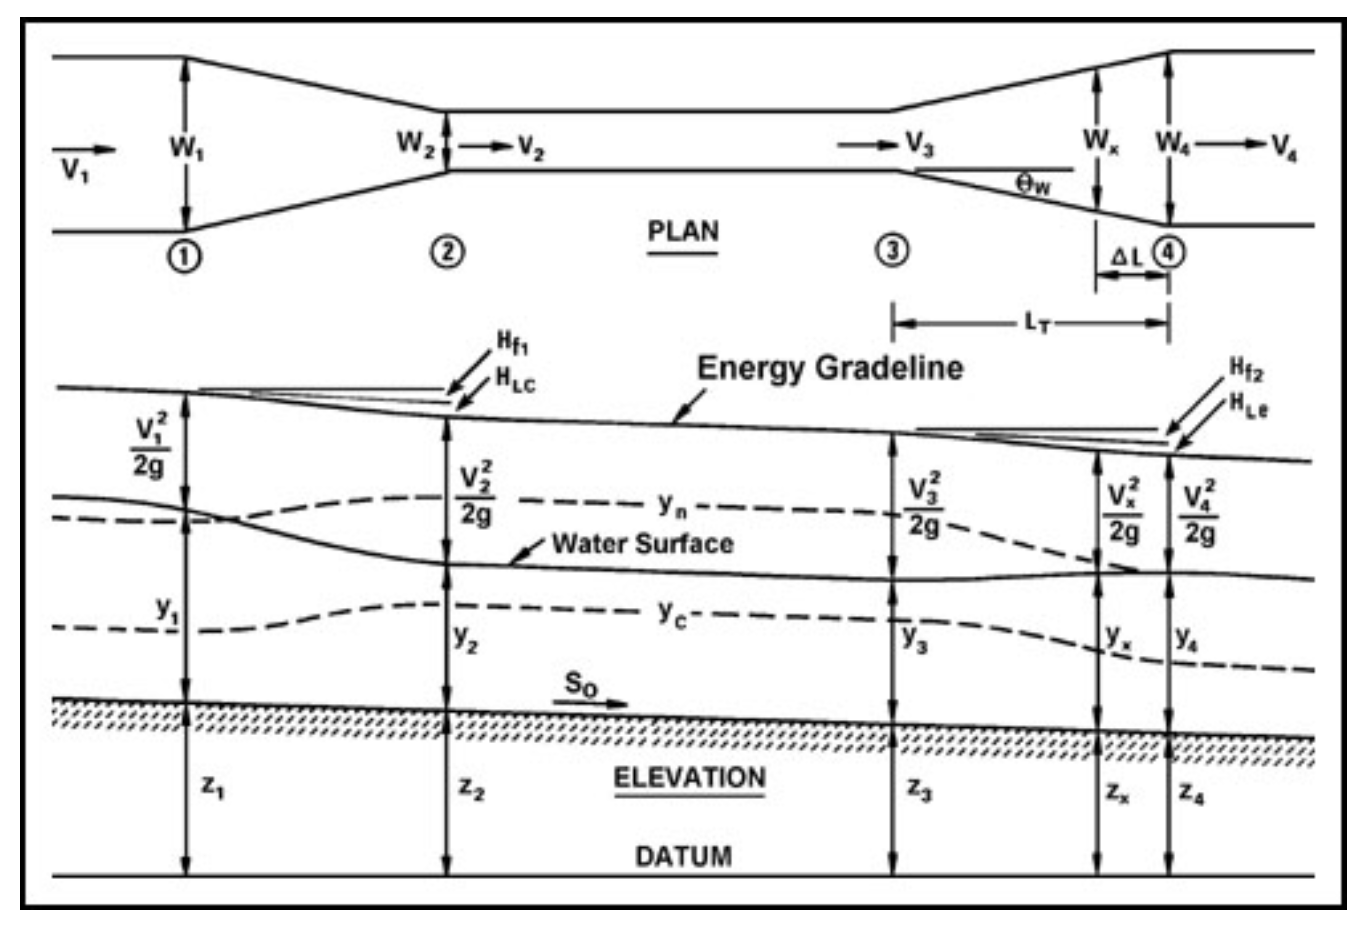
Table CB-6 – Maximum Heights of Fill Over RCP Culverts
(ARDOT, Standard Drawing PCC-1)
Installation Type | Class of Pipe | ||
|---|---|---|---|
| Class III | Class IV | Class V | |
| Feet | |||
Type 1 | 21 | 32 | 50 |
Type 2 | 17 | 27 | 41 |
Type 3 | 13 | 20 | 32 |
Note: If fill height exceeds 50 feet, a special design concrete pipe will be required using Type 1 Installation. | |||
Table CB-7 – Pipe Bedding Installation Types
(ARDOT, Standard Drawing PCC-1)
Installation Type | Material Requirements for Haunch and Structural Bedding |
|---|---|
Type 1 | Aggregate Base Course (Class 5 or Class 7) |
Type 2 | Selected Materials (Class SM-1, SM-2 or SM-3) or Type 1 Installation material |
Type 3 | AASHTO Classification A-1 thru A-6 Soil or Type 1 or 2 Installation material |
Note: Material listed in this table corresponds to the ARDOT Standard Specifications for Highway Construction, Latest Edition. Materials shall not include organic materials or stones larger than 3-inches. | |
8.2.1. Design Approach
The method of planning for bridge openings must include water surface profiles and hydraulic gradient analyses of the channel for the major storm runoff. Once this hydraulic gradient is established without the bridge, the maximum reasonable effect on the channel flow by the bridge should be determined. In urban cases this shall not exceed a backwater effect of more than 12 inches.
Velocities under the bridge and downstream of the bridge must receive consideration when choosing the size of the bridge opening. Velocities exceeding those permissible will necessitate special protection of the bottom and banks.
For supercritical flow, the clear bridge opening shall permit the flow to pass under the bridge unimpeded and unchanged in cross section.
8.2.2. Bridge Opening Freeboard
The distance between the design flow water surface and the bottom of the low steel / low chord of the bridge will vary from case to case. However, the debris that may be expected must receive full consideration in setting the freeboard. The minimum allowable freeboard for an arterial/critical service bridge or local/collector bridge is 1-foot for a 100-year and 50-year design storm, respectively. In no case shall any local/collector bridge overtop in the 100-year event no matter the allowable freeboard. Any ARDOT requirements for freeboard shall be adhered to on all state and interstate highways. Refer to ARDOT’s freeboard policy in its Roadway Design Drainage Manual at http://www.arkansashighways.com/.
8.3.1. Backwater
Backwater is the increment of increased flood depth upstream of a roadway crossing over a waterway. Backwater should not be used as the sole criterion for judging the acceptability of an alternative design. It is, instead, an aid that can be used in selecting the waterway opening, the crossing profile, and to assess the risk costs of incremental flooding caused by the crossing facility.
8.3.2. Expression for Backwater
A practical expression for backwater has been formulated by applying the principle of conservation of energy between the point of maximum backwater upstream from the bridge and a point downstream from the bridge at which normal stage has been reestablished, as shown in Sections 1 and 4, respectively, of Figure CB-17. The expression is reasonably valid if the channel in the vicinity of the bridge is reasonably uniform, the gradient of the bottom is approximately constant between Sections 1 and 4, there is no appreciable erosion of the bed in the constriction due to scour, and the flow is subcritical.
Figure CB-17 – Normal Bridge Crossing Designation
(FHWA HDS-1, 1978)
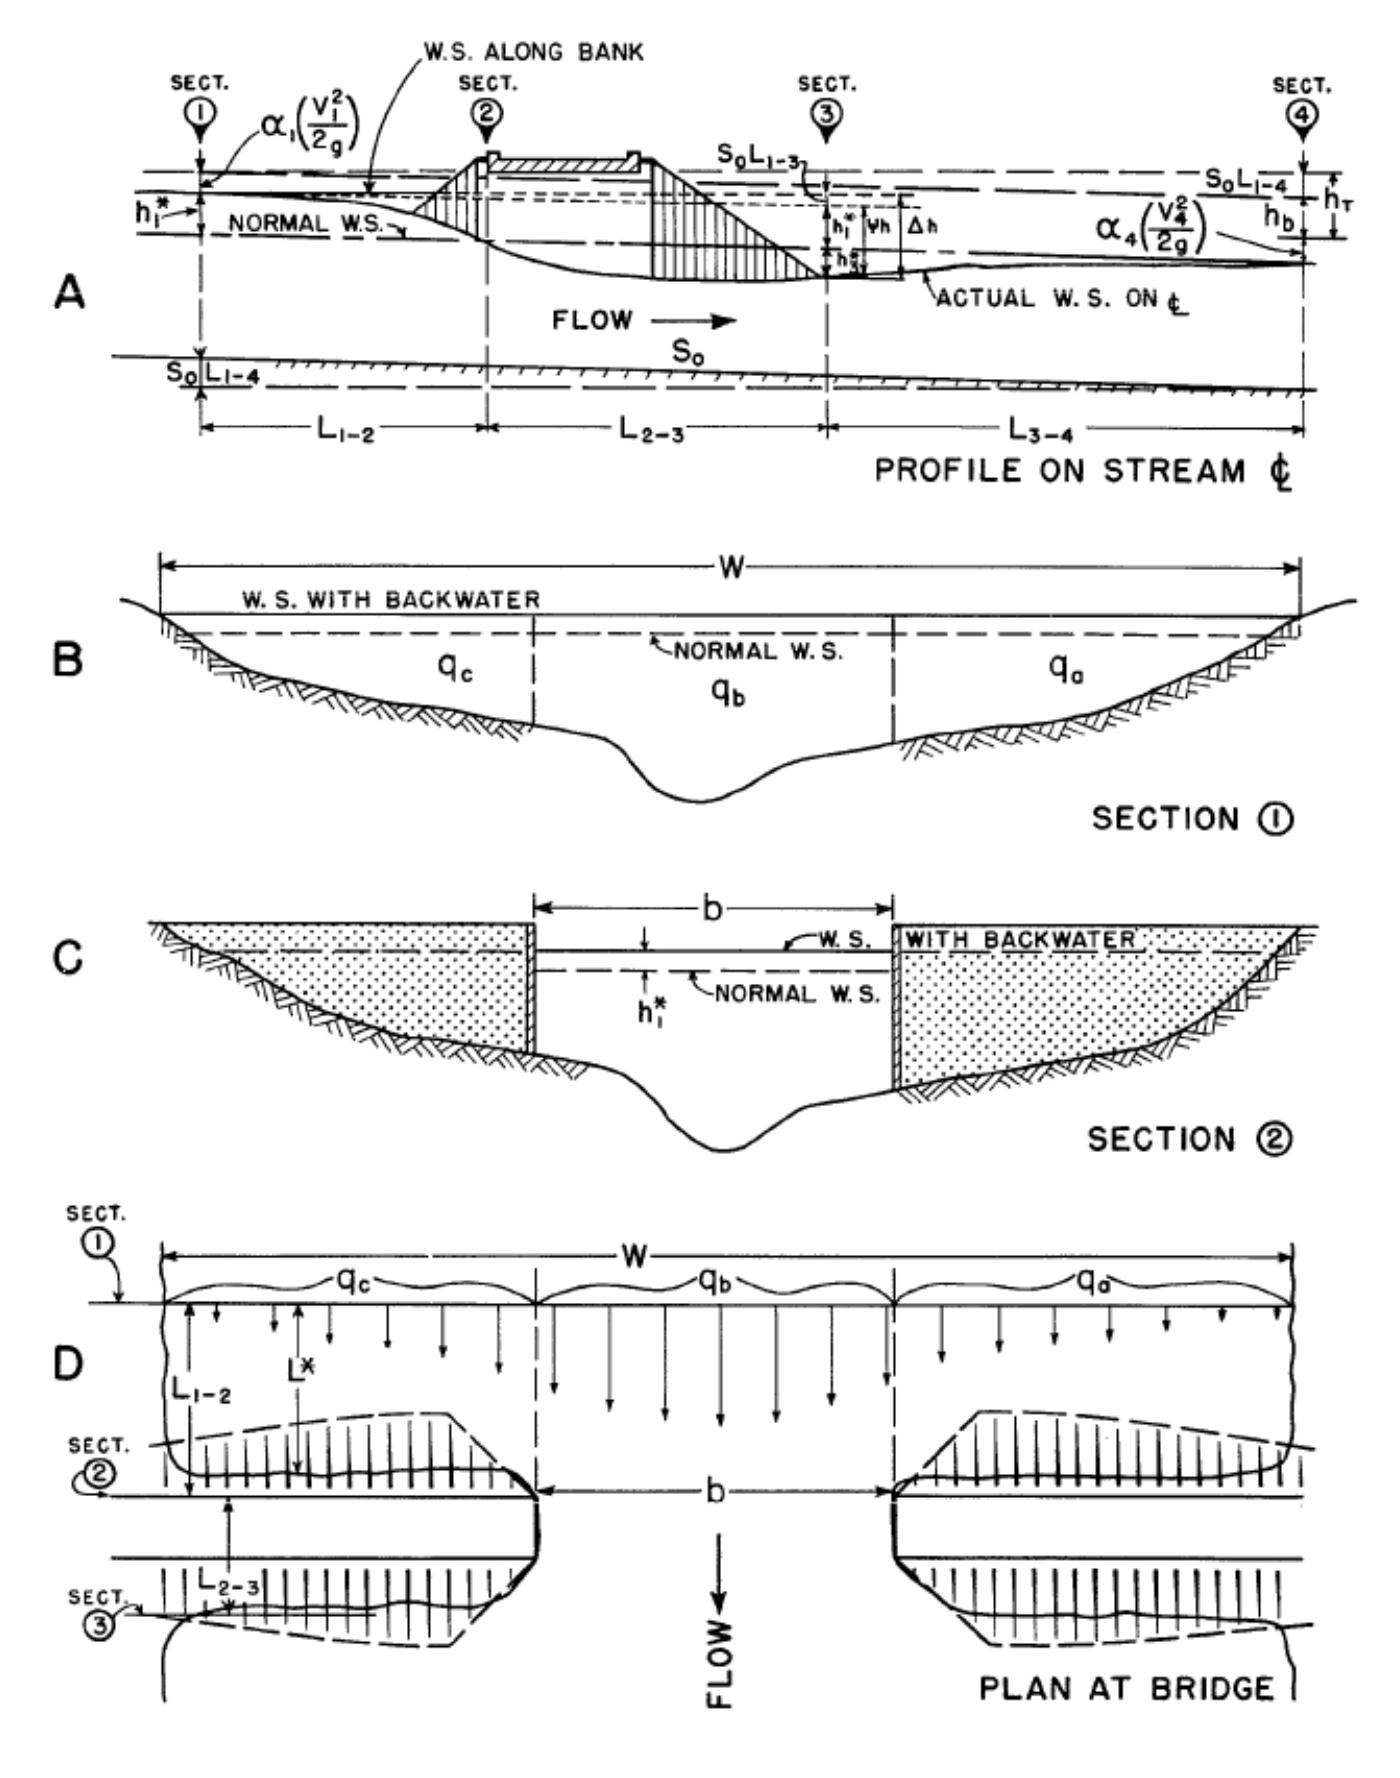
The expression for computation of backwater upstream from a bridge constricting the flow is as follows:
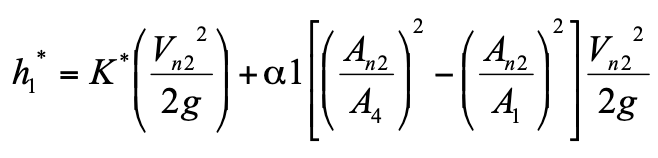 (Equation CB-13)
in which:
h1* = Total backwater (ft)
K* = Total backwater coefficient
α1 = Kinetic energy coefficient
An2 = Gross water area in constriction measured below normal stage (ft2)
Vn2= Average velocity in constriction or Q/An2 (ft/sec). The velocity Vn2 is not an actual measurable velocity but represents a reference velocity readily computed for both model and field structures.
A4 = Water area at Section 4 where normal stage is reestablished (ft2)
A1 = Total water area at Section 1 including that produced by the backwater (ft2)
g = Acceleration of gravity (32.2 ft/sec2)
To compute backwater by Equation CB-13, it is necessary to obtain the approximate value of h1* by using the first part of the equation:
 (Equation CB-14)
The value of A1 in the second part of Equation CB-13, which depends on h1* can then be determined. This part of the expression represents the difference in kinetic energy between Sections 4 and 1, expressed in terms of the velocity head Vn22/2g. Equation CB-14 may appear cumbersome, but it was set up as shown to permit omission of the second part when the difference in kinetic energy between Sections 4 and 1 is small enough to be insignificant in the final result.
To permit the designer to readily recognize cases in which the kinetic energy term may be ignored, the following guides are provided:
M > 0.7, where M = bridge opening ratio = b/W (Figure CB-17)
Vn2 < 7 ft/sec
 < 0.5 ft
If values meet all three conditions, the backwater obtained from Equation CB-14 can be considered sufficiently accurate. Should one or more of the values not meet the conditions set forth, it is advisable to use Equation CB-13 in its entirety. The use of the guides is further demonstrated in the examples given in Hydraulics of Bridge Waterways (FHWA, HDS-1 1978) that should be used in all bridge design work.
8.3.3. Backwater Coefficient
The value of the overall backwater coefficient K*, which was determined experimentally, varies with:
- Stream constriction as measured by bridge opening ratio, M.
- Type of bridge abutment: wingwall, spill through, etc.
- Number, size, shape, and orientation of piers in the constriction.
- Eccentricity or asymmetric position of bridge with the floodplains.
- Skew (bridge crosses floodplain at other than 90 degree angle).
The overall backwater coefficient K* consists of a base curve coefficient, Kb, to which are added incremental coefficients to account for the effect of piers, eccentricity, and skew. The value of K* is primarily dependent on the degree of constriction of the flow but also changes to a limited degree with the other factors.
8.3.4. Effect of M and Abutment Shape (Base Curves)
Figure CB-18 shows the base curve for backwater coefficient, Kb, plotted with respect to the opening ratio, M, for several wingwall abutments and a vertical wall type. Note how the coefficient Kb increases with channel constriction. The several curves represent different angles of wingwalls as can be identified by the accompanying sketches; the lower curves represent the better hydraulic shapes.
Figure CB-18 shows the relation between the backwater coefficient, Kb, and M for spill-through abutments for three embankment slopes. A comparison of the three curves indicates that the coefficient is little affected by embankment slope. Figures CB-18 and CB-19 are “base curves” and Kb is referred to as the “base curve coefficient.” The base curve coefficients apply to normal crossings for specific abutment shapes but do not include the effect of piers, eccentricity, or skew.
8.3.5. Effect of Piers (Normal Crossings)
The effect on the backwater from introduction of piers in a bridge constriction has been treated as an incremental backwater coefficient designated ∆Kp, which is added to the base curve coefficient when piers are a factor. The value of the incremental backwater coefficient, ΔKp, is dependent on the ratio that the area of the piers bears to the gross area of the bridge opening, the type of piers (or piling in the case of pile bents), the value of the bridge opening ratio, M, and the angularity of the piers with the direction of flood flow. The ratio of the water area occupied by piers, Ap, to the gross water area of the constriction, An2, both based on the normal water surface, has been assigned the letter J. In computing the gross water area, An2, the presence of piers in the constriction is ignored. The incremental backwater coefficient for the more common types of piers and pile bents can be obtained from Figure CB-20. The procedure is to enter Chart A, Figure CB-20, with the proper value of J and read ∆K and obtain the correction factor σ from Chart B, Figure CB-20, for opening ratios other than one (1.0). The incremental backwater coefficient is then
 (Equation CB-14)
The incremental backwater coefficients for piers can, for all practical purposes, be considered independent of diameter, width, or spacing but should be increased if there are more than 5 piers in a bent. A bent with 10 piers should be given a value of ΔKp about 20% higher than those shown for bents with 5 piles. If there is a good possibility of trash collecting on the piers, it is advisable to use a value greater than the pier width to include the trash. For a normal crossing with piers, the total backwater coefficient becomes:
K* = Kb (Figures CB-18 or CB-19) + ΔKp (Figure CB-20) (Equation CB-15)
8.3.6. Scour
A majority of bridge failures are the result of scour. The added cost of reducing a bridge’s vulnerability to damage from scour is small in comparison to the total cost of a bridge failure. As required by the AASHTO LRFD Bridge Design Specifications Article 3.7.5, scour at bridge foundations is investigated for two conditions.
The first condition is for the design flood for scour, the streambed material in the scour prism above the total scour line shall be assumed to have been removed for design conditions. The design flood storm surge, tide, or mixed population flood shall be the more severe of the 100-year events or from an overtopping flood of lesser recurrence interval.
The second condition is for the check flood for scour, the stability of bridge foundation shall be investigated for scour conditions resulting from a designated flood storm surge, tide, or mixed population flood not to exceed the 500-year event or from an overtopping flood of lesser recurrence interval. Excess reserve beyond that required for stability under this condition is not necessary. The extreme event limit state shall apply.
If the site conditions and low tailwater conditions near stream confluences dictate the use of a more severe flood event for either the design or the check flood for scour, the engineer may use such flood event.
For additional guidance and requirements, refer to the AASHTO LRFD Bridge Design Specifications.
Figure CB-18 – Base Curves for Wingwall Abutments
(UDFCD USDCM, 2001)
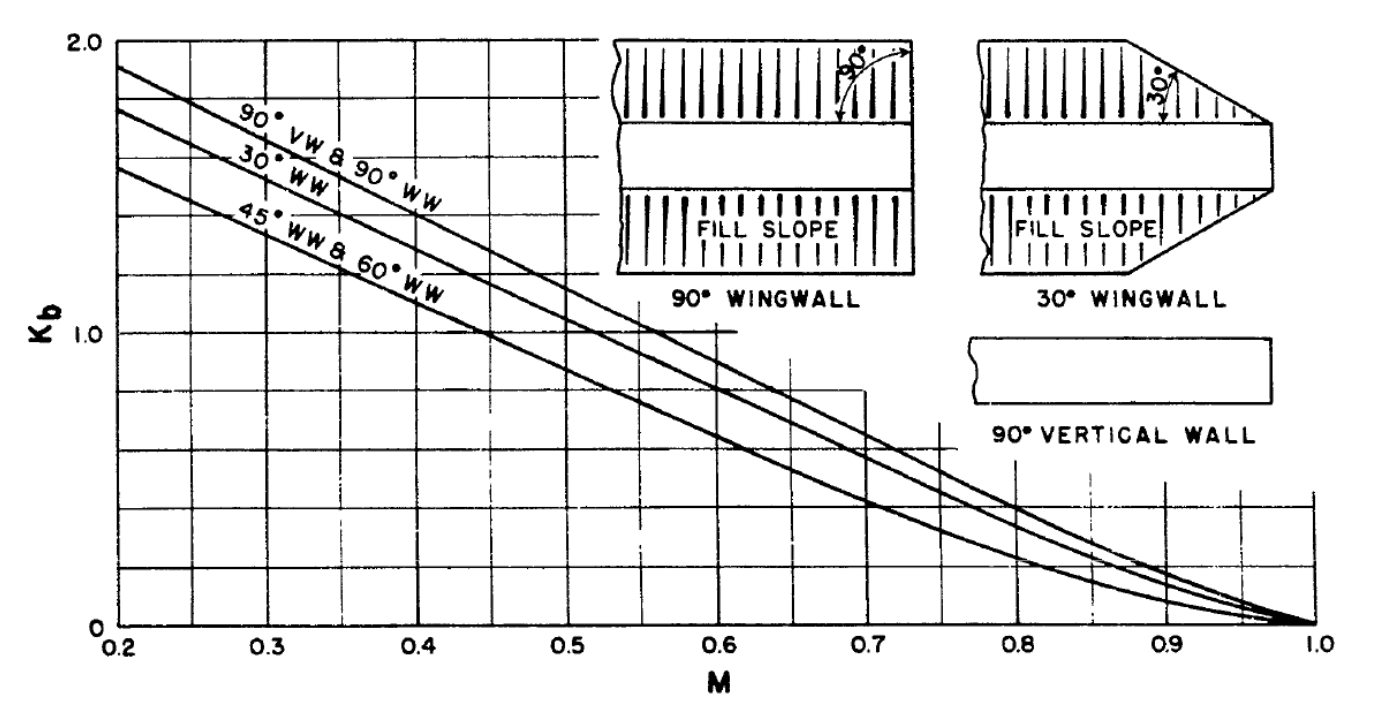
Figure CB-19 – Base Curves for Spillthrough Abutments
(UDFCD USDCM, 2001)
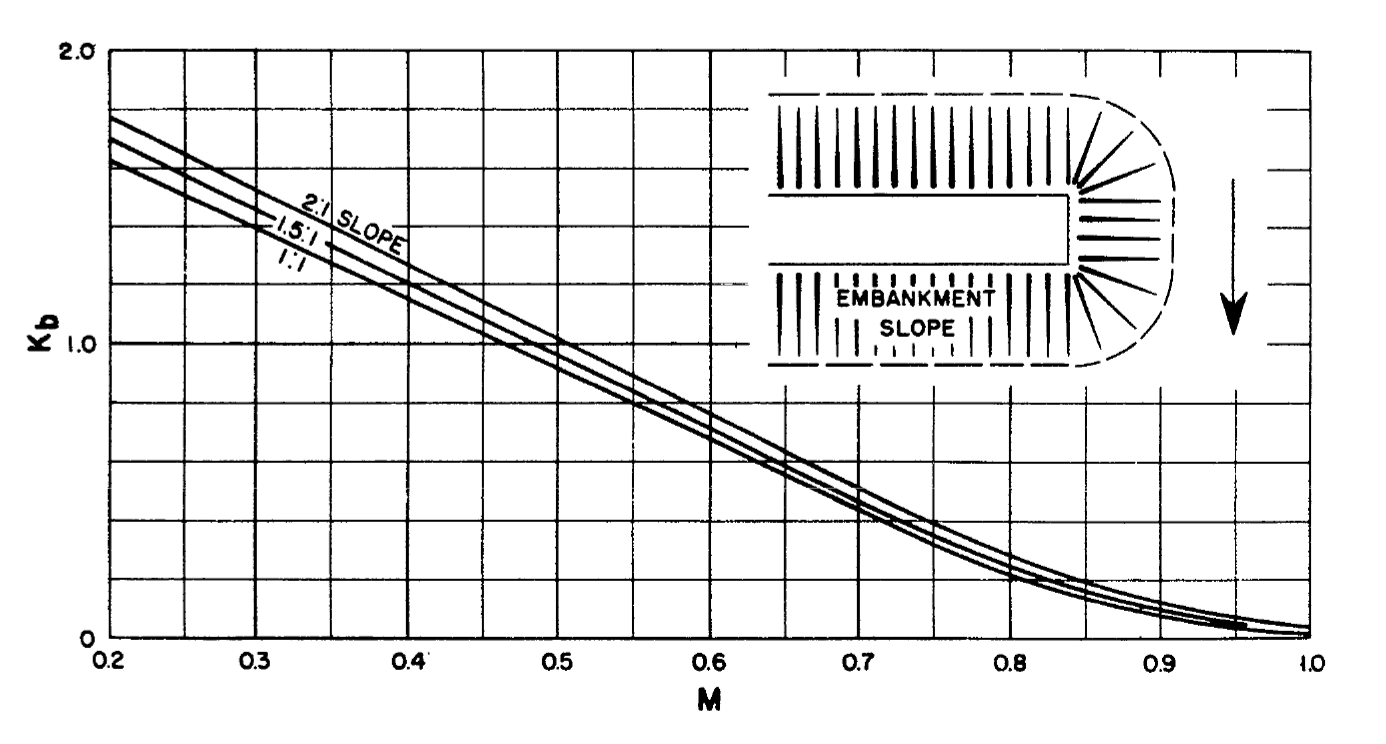
Figure CB-20 – Incremental Backwater Coefficient for Pier
(FHWA HDS-1, 1978)
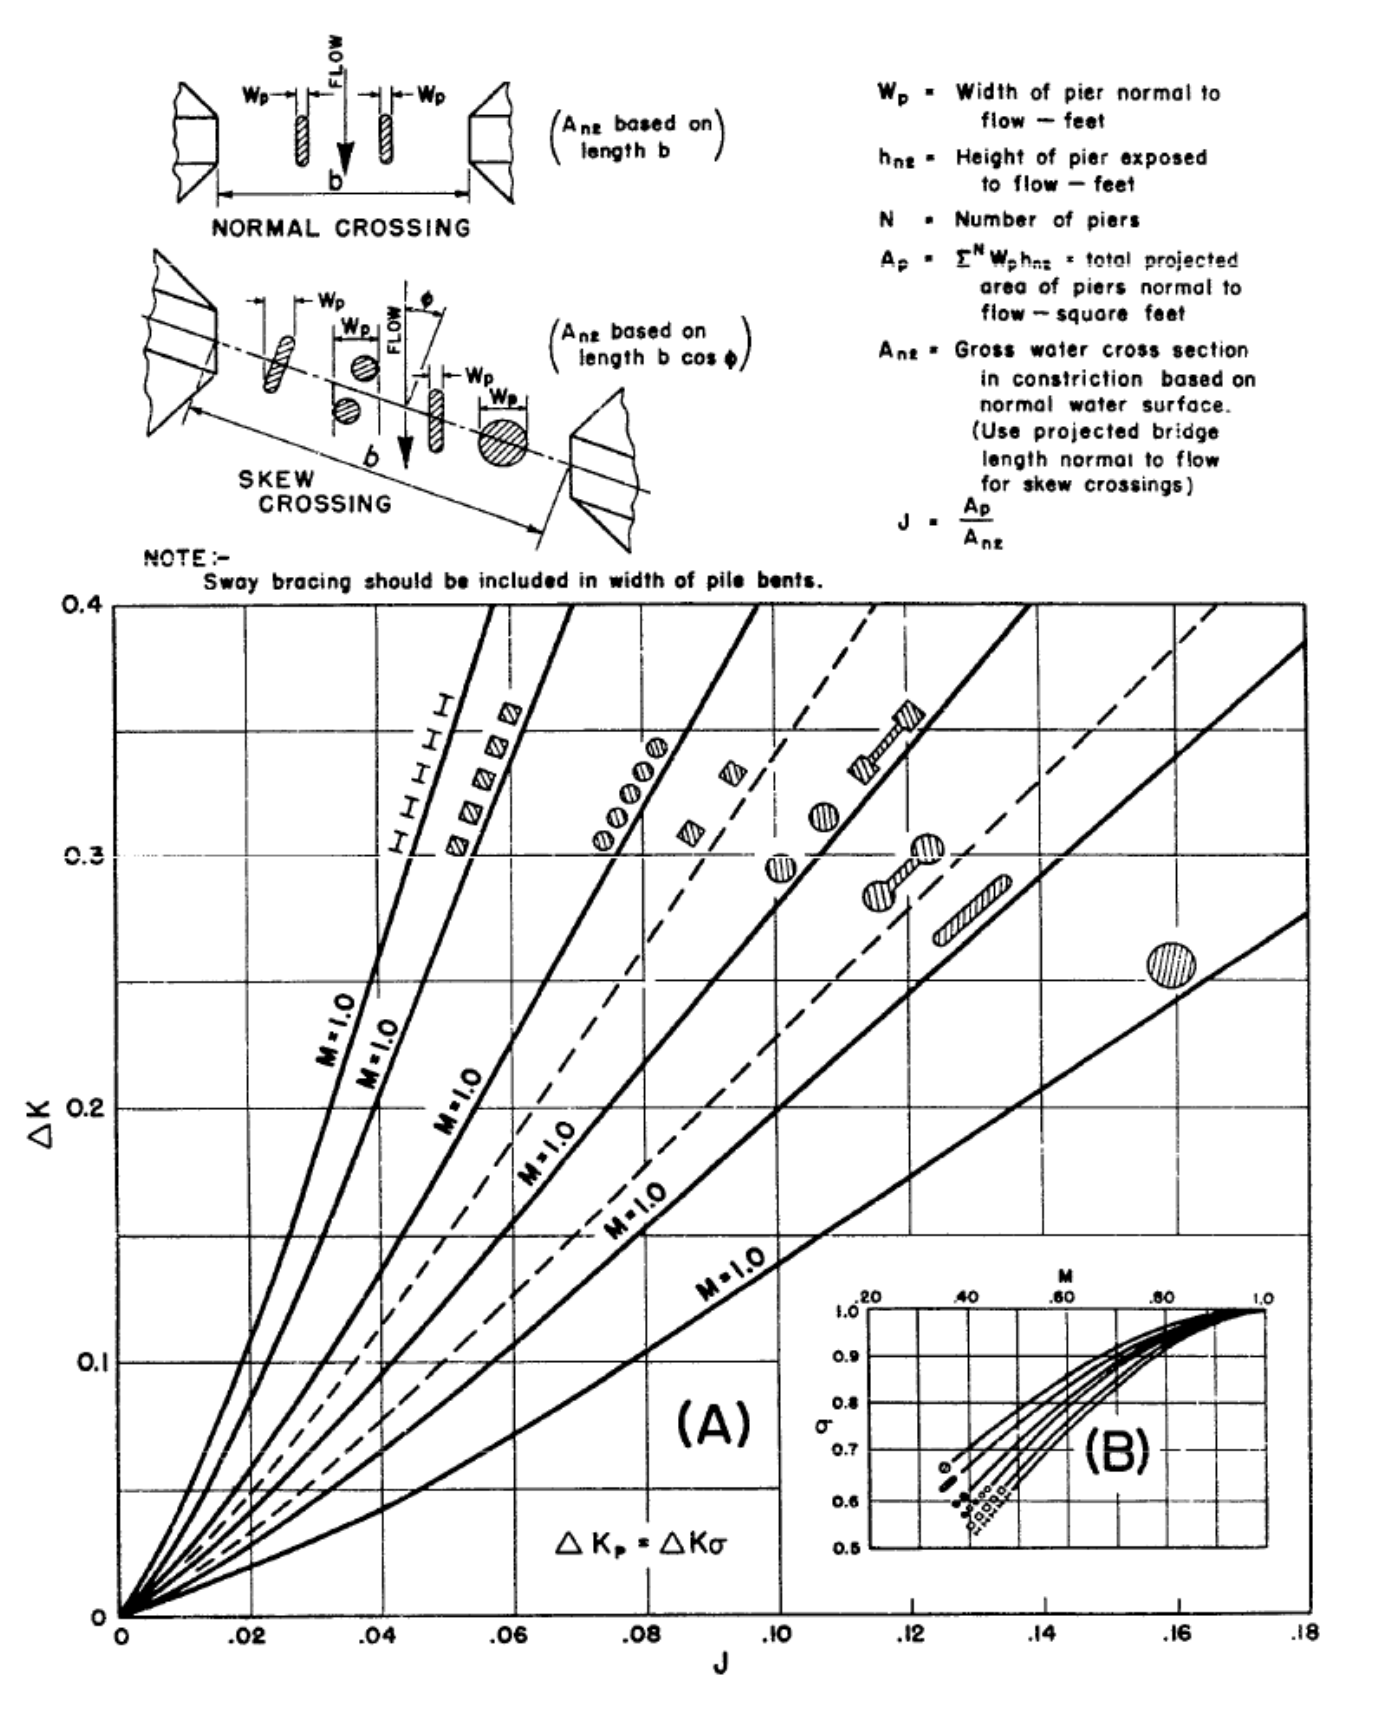
Step 1 Gather all crucial design information:
- Design discharge (Q) for desired events:
- Q5-yr = 20 cfs & Q100-yr = 35 cfs
- Culvert Length (L):
- L = 95.00’
- Invert elevations
- Inlet Invert = 5283.50’
- Outlet Invert = 5281.50’
- Calculate pipe slope
- Determine acceptable headwater and tailwater elevations:
- Headwater = 5288.50
- Tailwater5-yr = 5281.50’ + 2.50’ = 5284.00’
- Tailwater100-yr = 5281.50’ + 3.00’ = 5284.50’
Step 2 Select culvert shape and material:
- Pipe
- Concrete
- Manning’s n-value = 0.013
Step 3 Enter information into BC-Culvert Spreadsheet under the ‘Pipe’ tab leaving the Diameter (D) cell blank for the 5 year storm (Figure CB-16).
Step 4 Follow prompts given by spreadsheet to select an appropriate size of pipe.
- D = 24” Pipe
Step 5 Check headwater elevation by entering information into ‘Culvert’ tab.
- D = 24 inches
- Square End with Headwall
- 1 Barrel
- Inlet Invert Elevation = 5283.50’
- Culvert Slope = 0.0211 ft/ft
- L = 95.00’
- n = 0.012
- Kb = 0.00
- Kx = 1.00
- Tailwater Elevation = 5284.00’
- Start Headwater Elevation = 5285.00’ and increase by 0.25’
Step 6 Examine the results from the Calculations of Culvert Capacity (output) table.
Determine whether culvert is large enough based on the Controlling Culvert Flowrate (cfs) given the design discharge (Q) and maximum allowable headwater elevation. Make adjustments as needed to accommodate the design discharge and maximum allowable headwater elevation.
- @ Headwater = 5288.50’, Controlling Culvert Flowrate = 26.32 cfs
- 26.32 cfs > 20.00 cfs; therefore, proceed to next step
Step 7 Check the culvert size against additional design discharges (if multiple design storms are required) by repeating Steps 3 – 6.
Make adjustments to the culvert until it can handle all design discharges at or below the maximum allowable headwater elevation.
- In order for the culvert to handle 35 cfs from the 100 year storm, the pipe size must be increased to at least 28” (Figure CB-17).
Step 8 Develop multiple alternatives for analysis.
Step 9 Compute outlet velocities for each acceptable alternate.
Step 10 Make recommendations.
Figure CB-21 – BC-Culvert Spreadsheet Pipe Tab
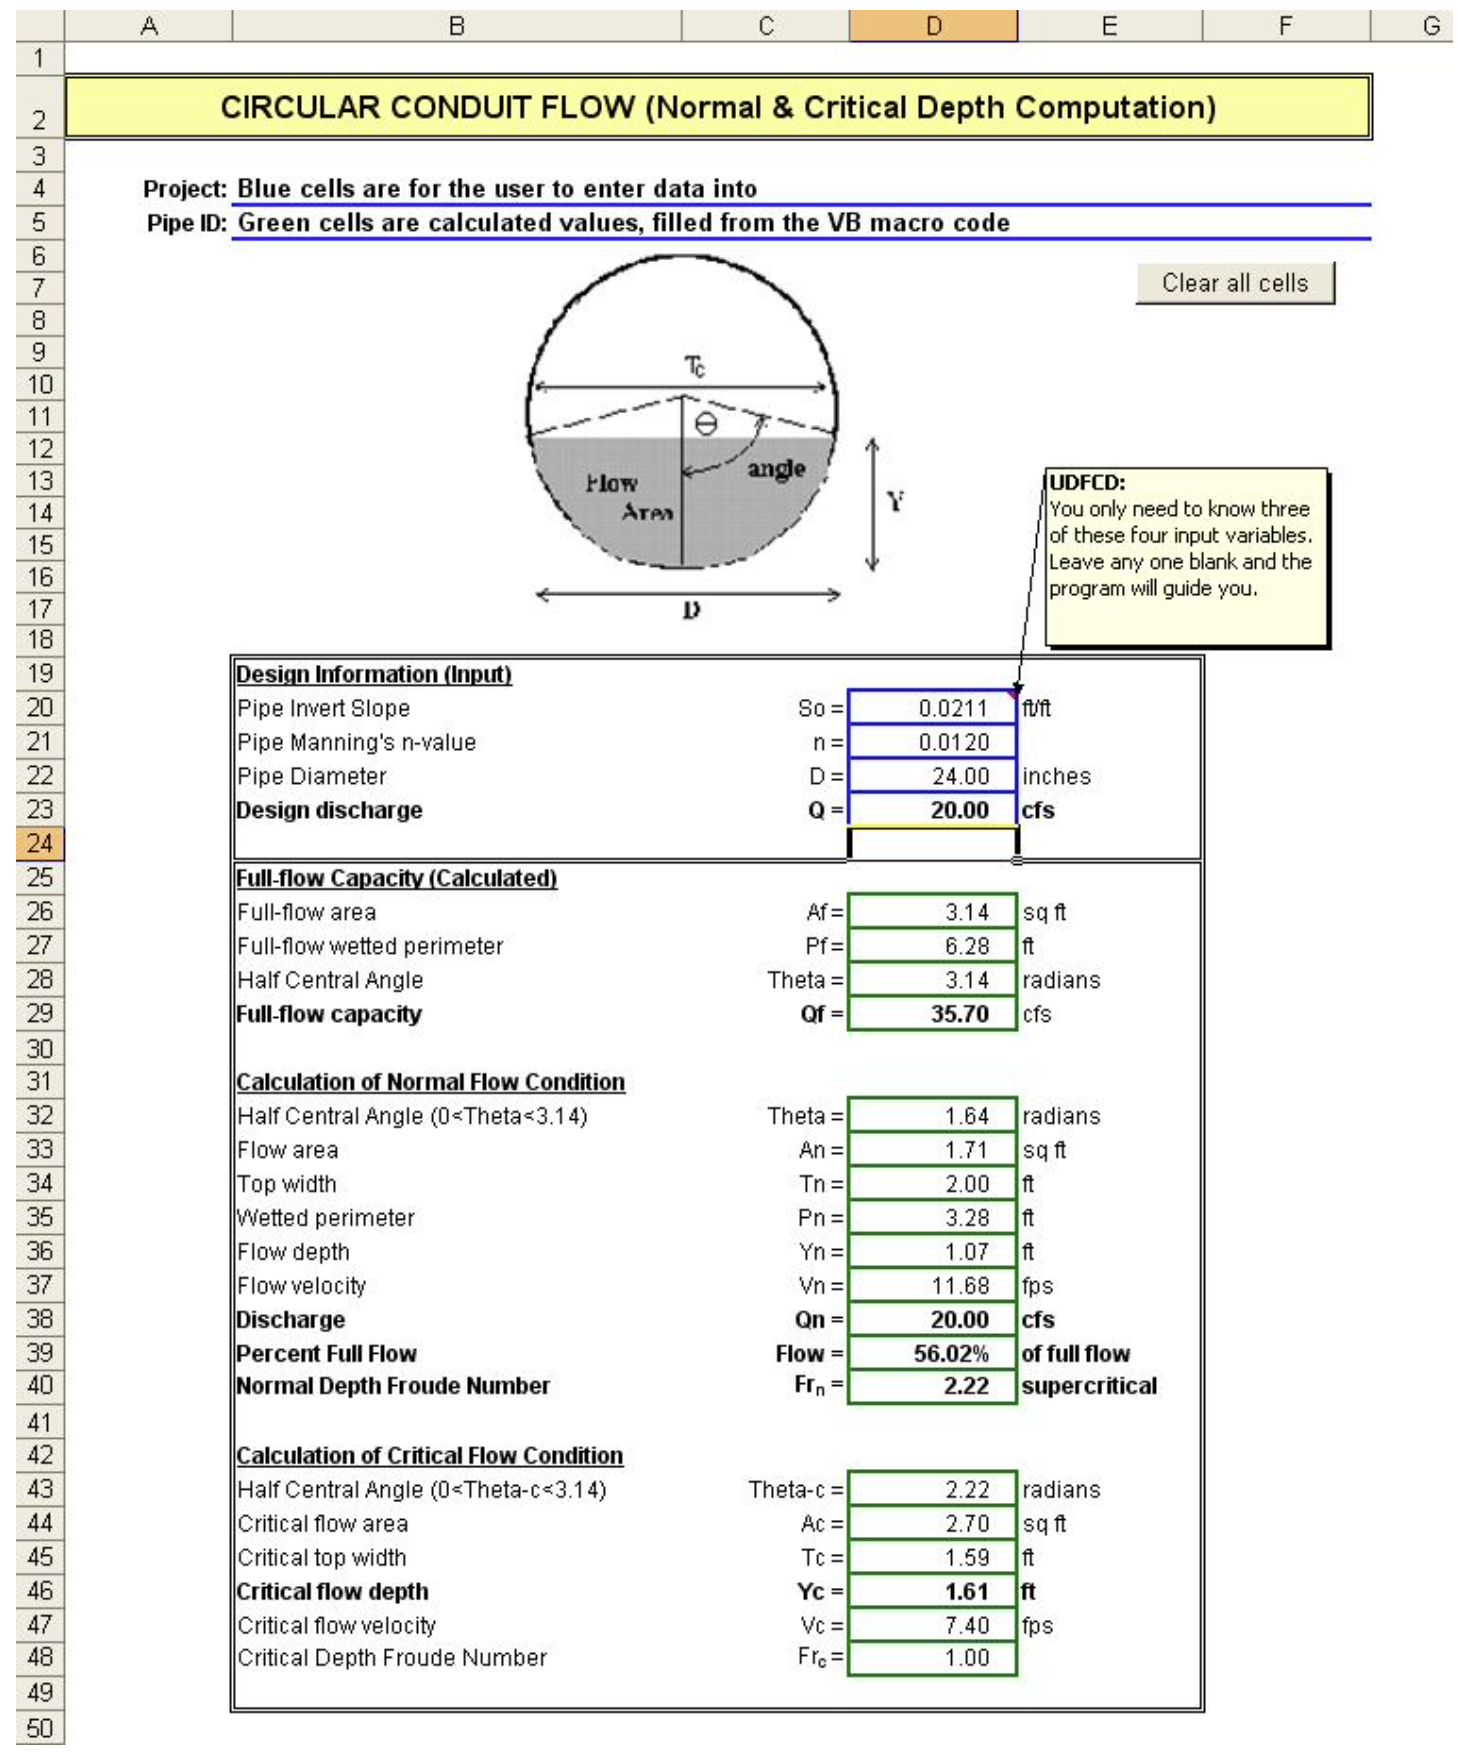
Figure CB-22 – BC-Culvert Spreadsheet Culvert Tab
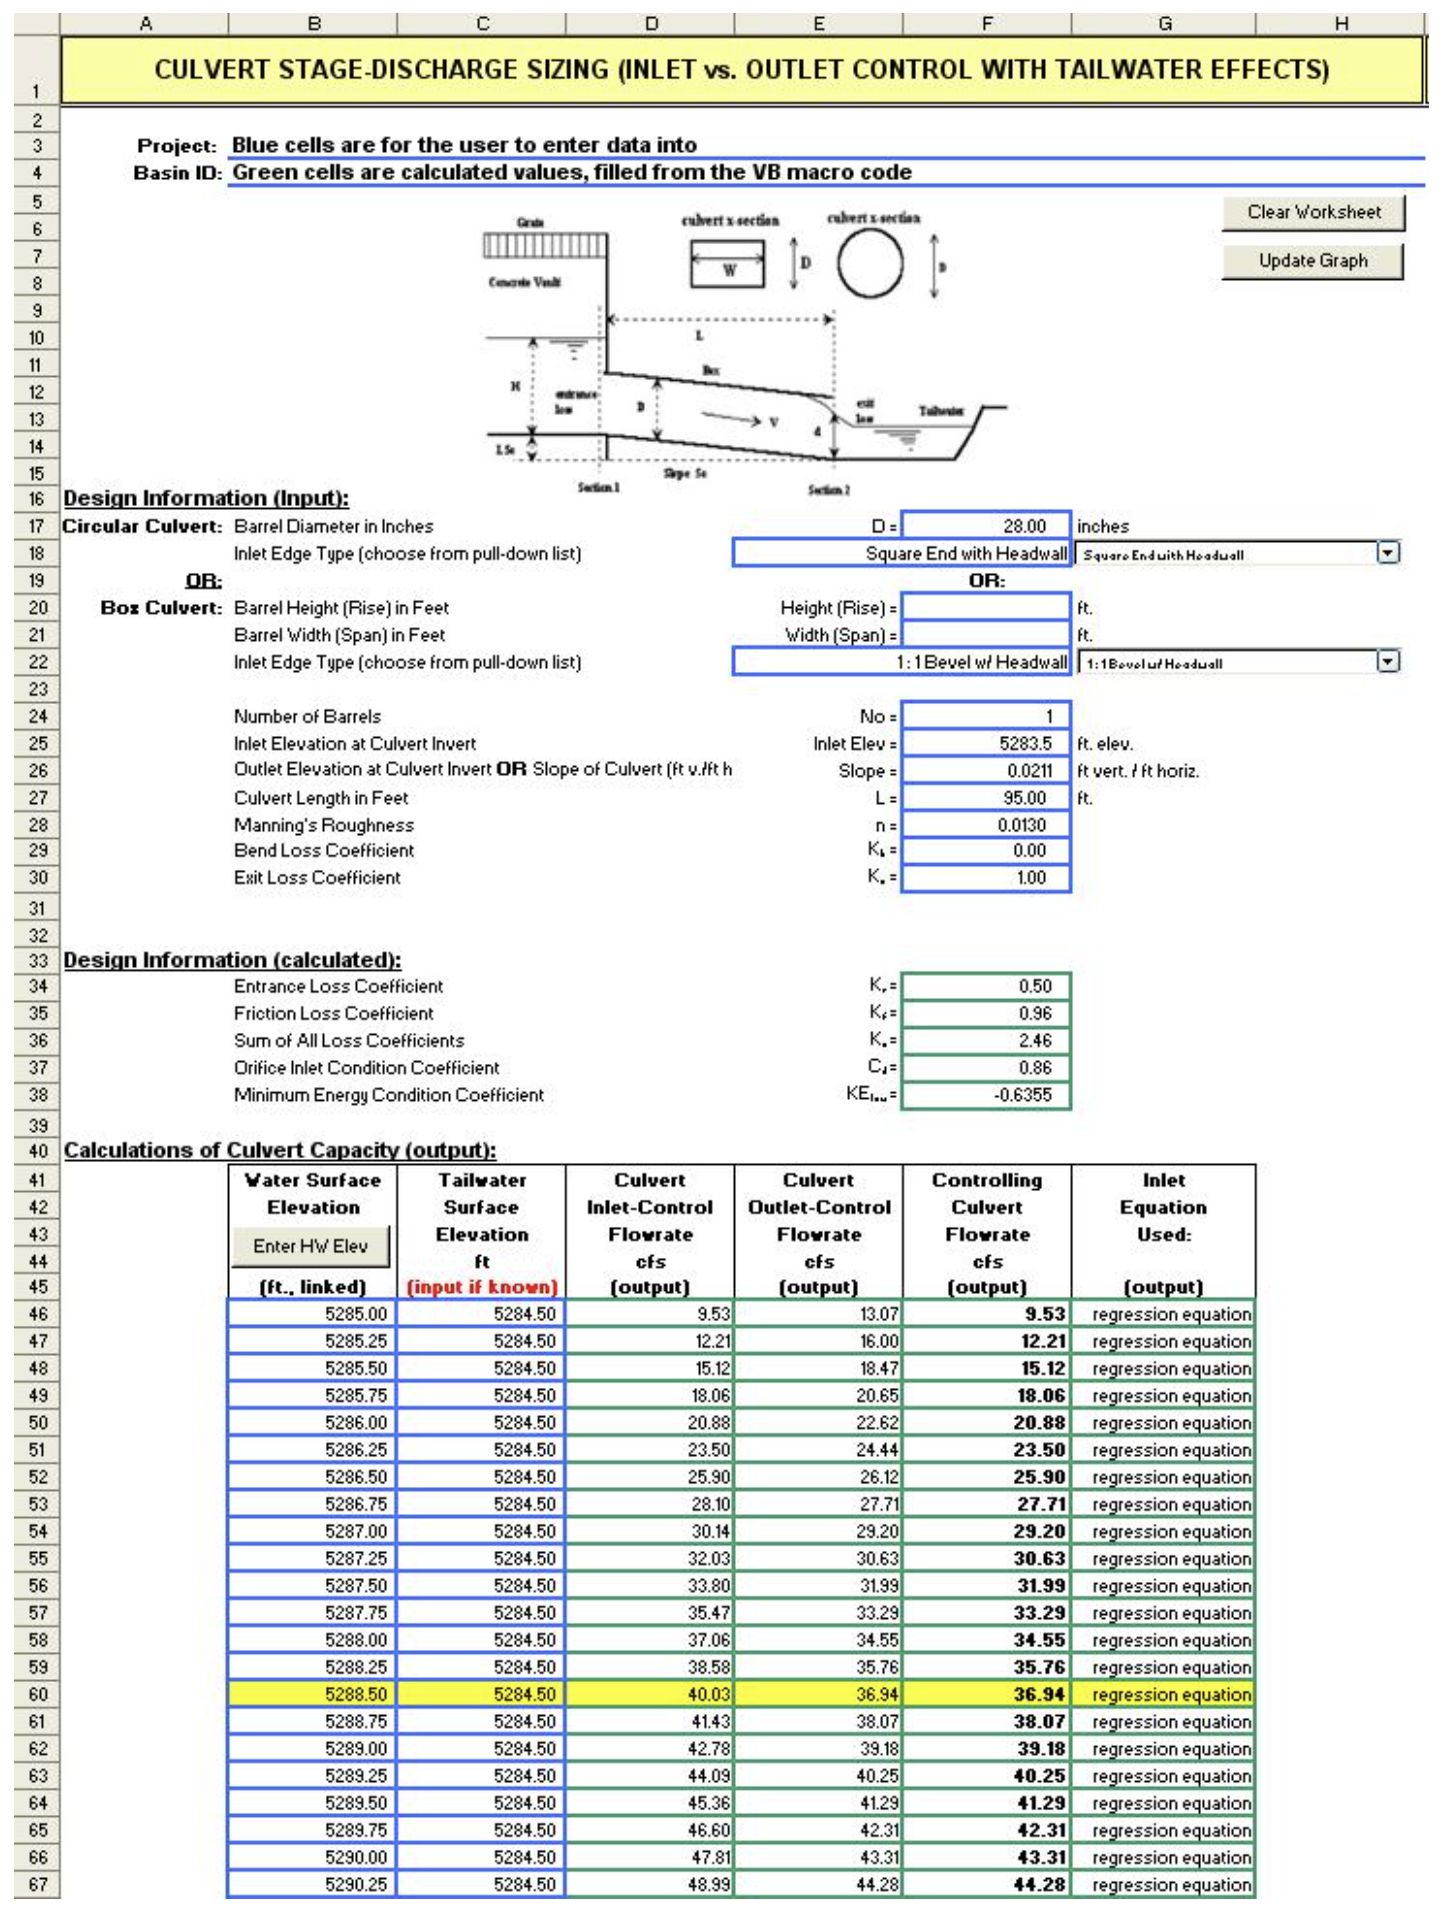
2.1.1 Erosion
Soil erosion is the process by which the land surface is worn away by the action of wind, water, ice and gravity. This section of the Manual addresses erosion caused by water and wind. The rate of soil erosion is increased greatly by many urban activities--especially construction activities. Any activity that disturbs the natural soil and vegetation increases the erosion potential since bare and loose soil is easily moved by wind or water.
Photograph CS-1 – Example of Erosion during Construction
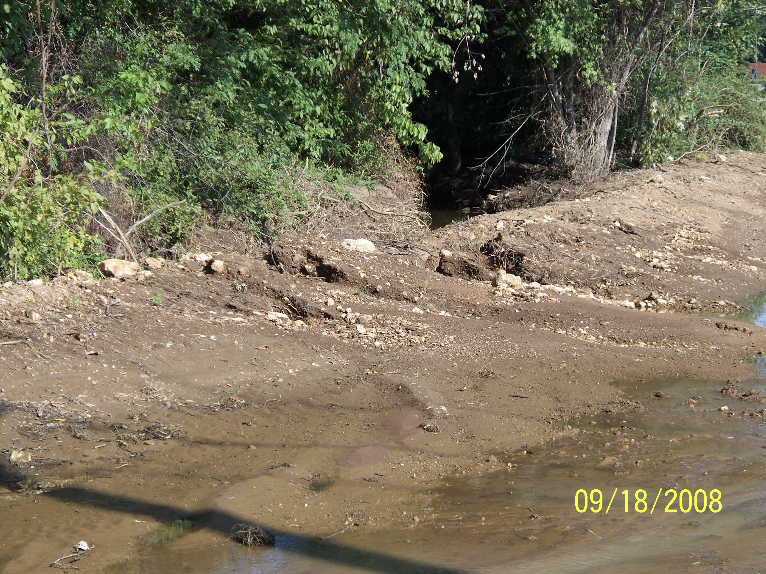
Wind erosion is caused when winds of sufficient velocity create movement of soil particles. The potential for wind erosion is dependent upon soil cover, soil particle size, wind velocity, duration of wind and unsheltered distance. Wind erosion can begin at a wind velocity as low as ten (10) mph, and can even result from turbulence created by passing vehicles.
Water erosion has five primary mechanisms: raindrop erosion, sheet erosion, rill erosion, gully erosion, and channel erosion. Raindrops detach soil particles and splash them into the air. These detached particles are then vulnerable to be carried off by stormwater runoff or snowmelt.
2.1.2 Sedimentation
During a typical rainstorm in urban areas, runoff normally builds up rapidly to a peak and then diminishes. The amount of sediment a watercourse can carry is dependent upon the velocity and volume of runoff. Sediment is deposited as runoff decreases. The deposited sediments may be resuspended when future runoff events occur. In this way, sediments are moved progressively downstream in the waterway system.
Windblown silt and sand particles are deposited whenever the force of the wind lessens. Much of the wind-eroded material is deposited behind fences, in landscaped areas or downwind of buildings or other obstructions to the wind. (Dust will form "drifts" just like snow.)
2.1.3 Factors Influencing Erosion
Physical properties of soils such as particle size, cohesiveness, and density affect its erodibility. Loose silt and sand-sized particles are more susceptible to erosion than "sticky" clay soils. Rocky soils are also less susceptible to wind erosion, but are often found on steep slopes that are subject to water erosion.
Vegetation plays an extremely important role in controlling erosion. Roots bind particles together and the leaves or blades of grass reduce raindrop impact forces on the soil. Grass, forest floor litter and other ground cover not only trap rain to promote infiltration but also reduce runoff velocity and shear stress at the surface. Vegetation reduces wind velocity at the ground surface, and provides a rougher surface which will trap particles moving along the ground. Once vegetation is removed, soils are no longer protected and erosion may increase.
When surface vegetative cover and soil structure are disturbed the soil's erodibility potential increases. Construction activities, such as excavating and grading, disrupt the soil structure and its vegetative cover.
2.3.1 Guidelines for SWPPP Development
The following guidelines are recommended in developing the SWPPP:
- Determine the limits of clearing and grading. If the entire site will not undergo excavation and grading, or excavation and grading will occur in stages, the boundaries of each cut-and-fill operation should be defined. Buffer strips of natural vegetation may be utilized as a control measure.
- Define the layout of buildings and roads.
- Determine permanent drainage features. The location of permanent channels and stormwater systems shall be defined. The SWPPP shall be consistent with the hydraulic features of the final drainage plan.
- Determine extent of temporary channel diversions. If improvements will be made to a permanent channel, the location, routing, sizing, lining, and type of temporary channel diversion should be determined.
- Determine the boundaries of watersheds. The size of drainage areas will determine the types of sediment controls to be used. Areas located off the site that contribute overland flow runoff must be assessed. Measures to limit the size of upland overland flow areas, such as diversion dikes, may be initially considered at this stage.
- Determine schedule of construction. The schedule of construction will determine what areas must be disturbed at various stages throughout the development plan. The opportunity for staging cut-and-fill operations to minimize the period of exposure of soils needs to be assessed and then incorporated into the final SWPPP.
- Select Erosion, Sediment, and Runoff Controls. All areas of exposed soil will require a control measure be defined dependent on the duration of exposure. Select the controls needed for each phase of the construction project based on the different demands.
- Identify locations of topsoil stockpiles. Areas for storing topsoil should be determined and then proper measures to control their erosion and sediment movement selected.
- Identify location of temporary construction roads, vehicle tracking controls, and material storage areas.
- Identify areas where stormwater could potentially be infiltrated onsite during construction. Onsite infiltration measures (such as detention ponds and grass swales) will reduce the runoff that will require treatment prior to leaving the site.
Figures CS-1 through CS-3 illustrate how the implementation of a SWPPP may be done in phases (for example, overlot grading phase, road and utility construction phase, major site revegetation phase, home building phase, and final acceptance phase). Each phase needs to address erosion, sediment, and runoff controls and the construction activities management for that phase of the construction activities. Each needs to take into account the specific physical layout and site conditions that will exist during that phase. Some projects may need to show multiple phases to have an effective overall SWPPP.
Figure CS-1 – Example of Phase 1 Erosion Control
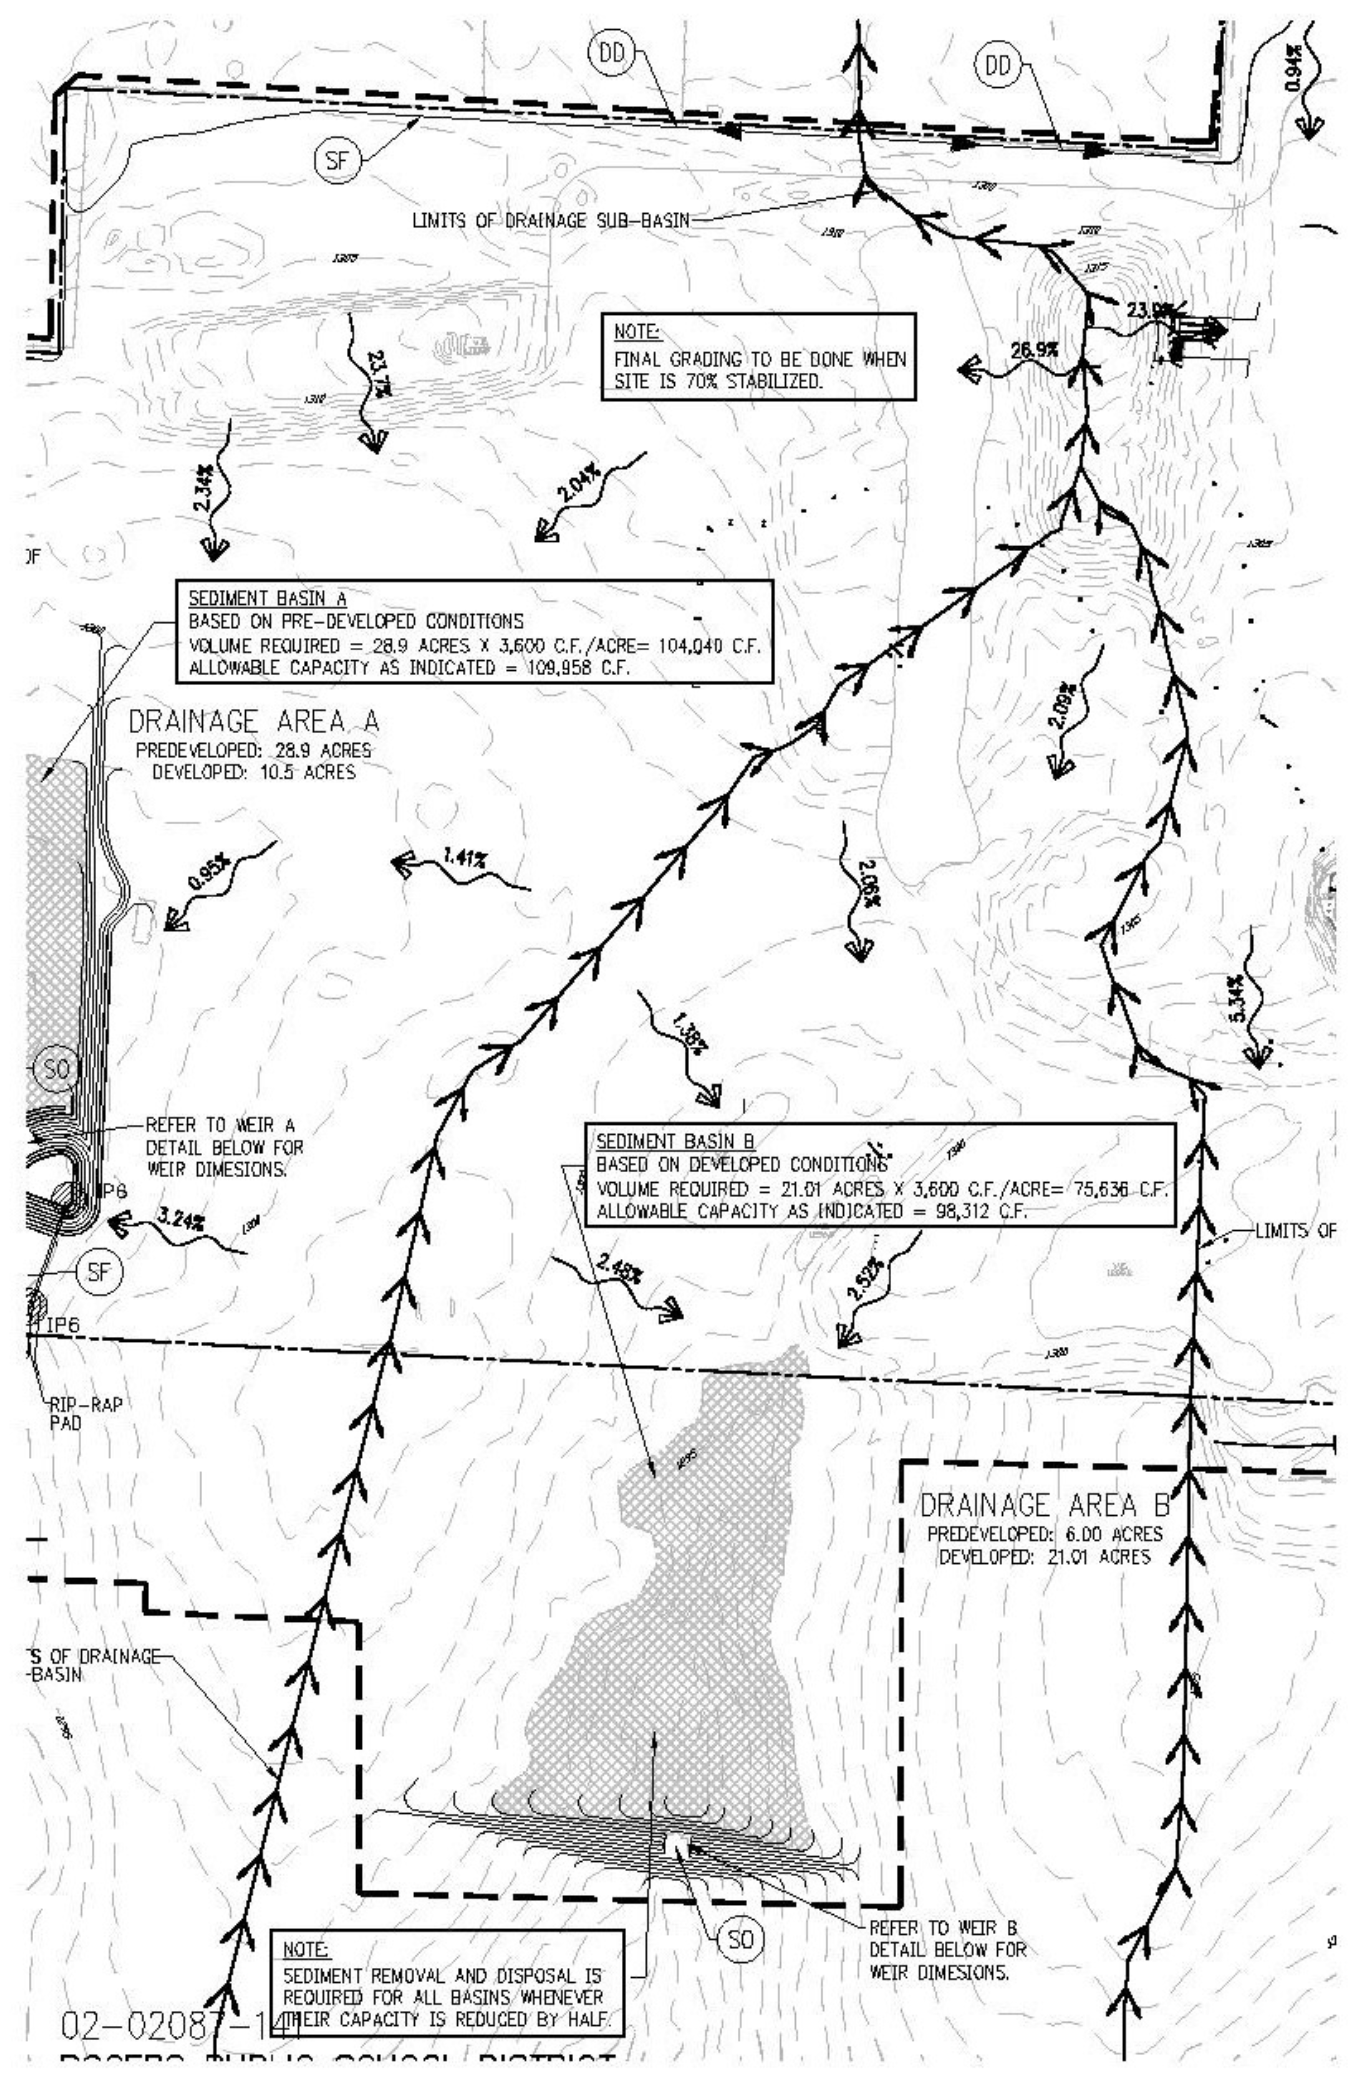
Figure CS-2 – Example of Phase 2 Erosion Control
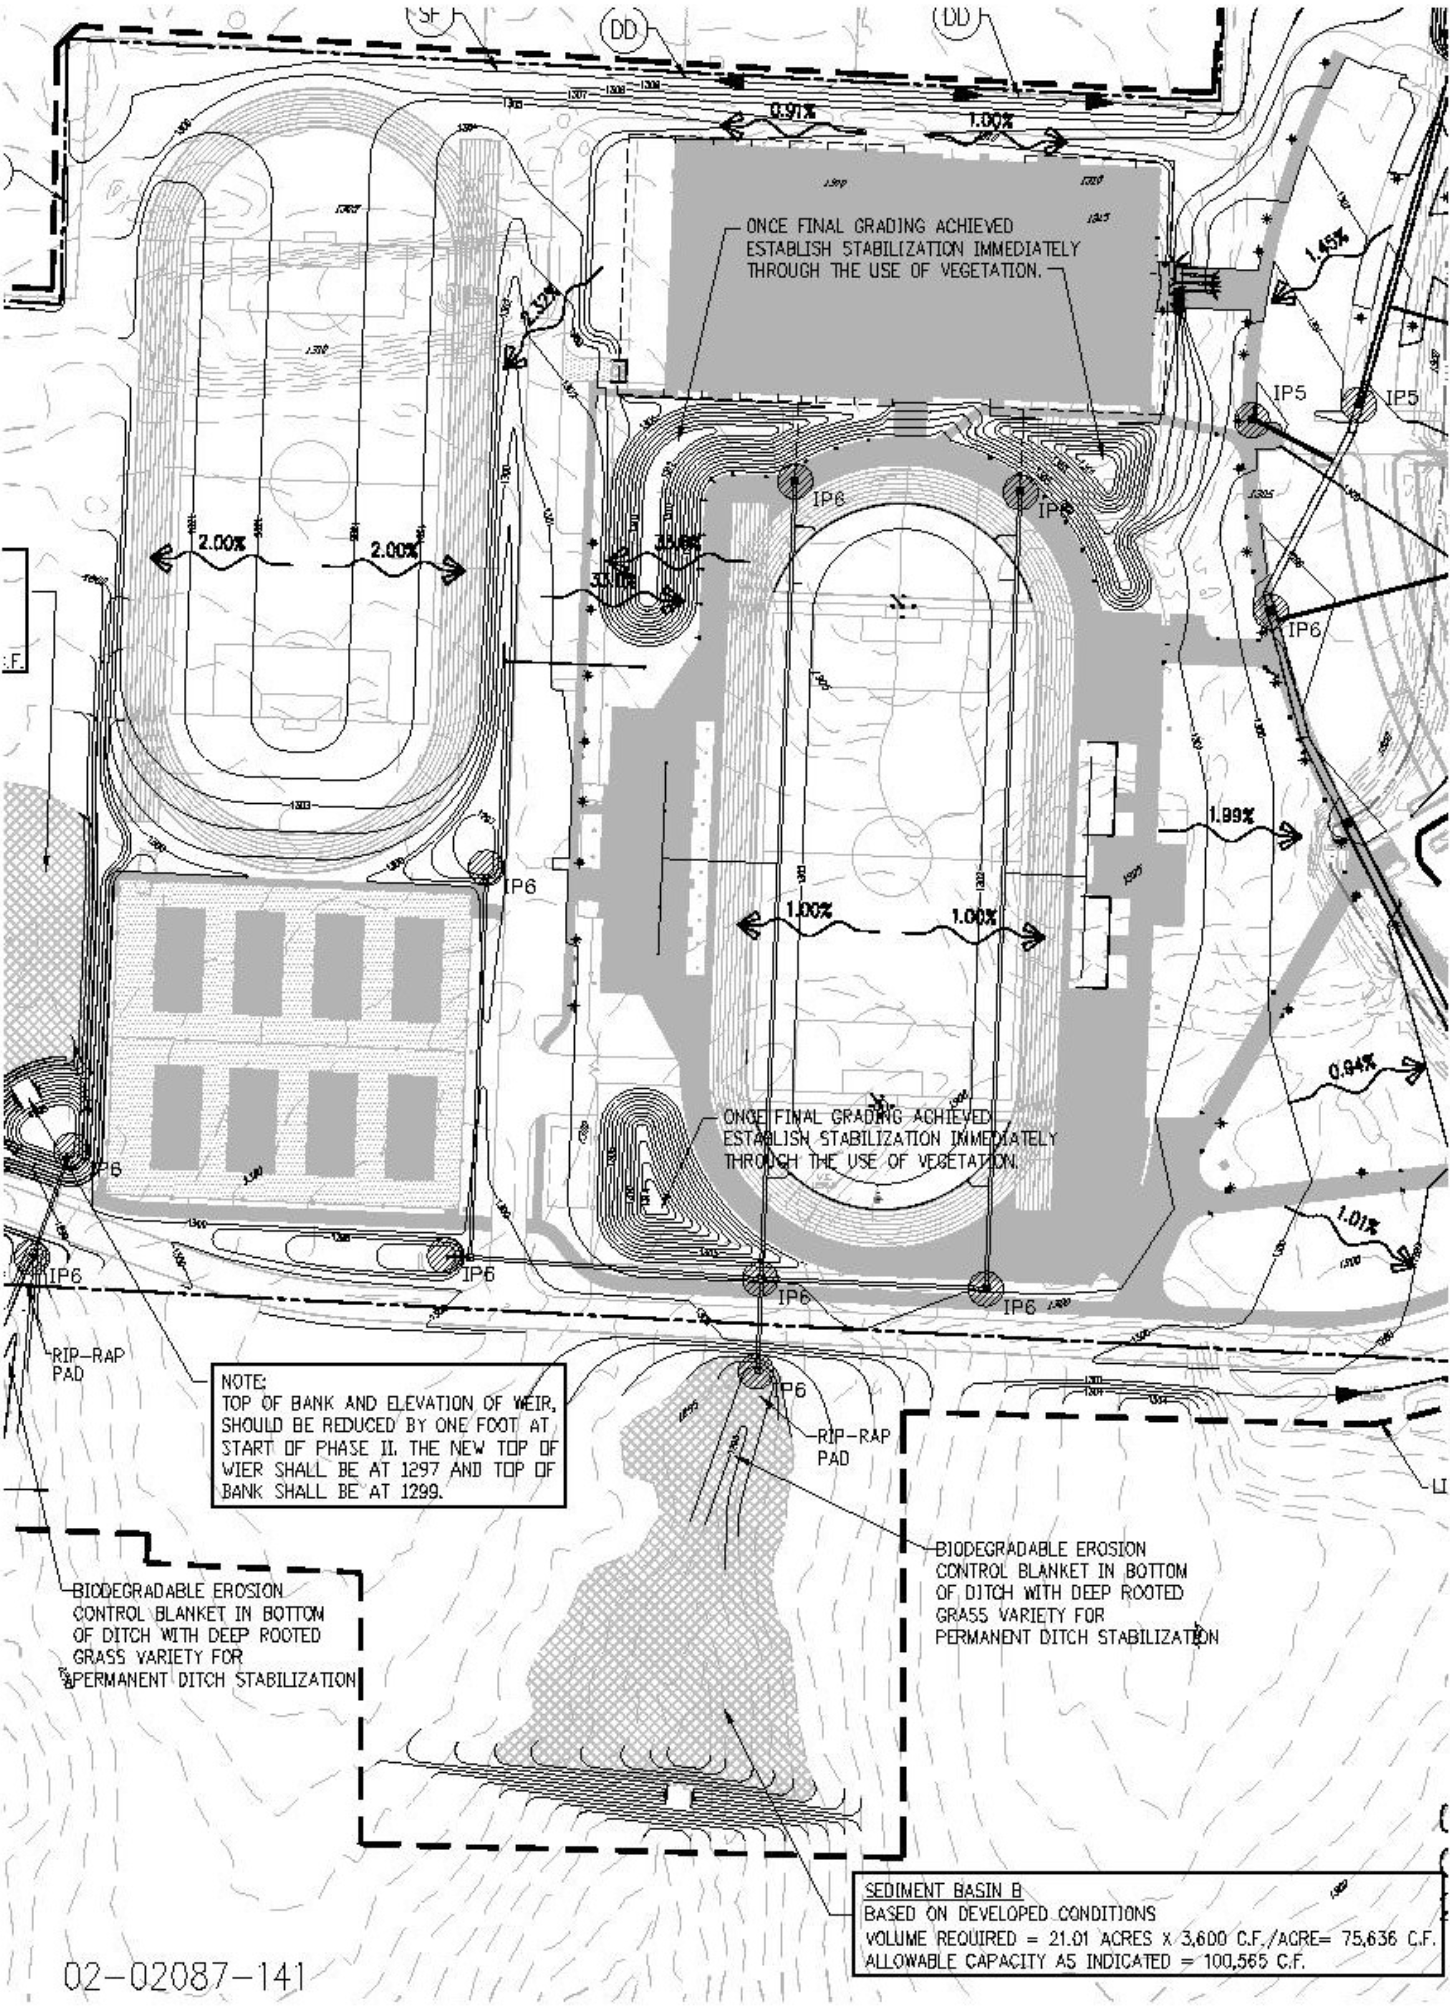
Figure CS-3 – Example of Erosion Control Legend
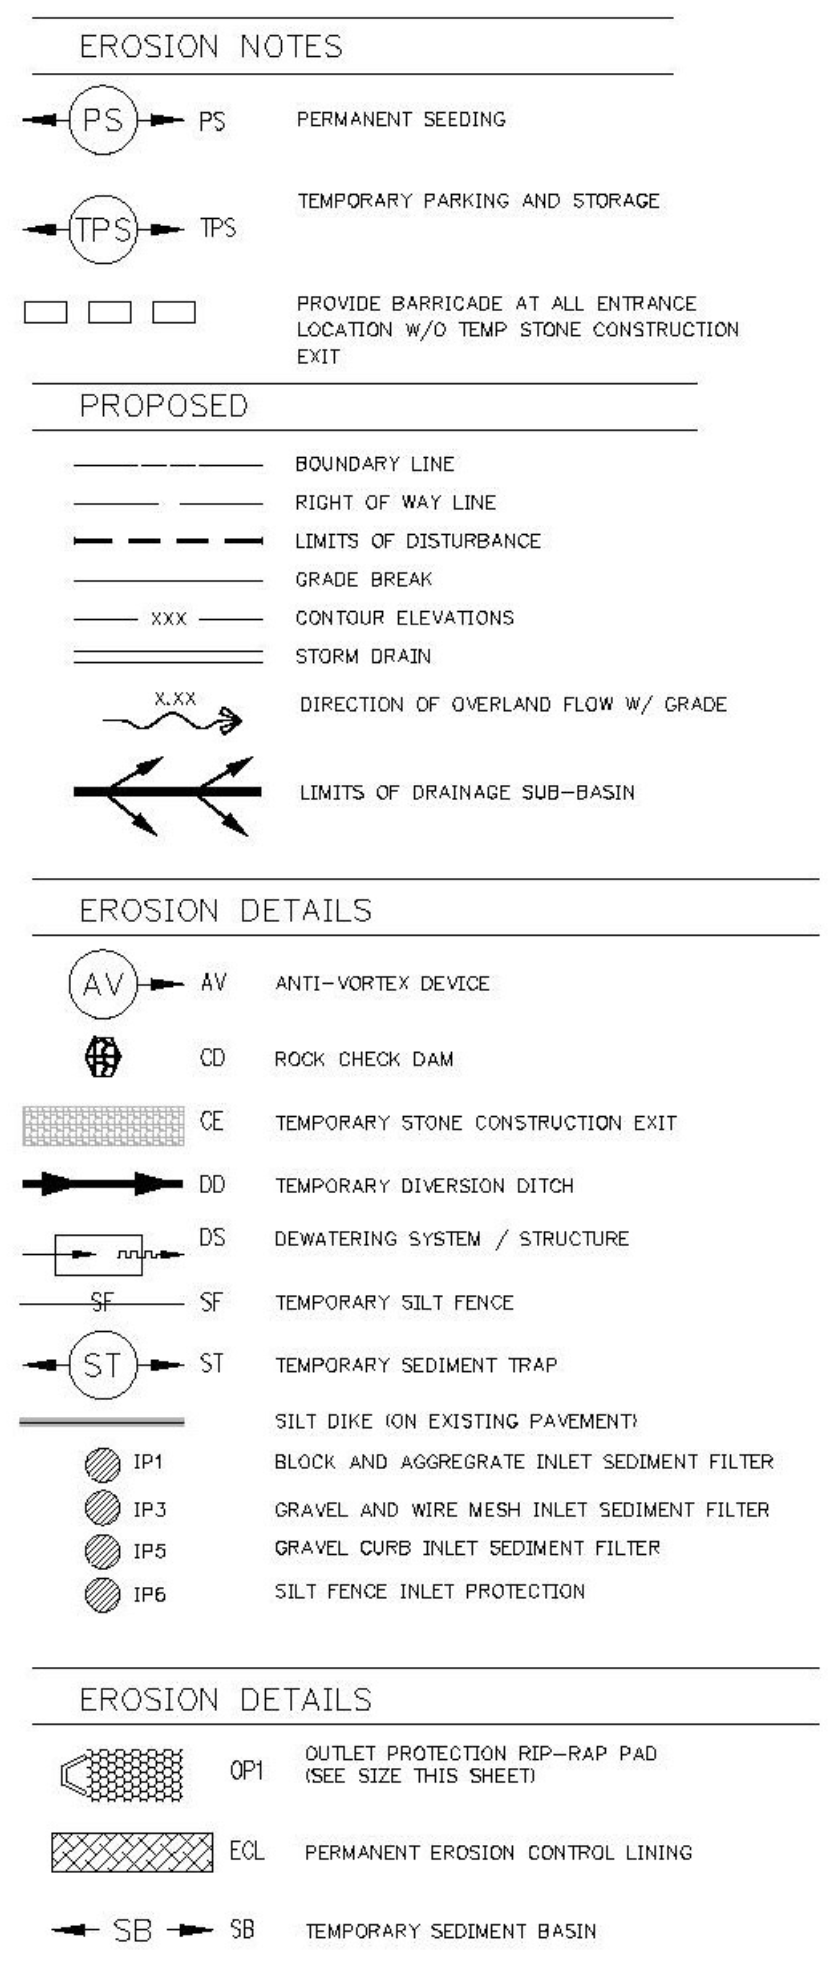
Figure CS-4 – Temporary Culvert Stream Crossing
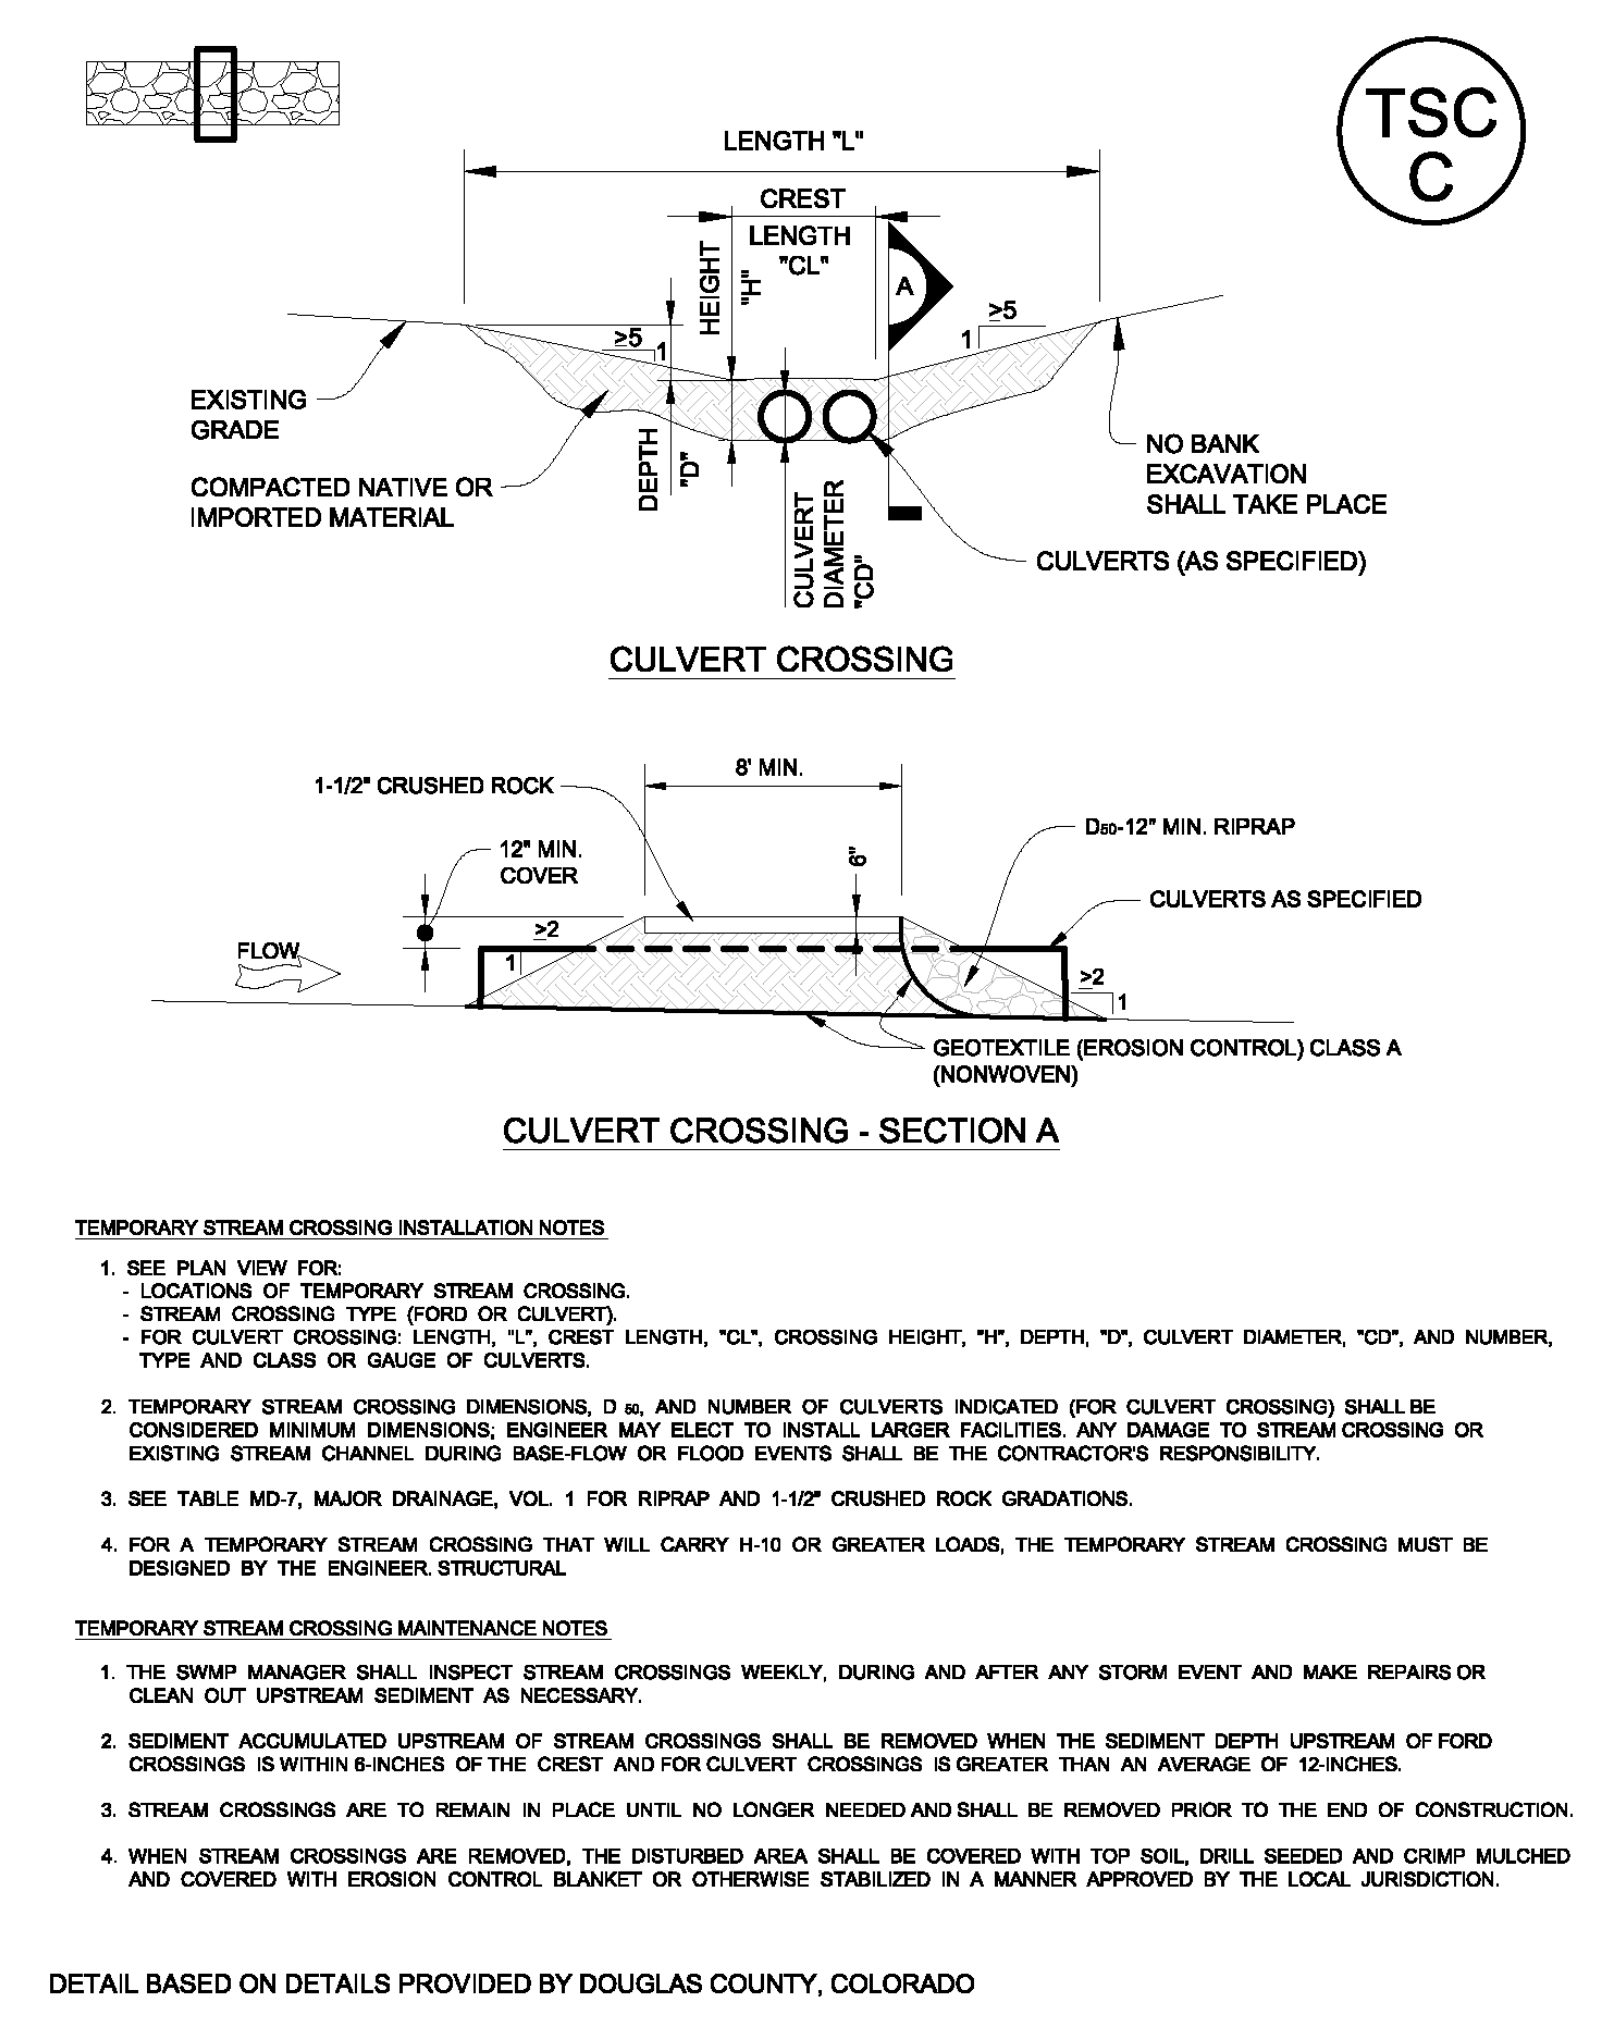
Figure CS-5 – Graphical Illustration of a Temporary Bridge Stream Crossing
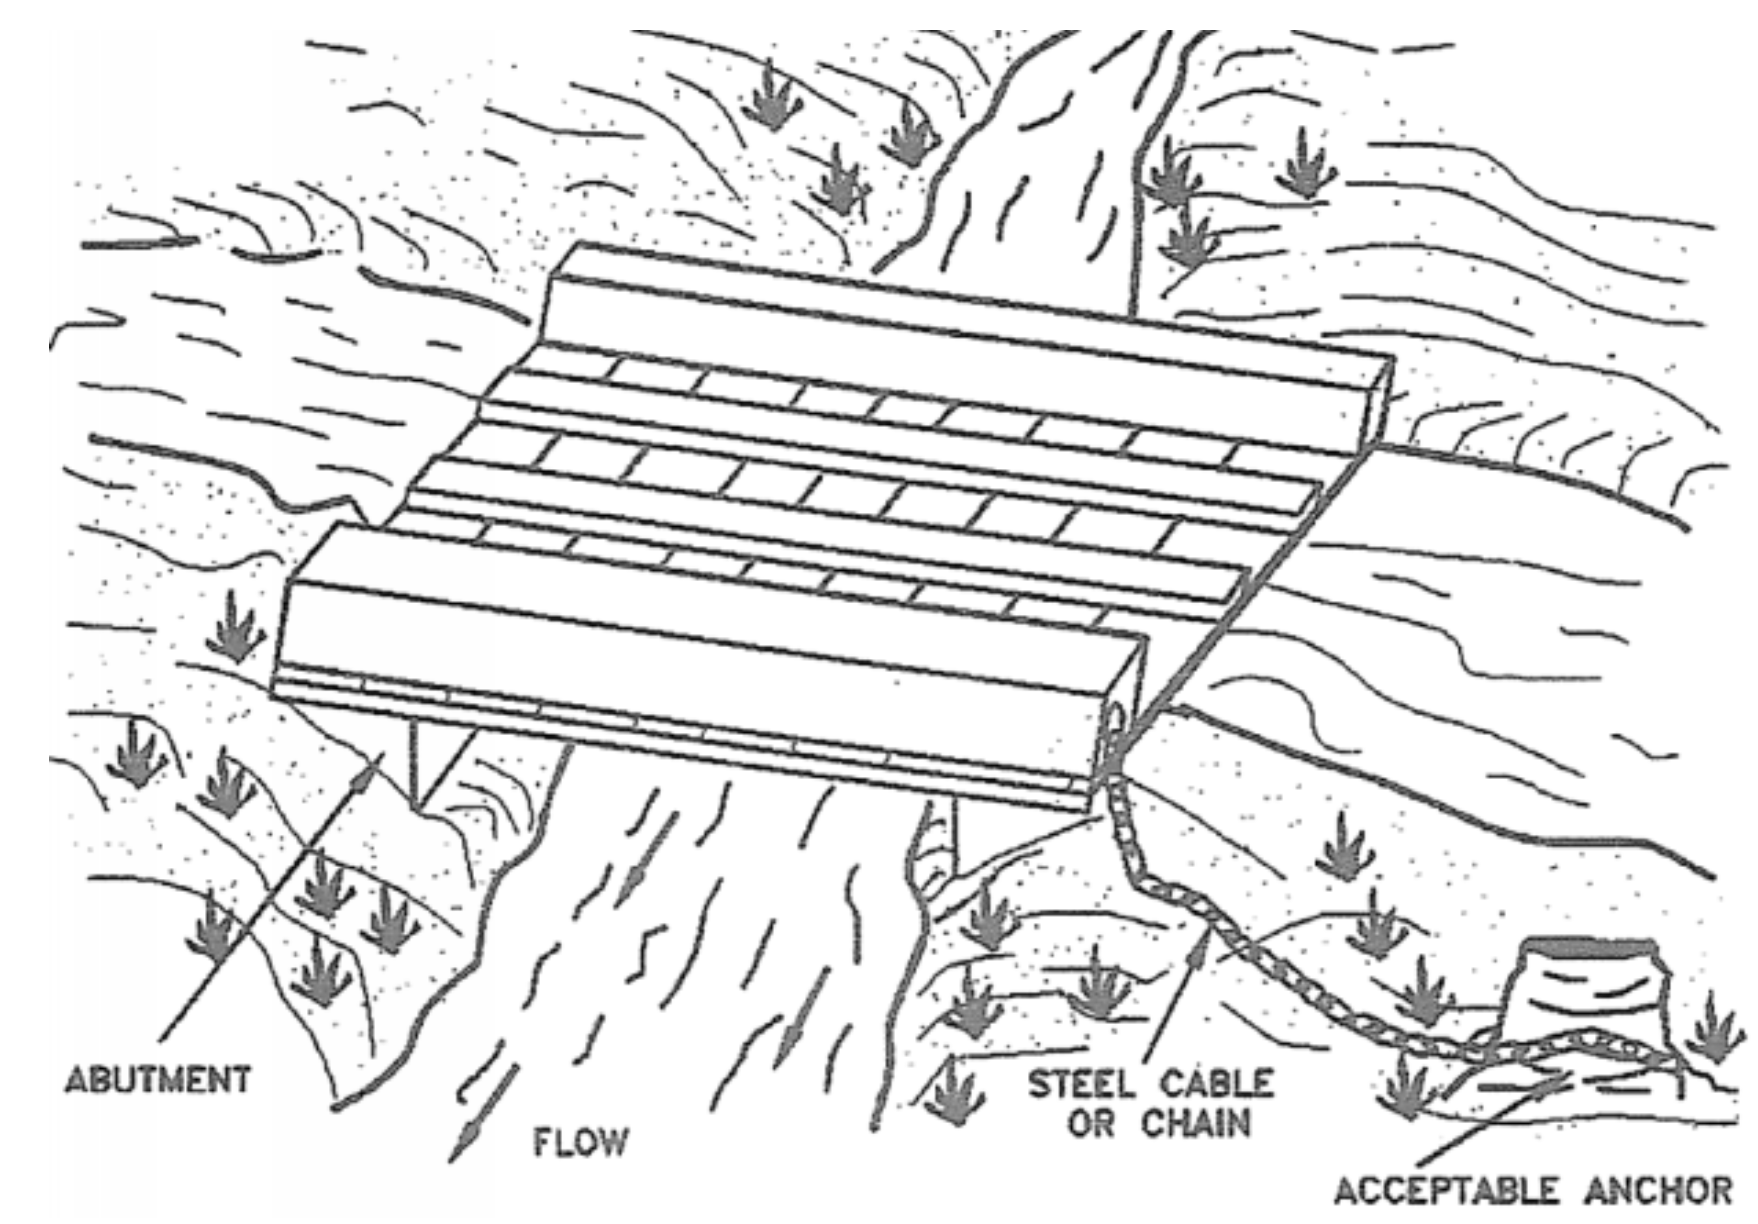
Figure CS-6 – Illustration of a Temporary Diversion Channel
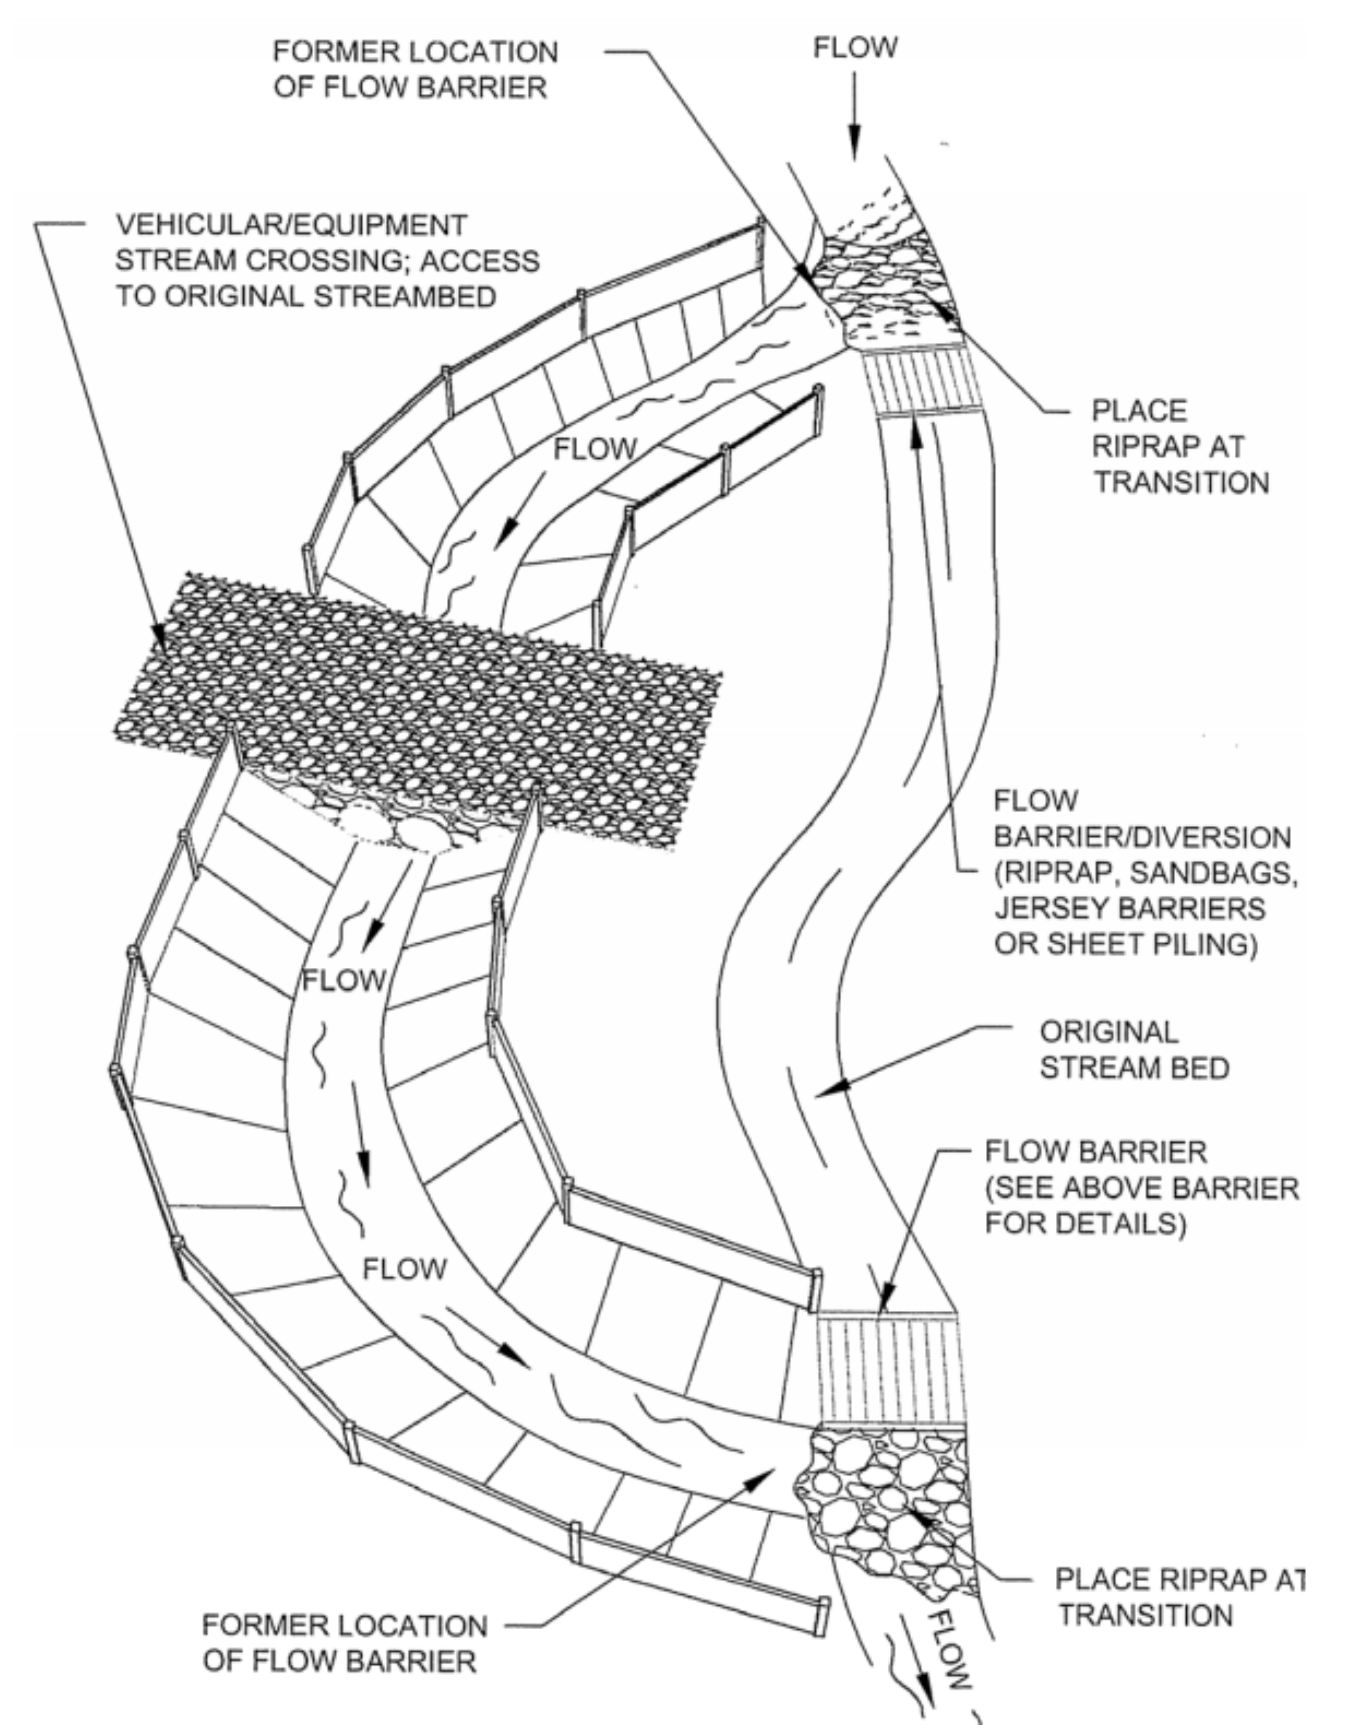
4.2.1 Temporary Channel Diversion Sizing
It is the responsibility of the designer and the contractor to assess their risk of having the temporary diversion be exceeded and to evaluate the damages such an event may cause to the project, adjacent properties, and to others. For larger waterways, including ones controlled by flood control reservoirs, specific risk assessment may be appropriate to insure that the work and the waterways are protected. Risk assessment does not insure that the construction work will be 100 percent safe from high flows in the waterway. It merely provides a reasonable minimum level of flow for the design of temporary diversion channels.
The maximum depth of flow for temporary diversion channels is one (1) foot for flows less than 20 cfs, and a maximum depth of three (3) feet for flows less than 100 cfs. Flows in excess of 100 cfs shall be designed in accordance with Chapter 6 – Open Channel Flow Design of the manual. The steepest side slope allowable for a temporary channel is 2:1 (horizontal:vertical). It is required that the design for temporary diversion channels include a minimum of one-half (0.5) foot of freeboard.
4.2.2 Temporary Channel Stability Considerations
Temporary channels are not likely to be in service long enough to establish adequate vegetative lining. Temporary channel diversions must be designed to be stable for the design flow for the channel lining material. Unlined channels shall not be used unless it can be demonstrated that an unlined channel will not erode during the design flow. Table CS-4 gives allowable channel lining materials for a range of slope and flow depth. Table CS-5 gives Manning’s 'n' values for lining materials. Design procedures for temporary channels are described in detail in the Hydraulic Engineering Circular No. 15 published by the Federal Highway Administration.
Table CS-4 – Lining Materials for Temporary Channels
Maximum Flow Depth | ||
|---|---|---|
Slope Range | 1 ft | 3 ft |
0% - 0.005% | Jute Netting | Straw or Wood Fiber |
0.005% - 1.0% | Straw or Wood Fiber | Straw or Wood Fiber |
1.0% - 2.0% | Geotextile with Overlay of | D50 = 4” Riprap to D50 = 6” Riprap |
2.0% - 3.0% | D50 = 3” Riprap to D50 = 6” Riprap | D50 = 9” Riprap |
3.0% - 4.0% | D50 = 6” Riprap | D50 = 12” Riprap |
Table CS-5 – Temporary Channel Design Criteria
| Manning’s n for | Manning’s n for | Manning’s n for | |
|---|---|---|---|---|
Plastic Membrane | 0.011 | 0.010 | 0.009 | |
Jute Netting | 0.028 | n/a | n/a | |
Straw or Curled Wood Mats | 0.035 | 0.025 | 0.020 | |
Riprap, D50 = 6” Riprap | 0.070 | 0.045 | 0.035 | |
Riprap, D50 = 9” Riprap | 0.100 | 0.070 | 0.040 | |
Riprap, D50 = 12” Riprap | 0.125 | 0.075 | 0.045 | |
Notes:
| ||||
4.2.3 Example: Temporary Channel Diversion Design
A simplified method for designing a non-erosive temporary diversion channel is given as follows:
Step One: Using the tributary area A (in acres) determine peak flow.
Step Two: Determine depth of flow, one (1) foot maximum for flows less than 20 cfs and three (3) feet maximum for flows less than 100 cfs. (Flows in excess of 100 cfs shall be designed in accordance with Chapter 6 – Open Channel Flow Design.)
Step Three: Determine channel slope based on existing and proposed site conditions.
Step Four: Pre-size the channel, determine maximum velocities and select lining material from Table CS-4.
Step Five: Determine the channel geometry and check the capacity using Manning's Equation and the "n" value given in Table CS-5. The steepest side slope allowable for a temporary channel is 2:1 (horizontal:vertical), unless vertical walls are installed using sheet piling, concrete or stacked stone. It is required that the design for temporary bypass channels include a minimum of one-half (0.5) foot of freeboard.
Figure CS-7 – Concrete Washout Detail (EPA)
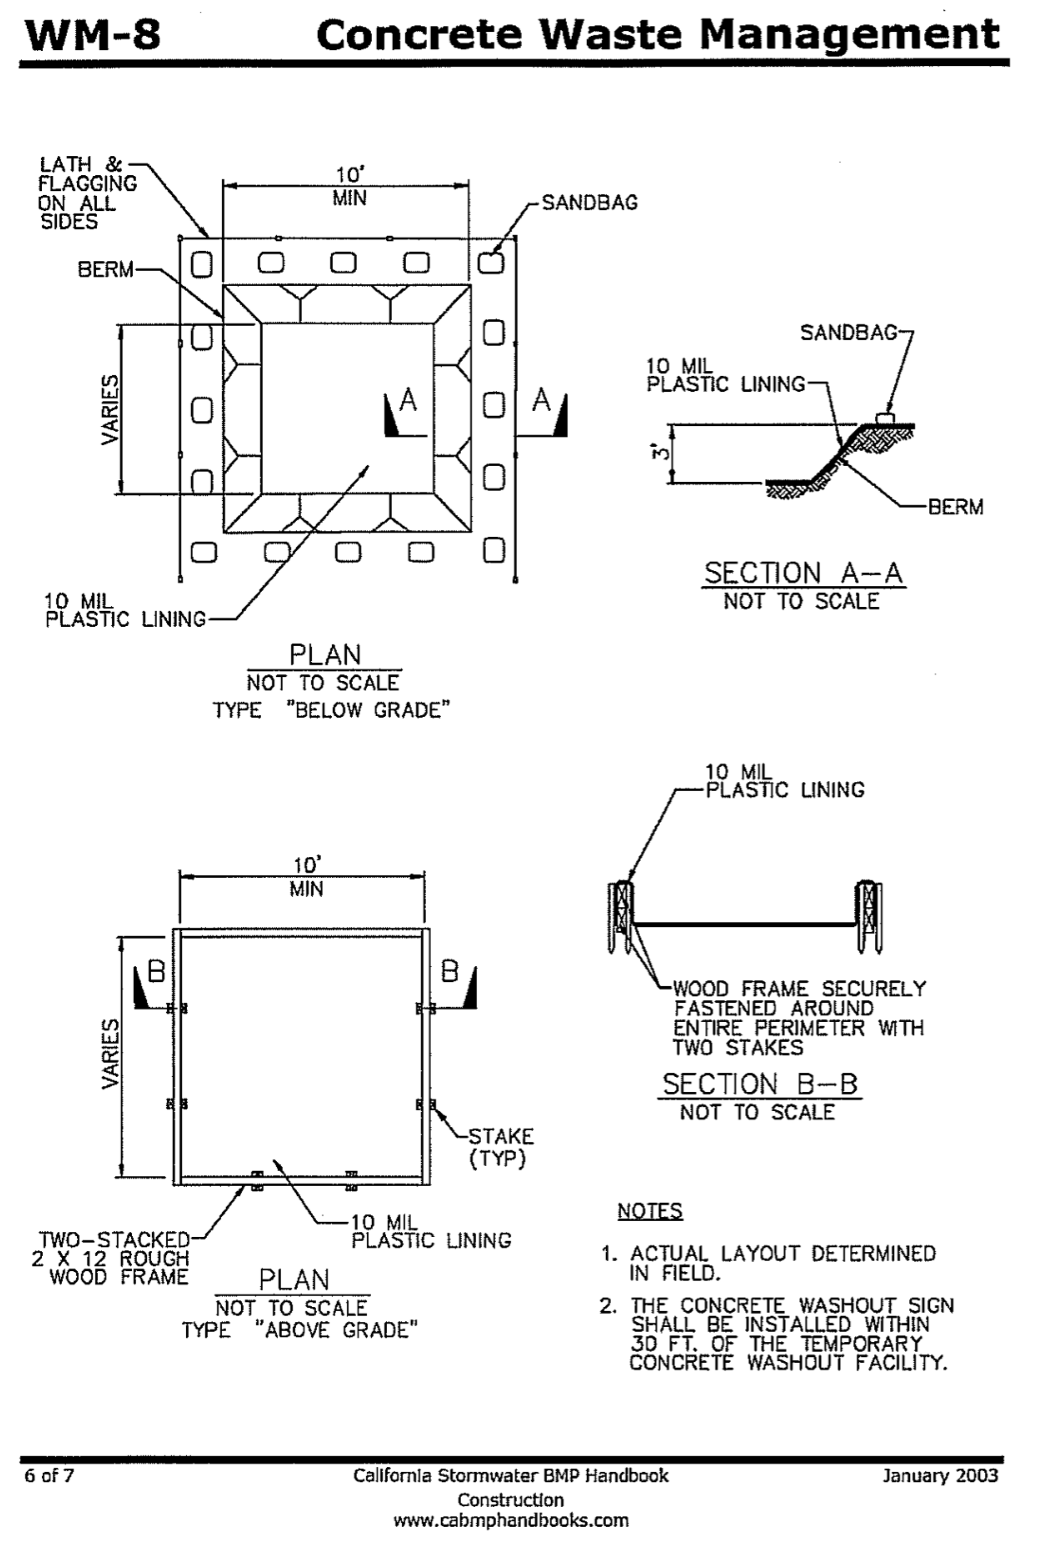
Photograph CS-2 – Example of Dewatering Bag
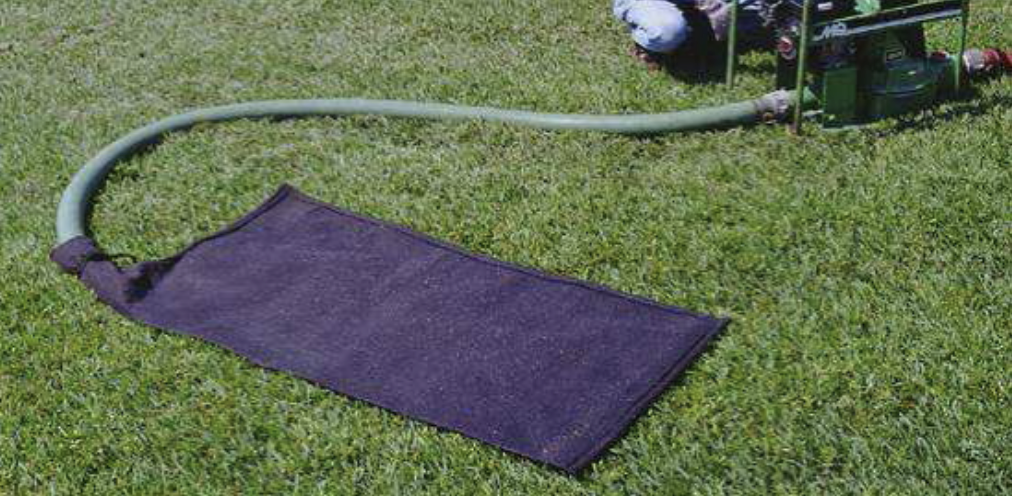
Photograph CS-3 – Example of Erosion Control Blanket
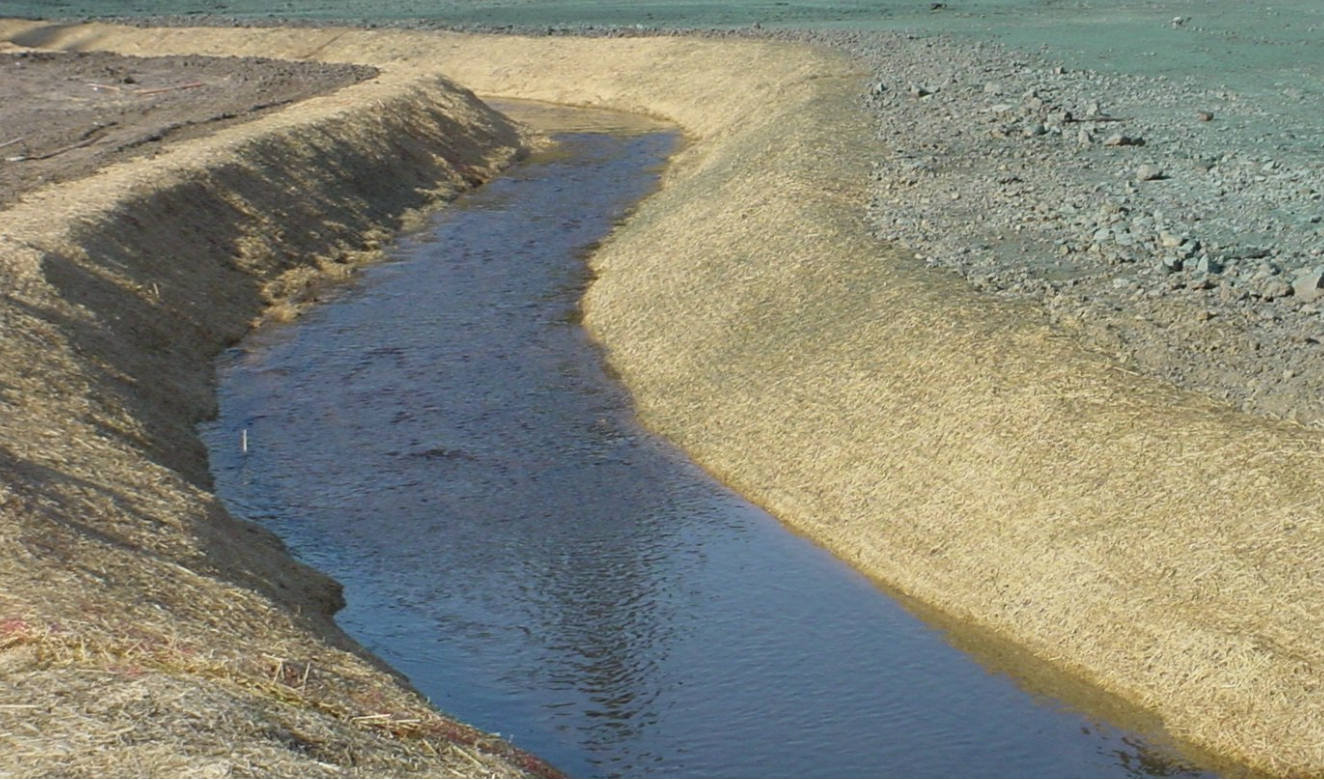
Figure CS-8 – Riprap Apron Sizing for a Round Pipe Flowing Full,
Minimum Tailwater Condition (Tw < 0.5 diameter) (SCS, 1975)
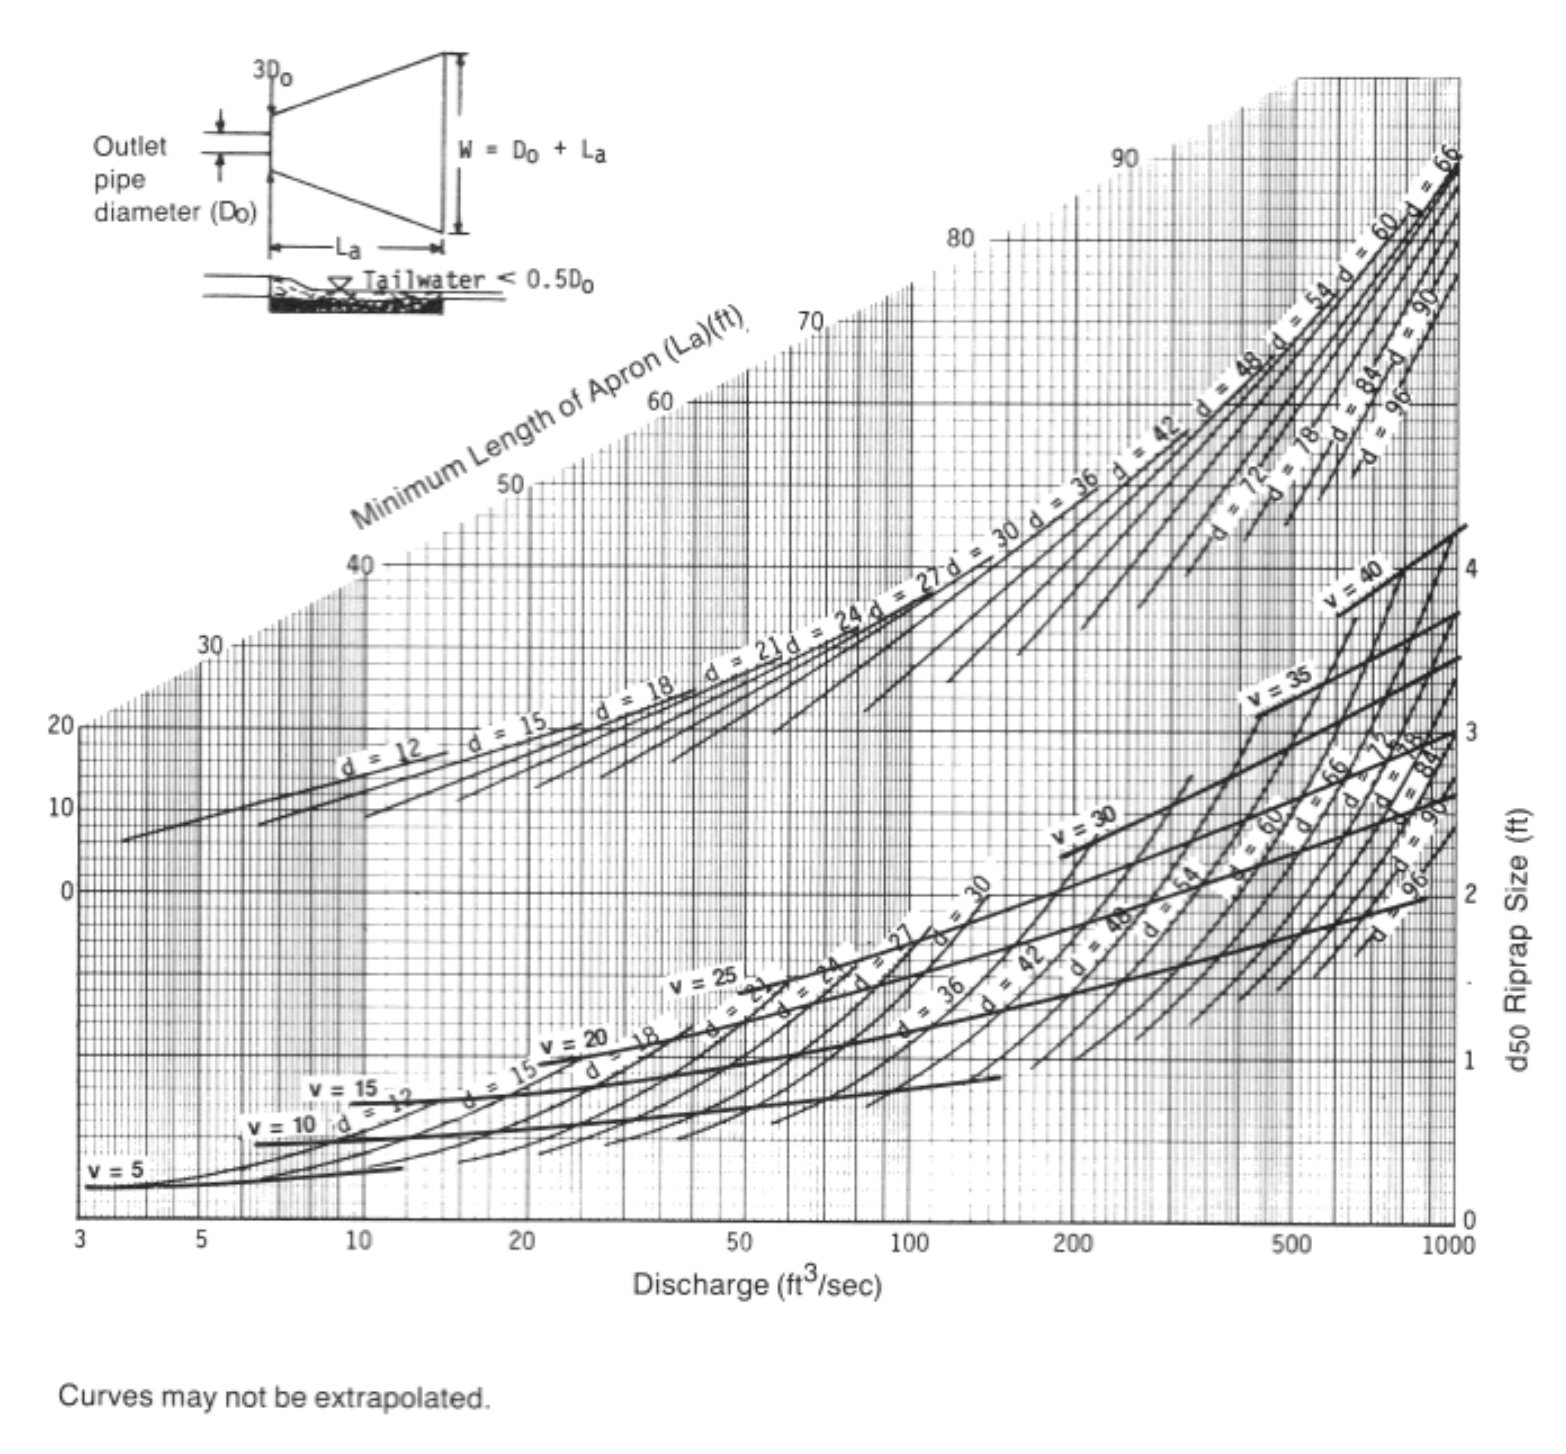
Figure CS-9 – Riprap Apron Sizing for a Round Pipe Flowing Full,
Maximum Tailwater Condition (Tw ≥ 0.5 diameter) (SCS, 1975)
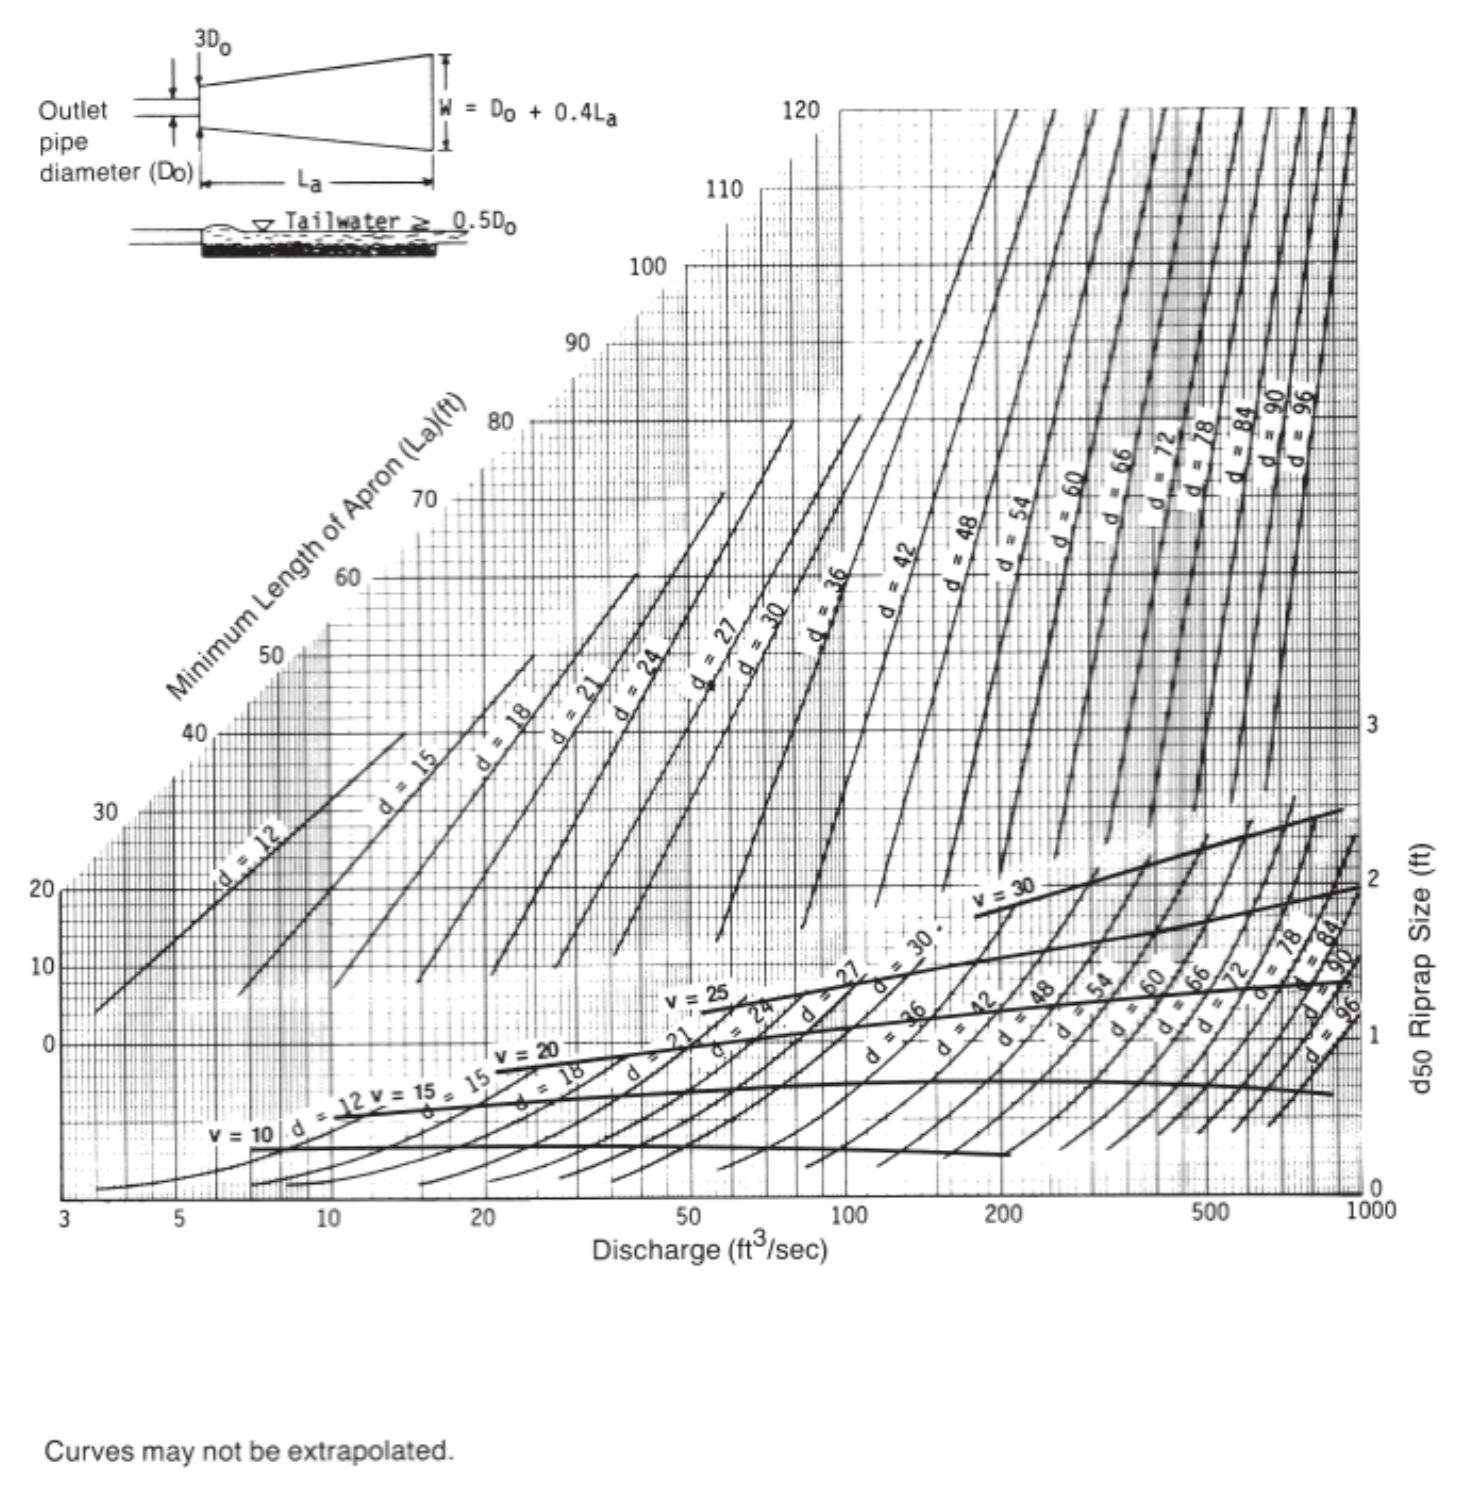
Figure CS-10 – Riprap Apron Detail (MESCG, 1996)
Table CS-6 – Temporary Seeding Planting Materials
Species | Planting Dates | Broadcast Rate (lb/acre) | Plant Characteristics | |
|---|---|---|---|---|
Oats | 2/1 – 5/30 | 8/1 – 9/30 | 80 | not cold tolerant |
Rye/Wheat | 1/1 – 5/31 | 7/15 – 11/15 | 90 / 120 | cold tolerant |
Millet/Sudangrass | 5/1 – 8/15 | --- | 45 / 60 | warm season |
Annual Ryegrass | 1/1 – 5/31 | 7/15 – 9/30 | 75 | not heat tolerant |
Annual Lespedeza plus Tall Fescue | 5/1 – 8/15 | --- | 15 / 45 | warm season |
(Adapted from MAACD, 1998)
Permanent Revegetation
Permanent seeding is the process of establishing permanent vegetative cover through the use of perennial seed mix to control runoff and erosion on disturbed areas. Permanent revegetation protects bare soil surfaces from raindrop impact and reduces the velocity and volume of overland flow.
Permanent seeding should be considered for any disturbed area where all construction or maintenance activities have ceased for a period of one (1) year or longer, or for areas where all construction has been finalized and is now ready for permanent vegetative cover.
All permanent seeding shall be protected with mulch. Mulch is required to protect seeds from heat, moisture loss, and transport due to runoff.
Vegetation is not considered established until a ground cover is achieved which is equivalent to at least 80% of the previously existing vegetation and is sufficiently mature to control soil erosion and can survive severe weather conditions.
Each site will have different characteristics, and a landscape professional should be contacted to determine the most suitable species or seed mix for a specific site. The recommended seed mix will depend on site specific information such as elevation, exposure, soils, water availability, and topography. Seeding shall be done at the proper time of year, and the proper application of fertilizers will contribute to the success of the seeding.
In lieu of a specific recommendation and for planning purposes, one of the perennial grass species appropriate for site conditions listed in Table 8.2 can be used. The seeding rates of application recommended in these tables are considered to be absolute minimum rates for seed applied using proper drill-seeding equipment. Appropriate seeding dates are also provided in Table 8.2.
Table CS-7 – Seeding rates and timing for turfgrasses in Arkansas
(Univ. of Arkansas Cooperative Extension Service FSA2113)
Perennial Grass Species | Area of Adaptation | Seeding Rate lbs/1,000 ft2 | Days to Germinate | Planting Time |
|---|---|---|---|---|
Tall fescue + Kentucky bluegrass | North | 5.0 to 7.0 | 5 to 21 | September-October preferred |
Tall fescue | Central, North | 8.0 to 10.0 | 5 to 10 | September-October preferred (or early spring) |
Bermudagrass | Statewide | 0.5 to 1.0 | 7 to 14 | May-June |
Centipedegrass | South | 0.25 to 0.5 | 7 to 14 | May-June |
Zoysiagrass | Statewide | 1.0 to 2.0 | 10 to 21 | May-June |
Annual or perennial ryegrass (overseeding) | Statewide | 6.0 to 10.0 | 5 to 8 | September-November |
Limitations
Vegetation is not appropriate for heavily trafficked areas (vehicular and pedestrian) and is not appropriate for rocky, gravelly, or course grained soils. For these types of soils, apply six (6) inches of clean topsoil before seeding.
Permanent seeding may only be applied during planting season. Temporary cover is required until that time.
Maintenance Requirements
Vegetated areas shall be protected from runoff from adjacent areas and traffic (vehicular and pedestrian).
Permanent seeding is the last phase of reclaiming any disturbed soils. Inspect all seeded areas on a regular basis and after each major storm event to check for areas where corrective measures may have to be made. Indicate which areas need to be reseeded or where other remedial actions are necessary to assure establishment of permanent seeding. Continue monitoring the site until permanent vegetation is established. Until established, the vegetation will require fertilization and water.
Photograph CS-4 – Example of Silt Fencing
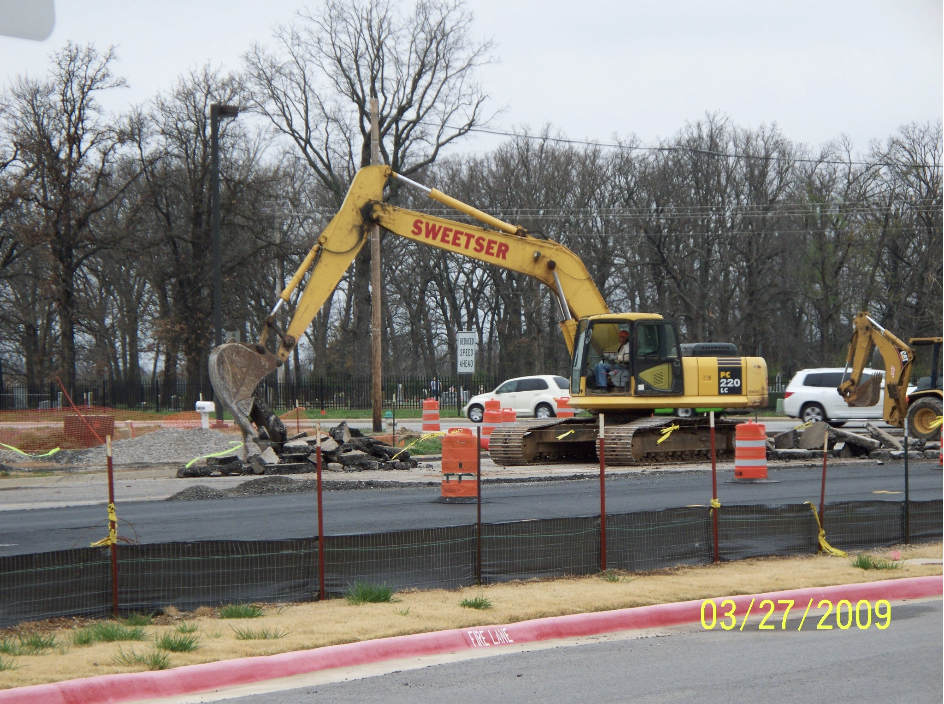
Photograph CS-5 – Example of Inlet Protection
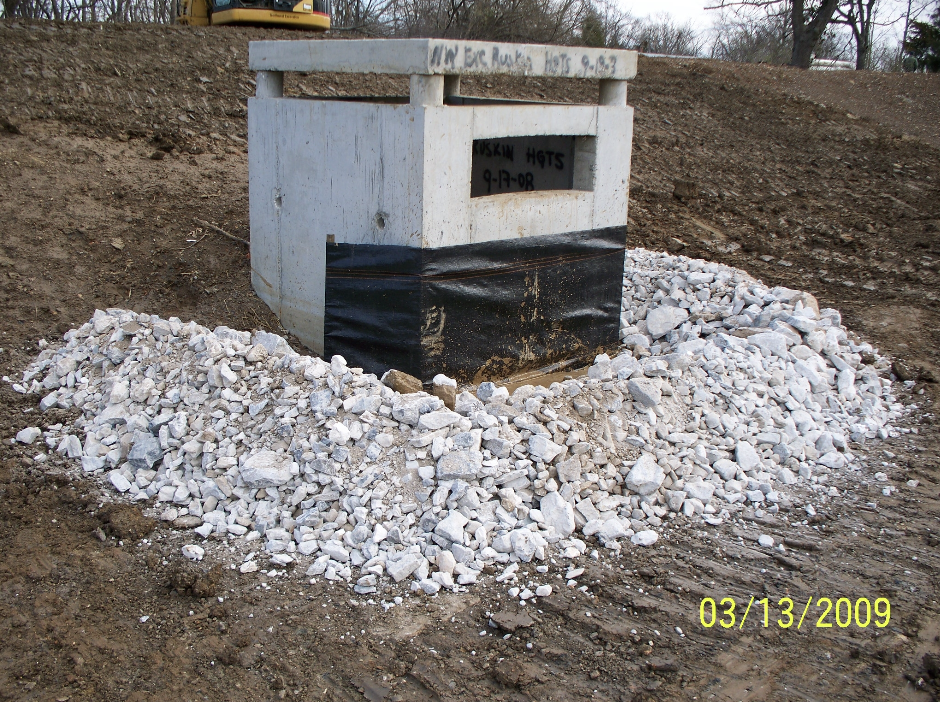
Design Criteria
If silt fence is used as the dam material, the post shall be driven at the edge of the inlet and shall be no greater than three (3) feet apart. The fence should be installed according to the Silt Fence Inlet Protection detail.
For inlets in paved areas, either gravel, sandbags, or wattles should be used as the dam material. If gravel is to be used as the dam material, the gravel shall be at least one (1) inch in diameter. The dam shall be no higher than one (1) foot high and the side shall have no greater than a 2:1 (horizontal:vertical) slope. If sandbags are used as the dam material, the bags shall be no heavier than fifty (50) pounds and shall be stacked no higher than three (3) bag diameters high, with the bags layered in a pyramid formation.
For inlets located in sump, it is important that the inlet continue to function while reducing the amount of sediment entering it. This can be accomplished for a curb opening or combination inlet in a sump by setting the maximum height of the protective barrier lower than the top of the curb opening. This allows overflow to occur during larger rainfall events even though sediment-laden runoff will enter the storm drainage system. If the inlet protection height is greater than the curb elevation, particularly if the filter is clogged from previous sediment deposits, runoff will not enter the inlet and can bypass it, possibly causing more downstream erosion and damage than would occur without inlet protection. Area inlets located in a sump setting can be protected through the use of geotextile, concrete block and gravel filter, sandbags, excavated sediment trap, or “rock socks” imbedded in the adjacent soil and stacked around the area inlet.
For inlets located along a slope, it is best not to use the details described above, since the flows in the gutter will merely bypass the inlet. A more effective approach is to control sediment along a sloping street by trapping it before it enters the inlet, which can be done fairly effectively, but not completely, through the use of gravel “socks”, triangular silt dikes, or other proprietary products placed upstream of the inlet.
Limitations
Inlet protection control measures are not capable of handling large quantities of sediment and can require maintenance during rain events in order to protect nearby facilities and to eliminate flooding. Ponding can cause flooding problems for surrounding facilities.
If the flow entering the inlet is being directed to a sedimentation basin, no such inlet protection is needed. In those cases it is much more effective to drop out sediment at the sedimentation basin rather than creating a condition where the stormwater cannot enter the inlet and continues to move downstream, eventually overflowing into the waterway in an uncontrolled fashion.
Maintenance Requirements
Inlet protection measures should be inspected during storm events to ensure surrounding facilities are not flooded.
Inlet protection measures shall be inspected weekly and after one-half (1/2) inch or greater rainfalls for proper installation, defective fencing, erosion, and excessive sediment buildup and defective measures repaired or replaced within 24 hours.
Figure CS-11 – Silt fence inlet protection detail
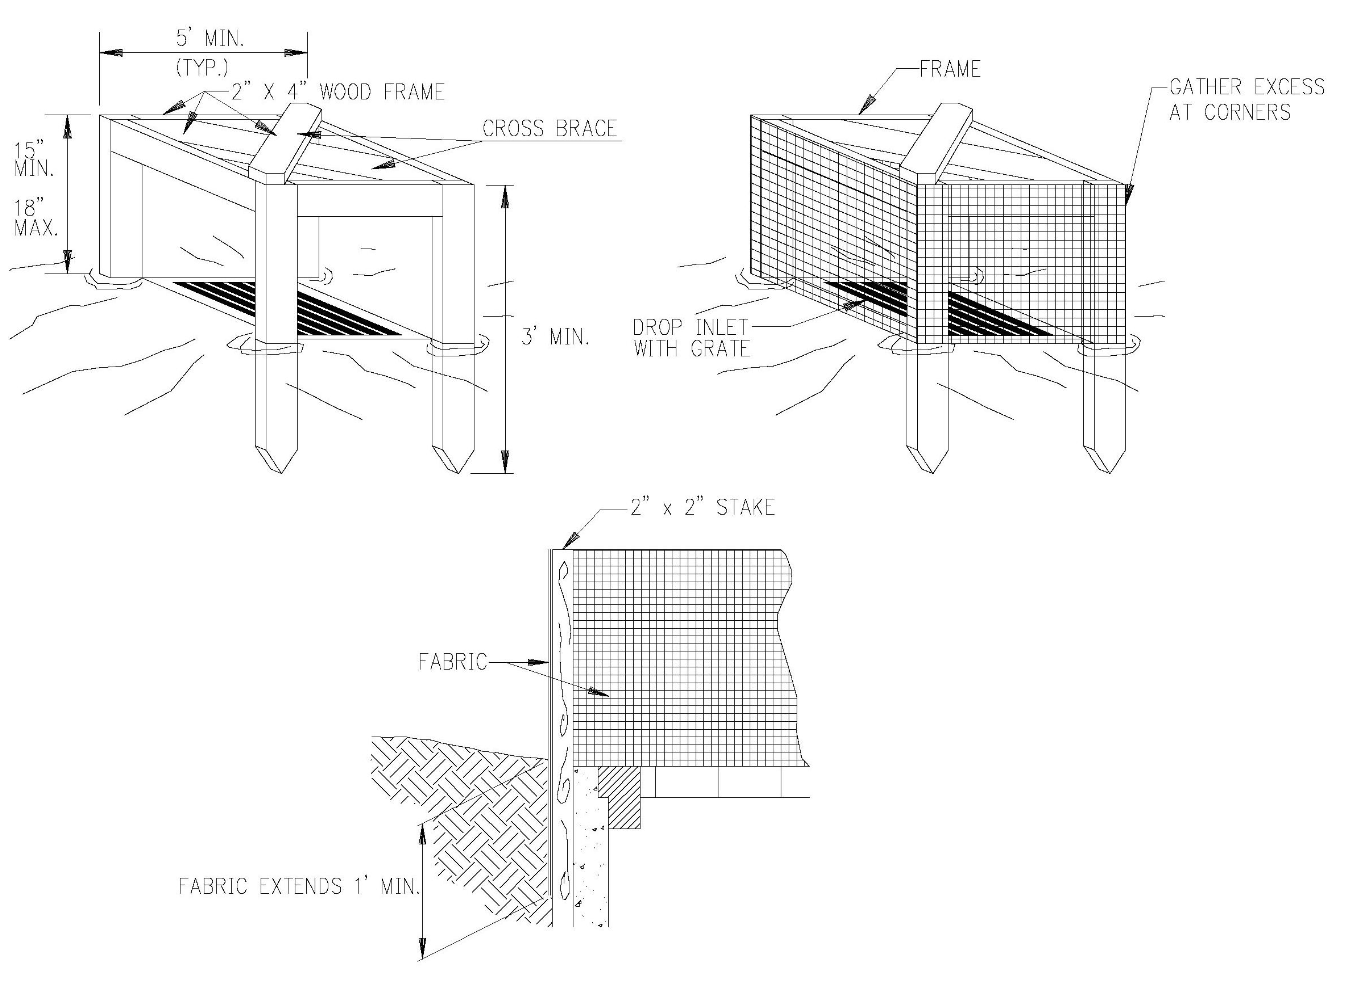
Table CS-8 – Minimum Sediment Trap Dimensions
Drainage Area (acres) | Minimum Bottom Area (square feet) | Overflow Spillway Width (ft) |
|---|---|---|
1 or less | 250 | 6 |
1 to 2 | 675 | 12 |
2 to 3 | 1500 | 18 |
Limitations
Sediment Traps do not have sufficient surface area to allow for settling of very small particles (e.g. clay, silt).
Sediment Traps are not appropriate for runoff from areas greater than three (3) acres.
Maintenance
Sediment Traps shall be inspected weekly and after one-half (1/2) inch or greater rainfalls for proper installation, erosion, and excessive sediment buildup and defective measures repaired or replaced within 24 hours.
Figure CS-12 – Sediment trap detail (Adapted from: AHTD, 2001)
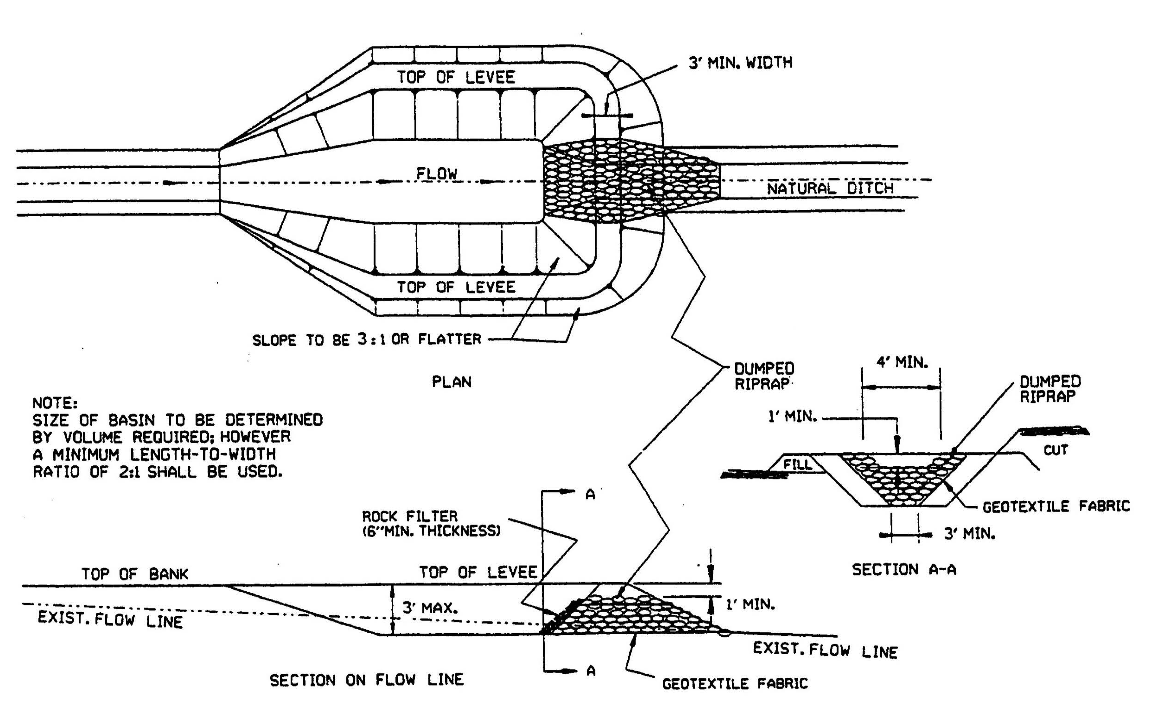
Photograph CS-6 – Example of Sediment Basin with Stone Outlet
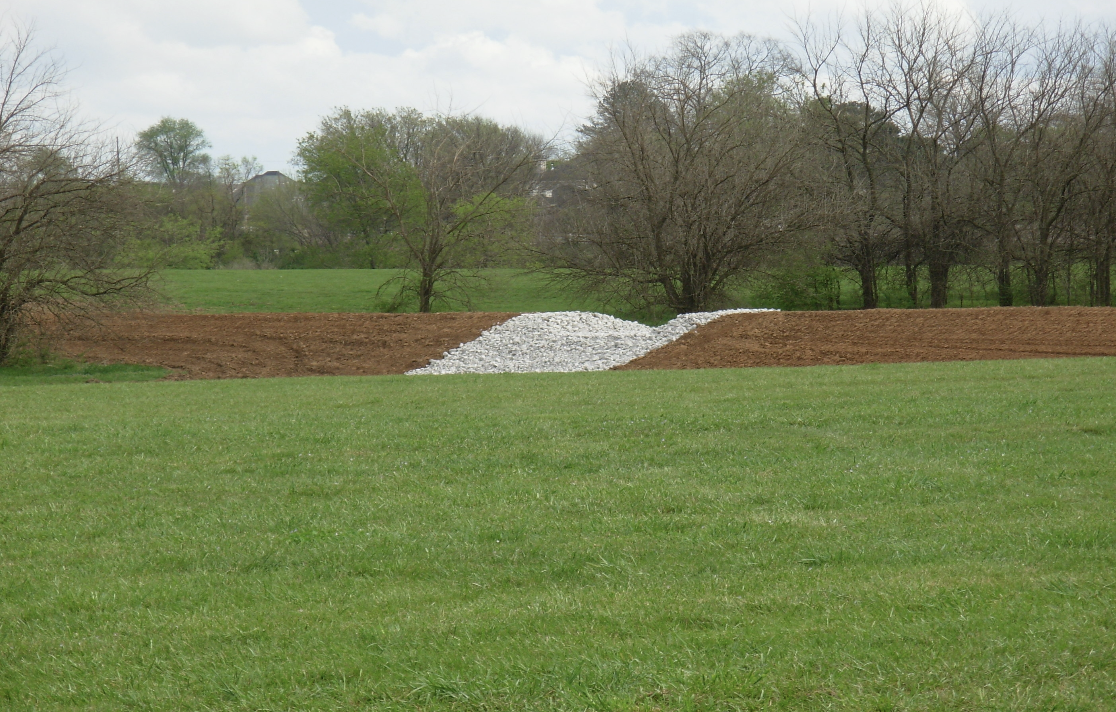
Photograph CS-7 – Example of Fiber Roll/Wattle
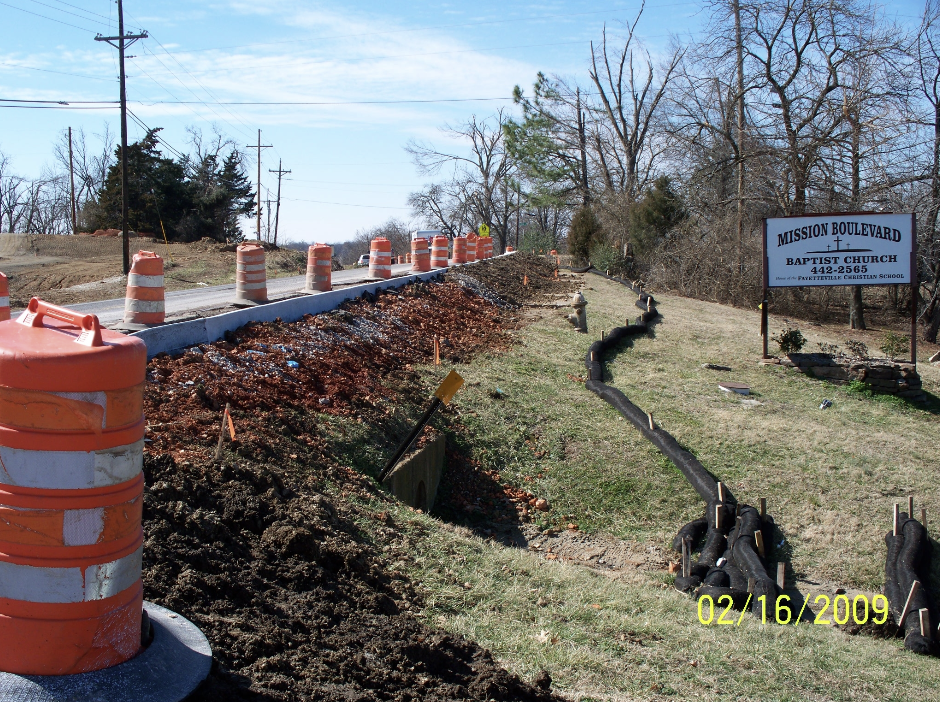
Applications
Fiber rolls can be used along the toe, top, face, and at-grade breaks of exposed and erodible slopes to shorten slope length and spread runoff as sheet flow. They can be used along the perimeter of a project, as check dams in unlined ditches, downslope of exposed soil areas, and around temporary stockpiles.
Implementations
Fiber rolls should be prefabricated rolls or rolled tubes of geotextiles fabrics. When rolling the tubes, make sure each tube is at least eight (8) inches in diameter. Bind the rolls at each end and every four (4) feet along the length of the roll with jute-type twine.
On slopes, install fiber rolls along the contour with a slight downward angle at the end of each row to prevent ponding at the midsection. Turn the ends of each fiber roll upslope to prevent runoff from flowing around the roll. Fiber rolls should be installed in shallow trenches.
Limitations
Fiber rolls are not effective unless trenched.
If not properly staked and entrenched, fiber rolls can be transported by high flows.
Fiber rolls have a very limited sediment capture zone.
Fiber rolls can be difficult to move once saturated.
Maintenance
Inspect fiber rolls to ensure that they remain firmly anchored in place and are not crushed or damaged by equipment traffic. Monitor fiber rolls daily during prolonged rain events. Repair or replace split, torn, unraveled, or slumping fiber rolls.
(Source: US Environmental Protection Agency)
Figure CS-13 – Sand bag check dam detail (Source: AHTD, 2001)
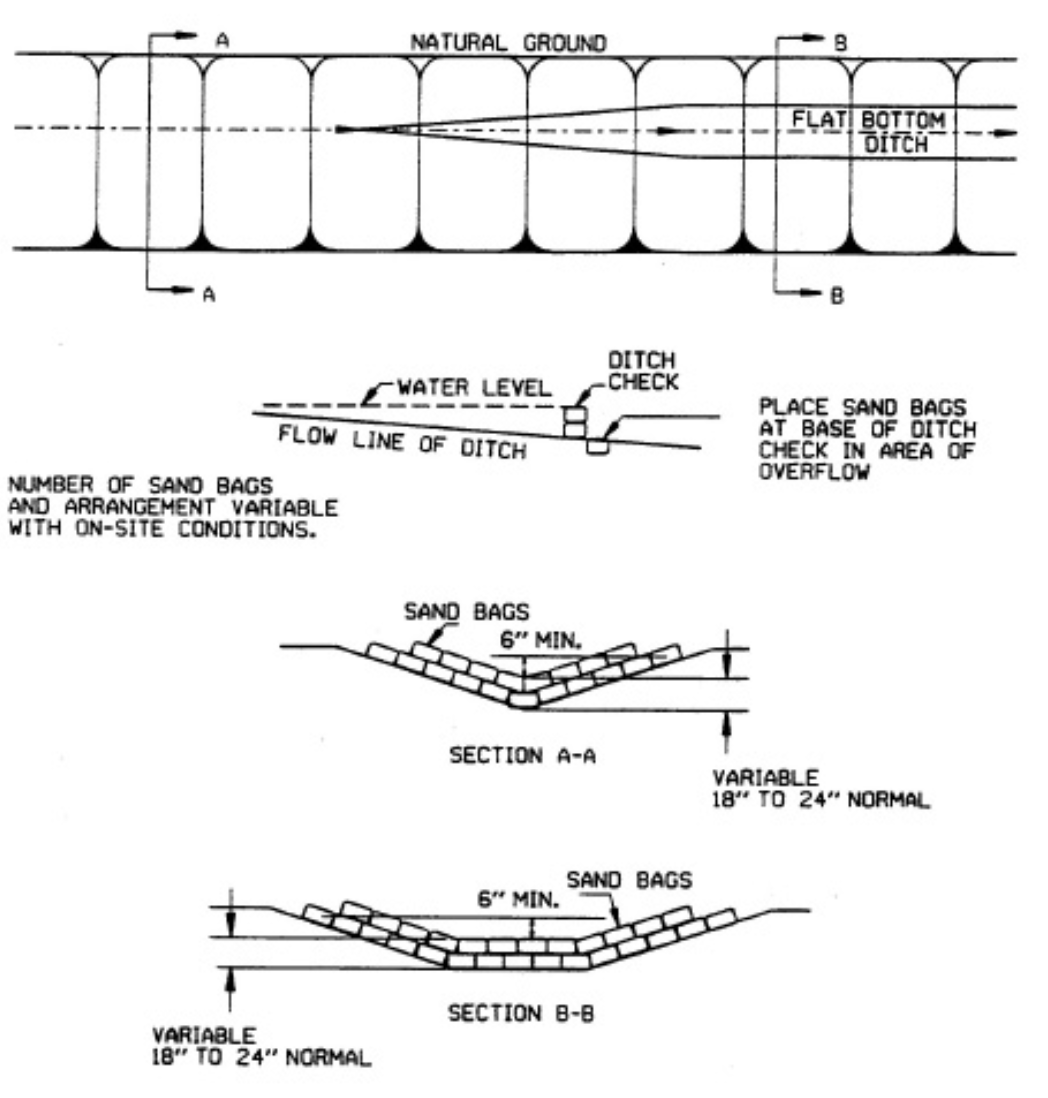
Figure CS-14 – Rock Check Dam Detail (Source: AHTD, 2001)
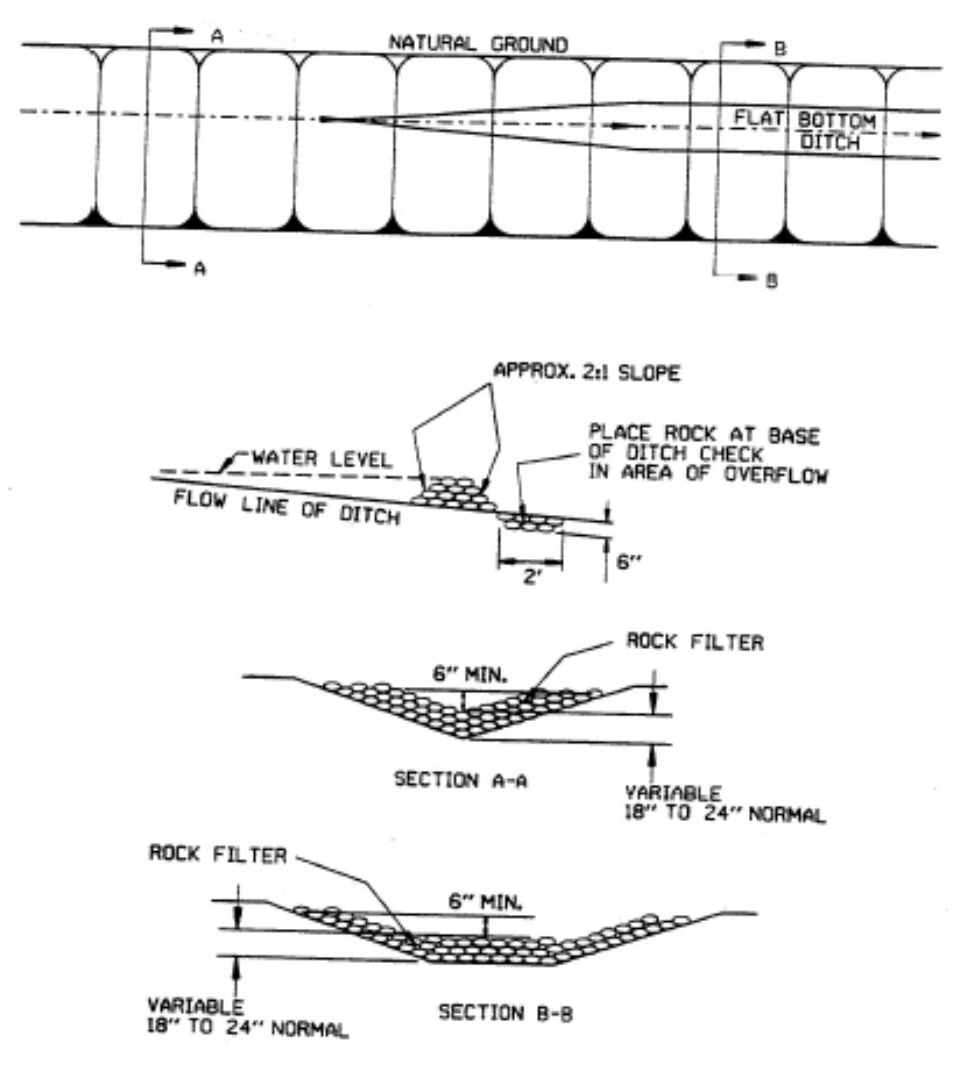
Photograph CS-8 – Example of Rock Check Dam (Source: Delaware DOT)
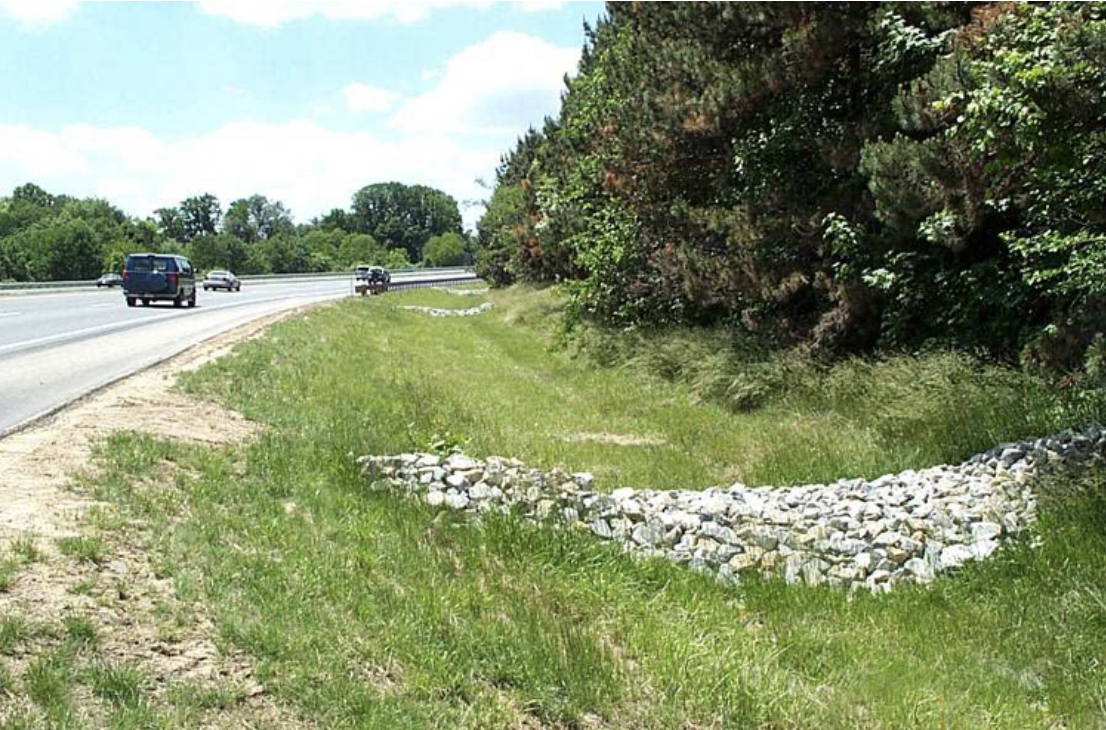
Figure CS-15 – Triangular Silt Dike Detail (Source: ACF Environmental)
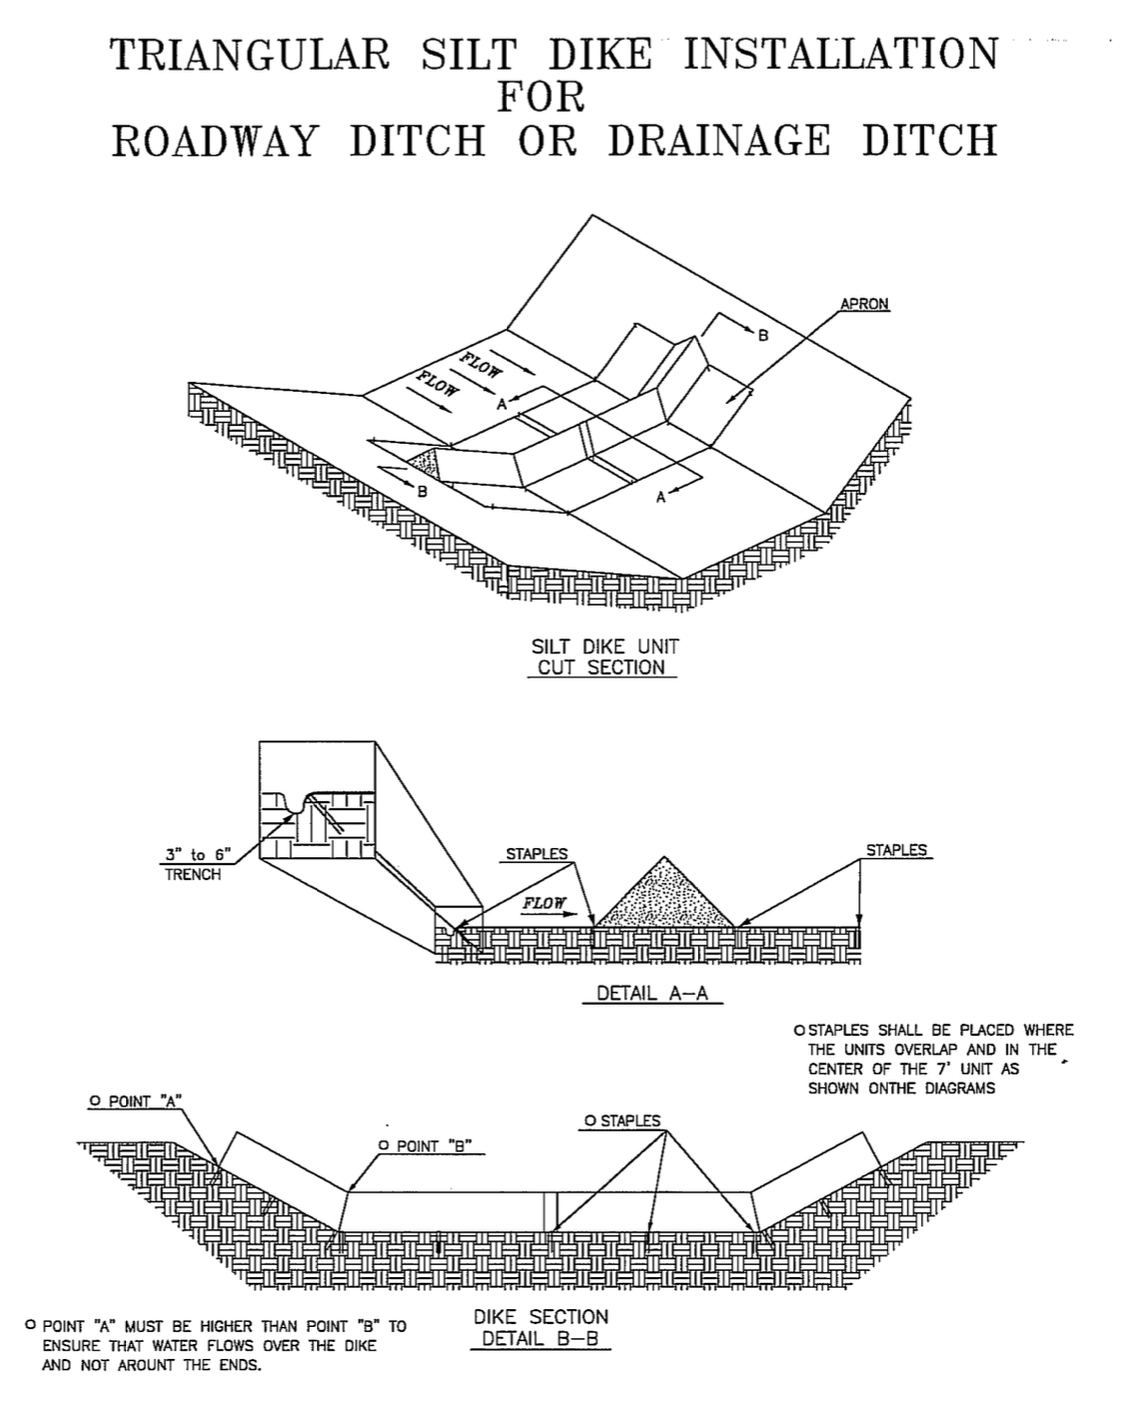
Figure CS-16 – Swale configuration detail (Source: AHTD, 2001)
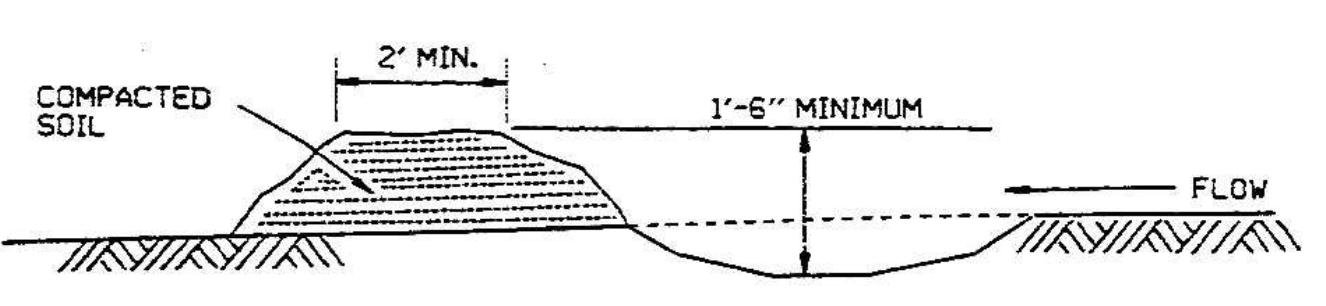
Limitations
Excessive flow rates can cause scour in the swale; therefore requiring a sediment control pond at the end of the swale.
In the event that the dike over flows during larger storm events, the site can be damaged and excessive erosion and sediment transport can occur.
Maintenance Requirements
The swale shall be cleared of debris and excessive vegetation as required.
Figure CS-18 – Water Bar installation (Source: Minnesota – DNR 1998)
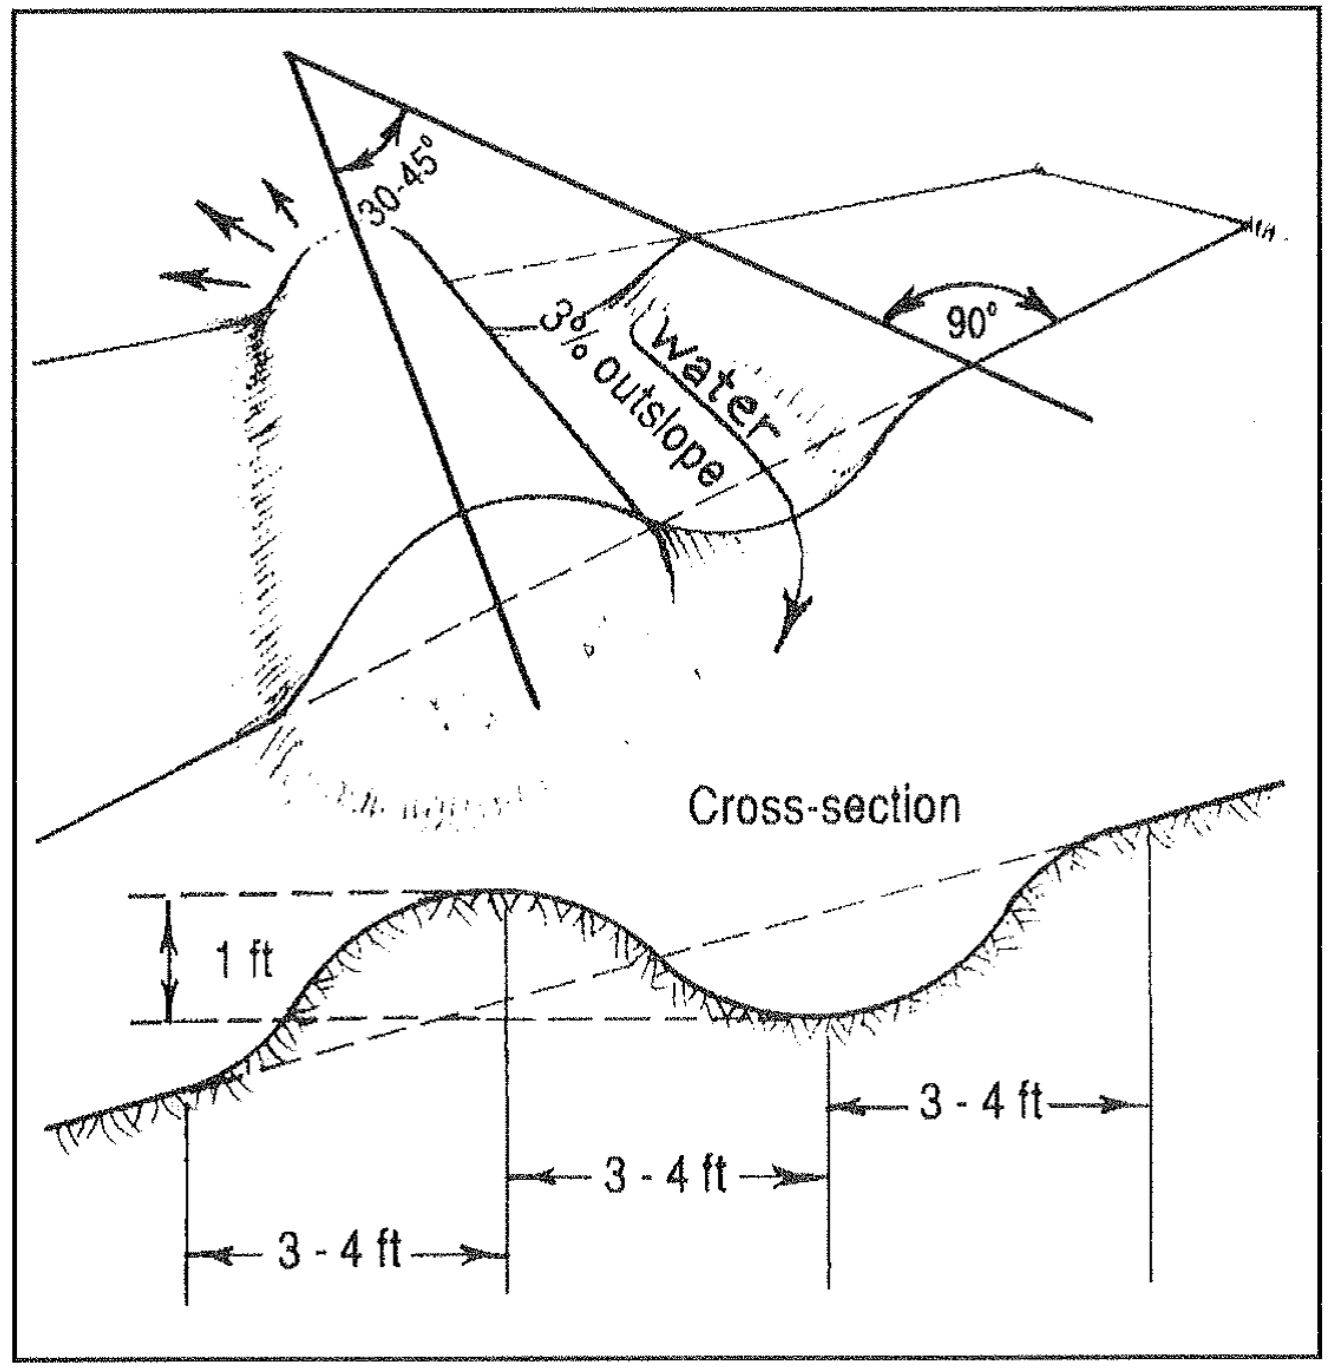
4.1.1. Description
An extended dry detention basin is designed to collect the runoff from smaller, more frequent rainfall events and release the runoff over a longer period of time. An extended dry detention basin collects and treats the “first flush” runoff which frequently has a higher concentration of pollutants typically found in urban runoff. The extended dry detention basin is an adaptation of the more typical detention basin used for flood control. The primary difference is the outlet design. Extended dry detention basins are considered to be "dry" because they are designed to not have a significant permanent pool of water remaining between storm runoff events. An extended dry detention basin can be used for regional or on-site treatment and as follow-up treatment in series with other BMPs.
Photograph WQ-1 – Example of a dry detention basin.
Properly designed and maintained an extended dry detention basin can be a site amenity.
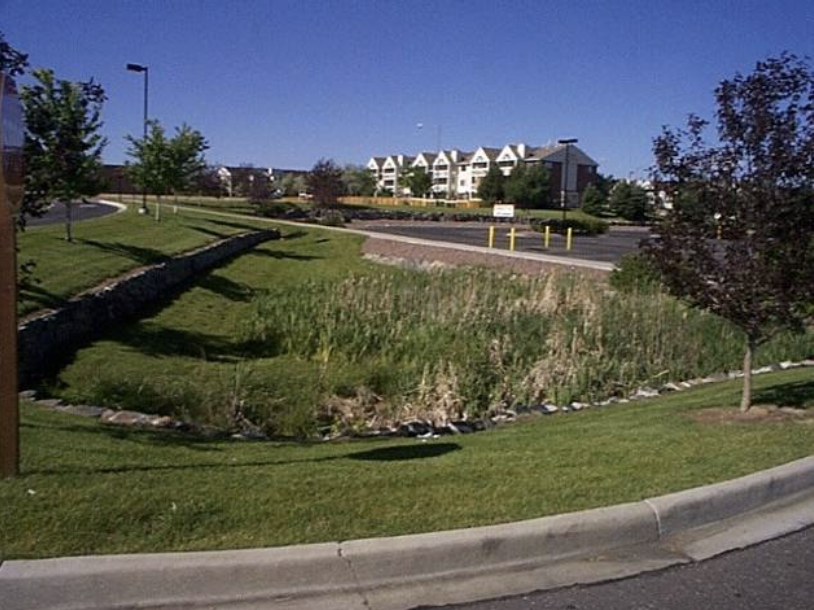
An extended dry detention basin is typically designed and maintained to pool water for not less than 24 hours and for no more than the design drawdown time of 48 hours. Extended dry detention basins will need to conform to the plantings requirements outlined in Chapter 5 – Detention Design for dry detention basins alike. In cases where there is a sufficient distance between the extended dry detention basin and the nearest residential land use (150 feet or more), it may be desirable to allow pools to form and wetland vegetation to grow. These plants generally provide water quality benefits through pollutant uptake, but often generate public complaints when located near a residential area. In addition, the bottom of an extended dry detention basin will be the depository of all the sediment that settles out in the basin and, as a result, can be muddy and may have an undesirable appearance. To mitigate this problem, the designer may provide a small wetland marsh or ponding area in the basin’s bottom, which may be incorporated as part of the design to promote biological uptake of certain pollutants.
In addition to reducing peak runoff rates and improving water quality, an extended dry detention basin can be designed to provide other benefits such as recreation, wildlife habitat and open space. Extended dry detention basins may also be used during land development activities to trap sediment from construction activities within the tributary drainage area. The accumulated sediment, however, must be removed after upstream land disturbances cease and before the basin is placed into final long-term use. As with other BMPs, public safety issues need to be addressed through proper design.
4.1.2. Design Considerations
Major considerations for the design of an extended dry detention basin are summarized below:
Space requirements - It is imperative to plan land use correctly to account for an extended dry detention basin. The land required for an extended dry detention basin is approximately 0.5 to 2.0 percent of the total tributary development area, depending on DCIA and other factors.
Presence of groundwater or baseflow- Special consideration must be made when placing an extended dry detention basin in an area of high groundwater, wet weather springs or areas that otherwise have baseflow. Consideration shall be given to constructing an extended wet detention basin or a wetland bottom in those cases. Sites with persistent flow require a special design by a Professional Engineer registered in the State of Arkansas to appropriately address the unique conditions of the site.
Flood control considerations- Extended dry detention basins shall be incorporated into the larger flood control basin whenever possible. In all cases, the embankments and spillway shall be designed to safely pass the 100-year flow as described in Chapter 5 – Detention Design.
Geology and soils - Soil maps should be consulted, and soil borings may be needed to establish geotechnical design parameters, particularly for cases such as deeper basins or when bedrock or other sensitive geologic features, such as karst formations, are believed to be present. A regular concern with storage basins in Rogers is “puncturing” limestone during the course of excavation, thereby providing a conduit for stormwater into the shallow groundwater system. A map of the Karst Formation/Cave Spring recharge area is provided in Figure WQ-2. Development within the recharge area shall be coordinated with the United States Fish and Wildlife Service (USFWS). The USFWS is responsible for enforcing specific development restrictions to protect resources within the recharge area.
Figure WQ-2 Karst Formation/Cave Springs Recharge Area
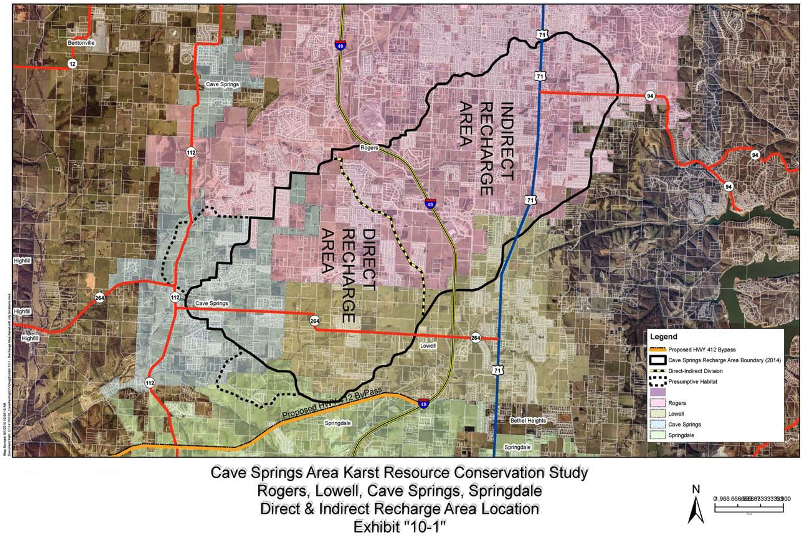
Inundation of open space - When multiple uses such as recreation or habitat creation are incorporated into a detention basin, a multiple-stage design shall be used to limit the frequency of inundation of passive recreational areas. Generally, the area within the WQCV is not well suited for active recreation facilities such as ballparks, playing fields, and picnic areas. These are best located above the WQCV pool level as part of the flood control basin.
Maintenance access - Access to critical elements of the pond, such as the inlet, outlet, spillway, and sediment collection areas must be provided for maintenance purposes. The access must have a maximum grade of 10 percent and have an all-weather solid driving surface composed of gravel, crushed rock, concrete, or reinforced turf. An access easement shall be provided if the pond’s drainage easement does not adjoin a public right-of-way.
4.1.3. Design Procedure and Criteria
The following steps outline the design procedure and criteria for an extended dry detention basin. Figure WQ-3 shows a representative layout of an extended dry detention basin. The Extended Dry Detention Basin (EDB) Worksheet in the BMP Spreadsheet will aid in the design procedure discussed below.
- Calculate design volume -Calculate the design volume, V, in ft3 as follows (a multiplier of 1.25 is applied to account for sediment accumulation):
 (Equation WQ-1)
In which:
WQCV = Water Quality Capture Volume, ft3 (see Section 3.2 for calculation methodology)
This design volume accounts only for water quality and not for flood control. - Basin length:width ratio - The basin length to width ratio (L:W) shall be between 2:1 and 4:1, and the inlets shall be as far as possible from the outlet. Maximizing the distance between the inlet and the outlet and shaping the pond with a gradual expansion from the inlet, and a gradual contraction toward the outlet will minimize short-circuiting. It the minimum 2:1 ratio cannot be met or the outlet is near the inlet, an alternate means to prevent short-circuiting shall be provided.
- Basin side slopes - Basin side slopes shall be a maximum of 3H:1V. The use of flatter slopes is encouraged to facilitate maintenance, access, and safety. In addition, incorporate a flatter upper zone and/or a “safety bench” (a flatter zone near the edge of the pond). The safety bench shall extend outward from the pond edge for a minimum distance of 10 feet, with a maximum slope of 5% and maximum water depth of 18 inches.
- Basin geometry - Determine the preliminary basin geometry necessary to provide the design volume. Select the preferred depth of the extended dry detention basin, then solve for the basin bottom width that will provide adequate storage of the design volume. Assume a trapezoidal pond with the selected L:W ratio, side slopes, and basin depth. The EDB Worksheet will assist with this calculation.
- Outlet structure - Design the outlet structure to release the WQCV (not the “design volume” [V] from Step 1) over a 48-hour period. Outlet structures shall consist of a perforated plate with a stainless steel well-screen or aluminum bar trash rack. Figure WQ-4 shows details for a perforated plate outlet structure. The EDB Worksheet in the BMP Spreadsheet provides a useful tool for designing the outlet structure and perforation geometry.
Table WQ-1
Requirements for Water Quality Outlet StructuresParameter
Perforated Plate Requirement
Minimum perforation diameter
2 inches
Maximum perforation diameter
4 inches
Minimum number of holes per row
1
Maximum number of holes per row
8
Minimum row spacing
4 to 8 inches 1
Maximum row spacing
12 inches
Minimum riser pipe diameter
n/a
1 The minimum row spacing for a perforated plate varies based on the perforation diameter.
For perforated plates, select the perforation diameter, number of holes per row, row spacing and total number of rows to meet the requirements in Table WQ-1. Use the fewest number of columns possible to maximize the perforation diameter. This helps to reduce clogging problems. The EDB Worksheet will calculate the resulting drain time based on the perforation geometry selected. The perforation geometry shall then be modified as necessary to achieve an acceptable drain time. - Trash rack - For perforated plates, provide a trash rack of sufficient size to prevent clogging of the primary water quality outlet. Size the rack so as not to interfere with the hydraulic capacity of the outlet. Using the total outlet area (calculated by multiplying the perforation area per row by the number of rows) and the selected perforation diameter, Figure WQ-5 can be used to determine the minimum open area required for the trash rack. Use one-half of the total outlet area to calculate the trash rack’s size. This accounts for the variable inundation of the outlet orifices. The trash rack shall extend 24 inches below the lowest perforation and a micro-pool shall be provided. The micro-pool is a small area of ponded water adjacent to the outlet that provides a flow path for water to discharge when the trash rack becomes clogged with floating trash and debris (see Figure WQ-3). The volume of the micro-pool shall be greater than or equal to 5 percent of the WQCV. The EDB Worksheet provides a useful tool to complete the trash rack design.
- Freeboard - A freeboard of at least 12 inches shall be provided above the 100-year water surface elevation for all extended dry detention basins (including facilities that are solely for water quality purposes and allow larger flows to “pass through”) and detention areas in accordance with Chapter 5 – Detention Design.
- Low flow channel - A low flow channel may be required when groundwater or base flow exists in the basin or as required in Chapter 5 – Detention Design.
- Vegetation types – Plantings will need to be provided as required in Chapter 5 – Detention Design. Consideration shall be given to the use of native grasses and plants for pond bottoms, berms, and side slopes. However, the species selected shall be water tolerant in areas where periodic inundation is anticipated. It may be desirable to consult a plant specialist when selecting the appropriate type of vegetation. A list of plant species for different portions of an extended dry detention basin is provided in Table WQ-2.
- Maintenance access - Access to the facility shall be provided for maintenance. Grades of the access shall not exceed 10 percent, and a stabilized, all-weather driving surface must be provided.
- Energy dissipation The required quantity of the WQCV can be reduced through the use of BMPs that minimize the DCIA at a site. Such BMPs promote infiltration and reduce the runoff volume from a site. These BMPs also serve to filter runoff that does leave the site. Three BMPs that can be used to reduce the necessary WQCV include:
. Permeable pavers
. Vegetated filter strip/grass swale
. Grass swale - Combination of water quality and flood control facilities - Cmbining the water quality facility with a flood control facility is acceptable. Design of the flood control volume may assume the extended dry detention basin is dry at the beginning of the storm. Additional information can be found in Chapter 5 – Detention Design.
- Neighborhood compatibility - Plan and design the facility with appearance and neighborhood compatibility as design objectives.
- Forebay - A forebay, while optional, should be considered when the design volume exceeds 20,000 ft3 or a large sediment, trash, or debris load is anticipated due to upstream land use. A forebay provides an opportunity for larger particles to settle out in the inlet area, which has a solid surface bottom to facilitate mechanical sediment removal. The forebay volume for the extended dry detention basin should be between 3 and 5 percent of the design volume. Outflow from the forebay to the basin shall be through a gravel filter designed to be stable under maximum design flow conditions. The top of the gravel filter shall be set equal to the stage of the design volume. The floor of the forebay shall be concrete and contain a low flow channel to define sediment removal limits. Assure that good, long term access to the perimeter of the forebay is provided, including necessary easements.
Table WQ-2 Suggested Plant List for Extended Dry Detention Basins
Basin Area | Plant Species | Plant Species | Planting Guidelines |
|---|---|---|---|
Micro-pool | Equisetum hyemale | Horsetail/Scouring Rush | 1 gal., plant 30” O.C. |
Typha Angustifolia | Narrow-leaved Cattail | 1 gal., plant 30” O.C. | |
Pontederia cordata | Pickeral Weed | 1 gal., plant 30” O.C. | |
Scirpus zebrinus | Zebra Rush | 1 gal., plant 30” O.C. | |
Pond Bottom | Juncus effuses | Soft Rush | 1 gal., plant 18” O.C. |
Acourus calamus | Sweet Flag | 1 gal., plant 18” O.C. | |
Carex stricta ‘Bowles Golden’ | Bowles Golden Sedge | 1 gal., plant 24” O.C. | |
Caltha palustris | Marsh Marigold | 1 gal., plant 24” O.C. | |
Peltandra virginica | Arrow Arum | 1 gal., plant 24” O.C. | |
Equisetum hyemale | Horsetail/Scouring Rush | 1 gal., plant 30” O.C. | |
Typha Angustifolia | Narrow-leaved Cattail | 1 gal., plant 30” O.C. | |
Interior sideslopes | Juncus effuses | Soft Rush | 1 gal., plant 18” O.C. |
Acourus calamus | Sweet Flag | 1 gal., plant 18” O.C. | |
Carex stricta ‘Bowles Golden’ | Bowles Golden Sedge | 1 gal., plant 24” O.C. | |
Caltha palustris | Marsh Marigold | 1 gal., plant 24” O.C. | |
Iris ensata | Japanese Iris | 1 gal., plant 12” O.C. | |
Iris fulva | Copper Iris | 1 gal., plant 15” O.C. |
4.1.4. Maintenance
Maintenance shall be performed regularly to clean out the extended dry detention basin (or forebay if one is present) when sediment accumulates to a depth of 6 inches. A depth gauge shall be installed at the outlet and will help to facilitate determining when sediment removal is necessary. See Chapter 5 – Detention Design for depth gauge requirements. Also, appearance may dictate more frequent cleaning.
Maintenance may also be necessary to repair areas of erosion or to remove excessive trash, or debris or sediment clogging the outlet. Design grades must be maintained to ensure shallow ponding does not occur, particularly when within 150 feet or less of residential areas.
Figure WQ-3 Plan and Profile of an Extended Dry Detention Basin
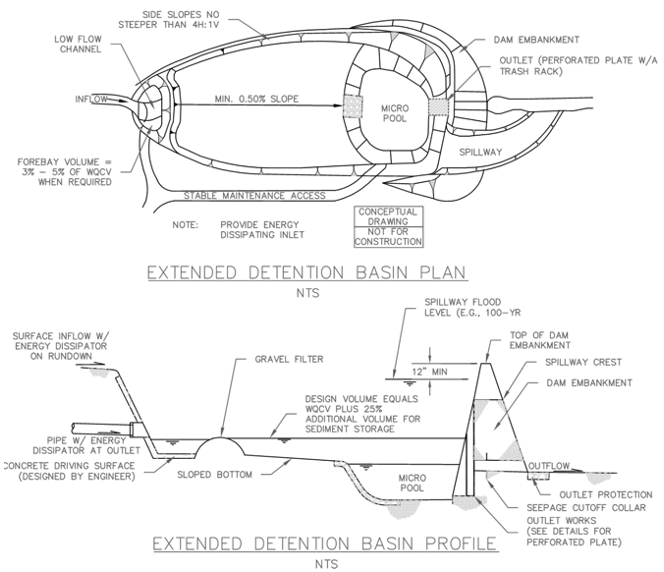
Figure WQ-4 Details for a Perforated Plate and Trash Rack
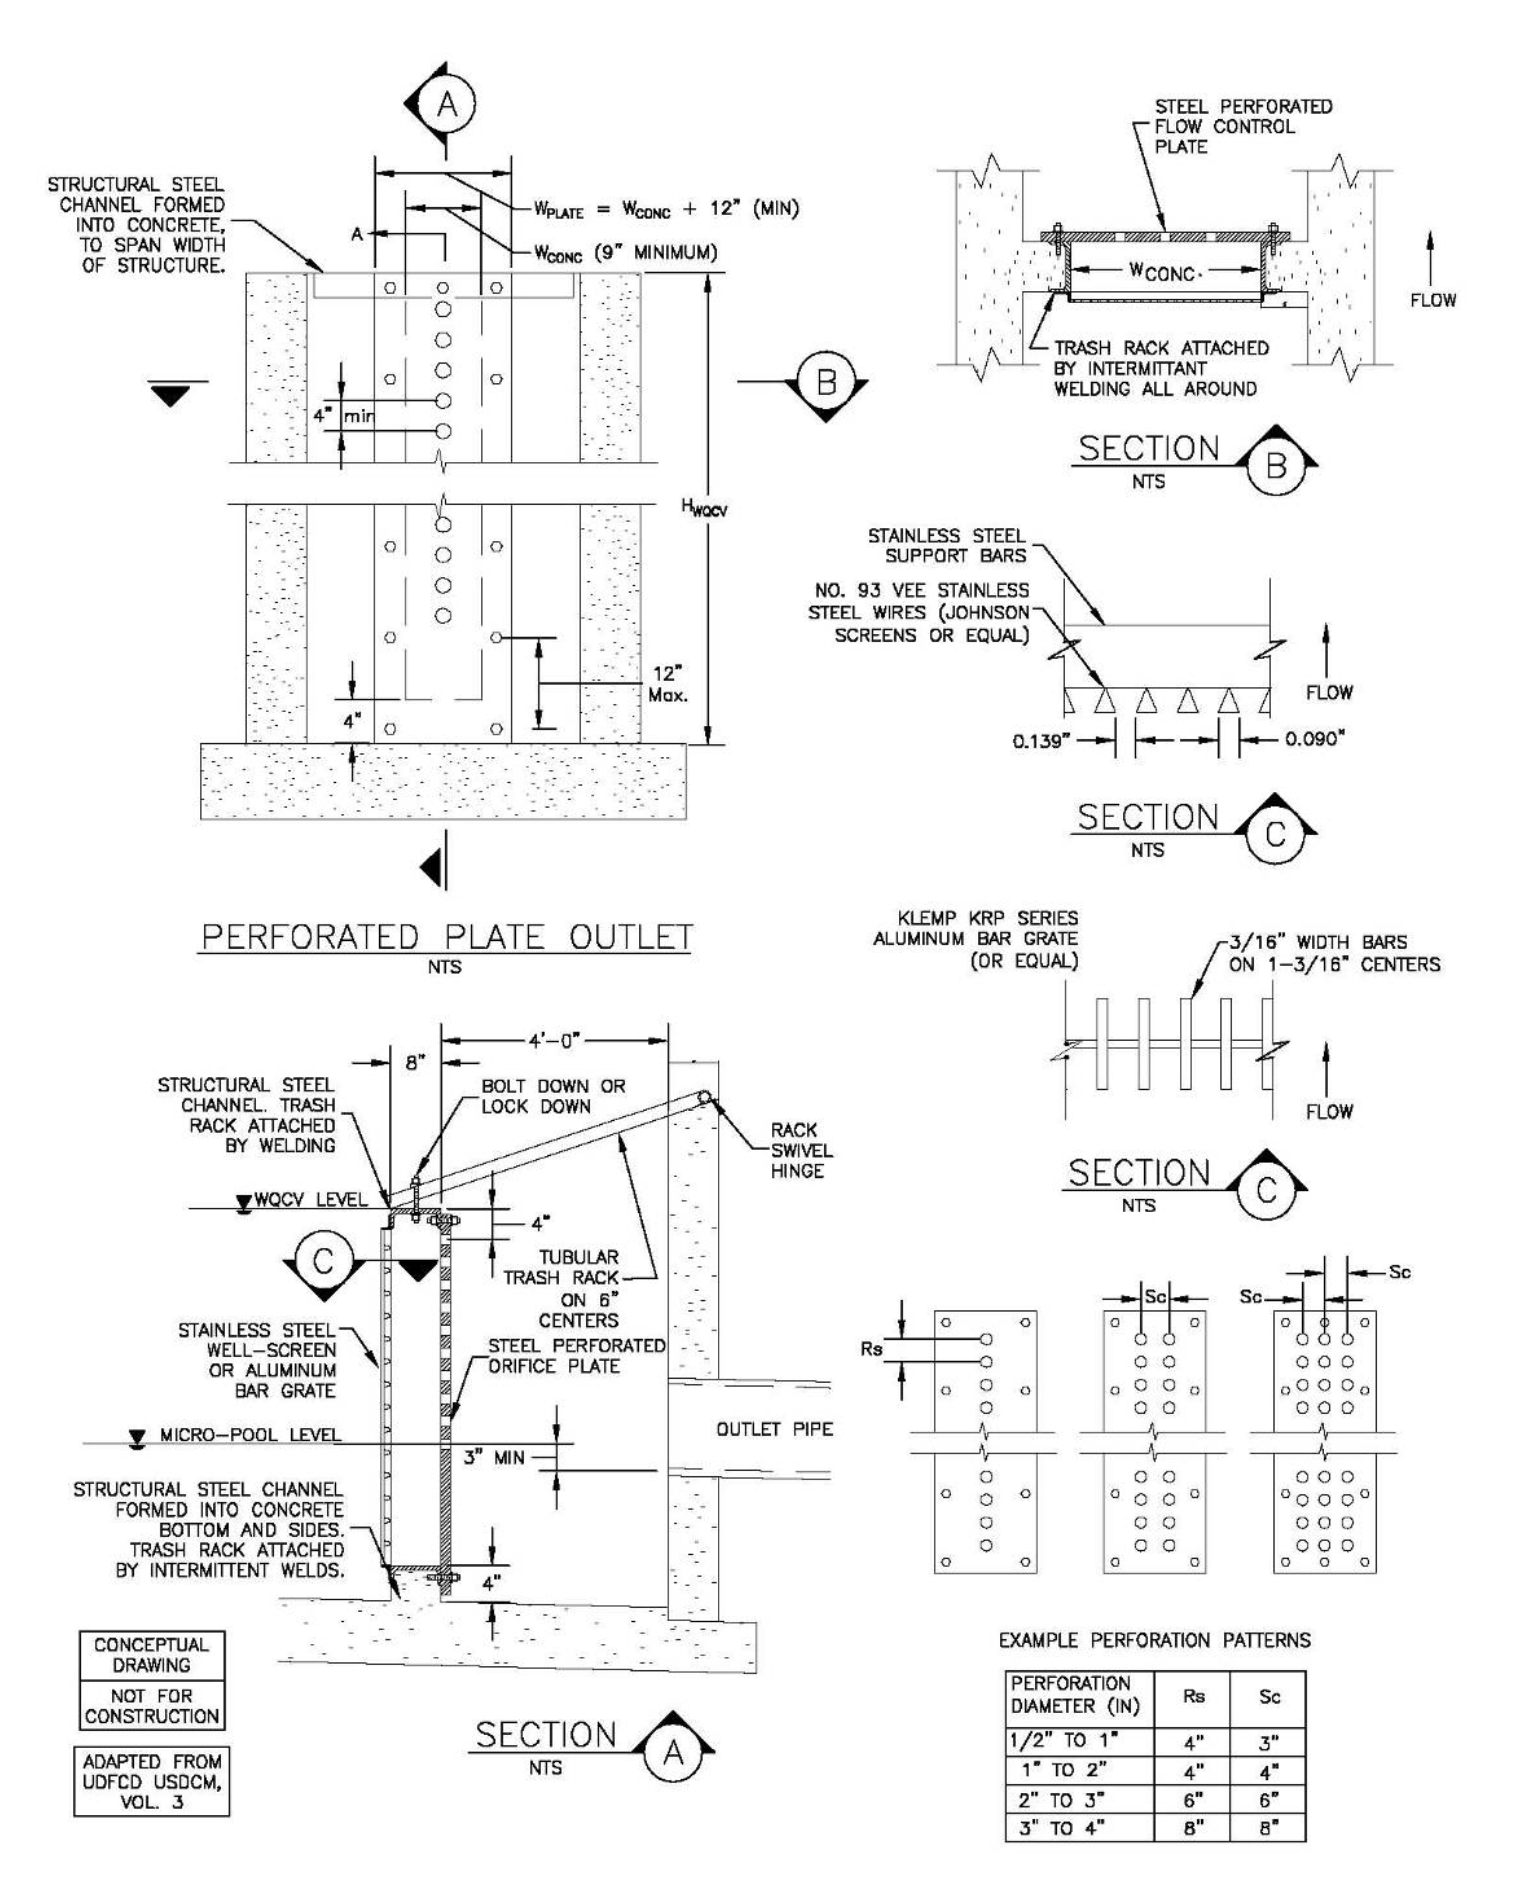
Figure WQ-5 Trash Rack Sizing
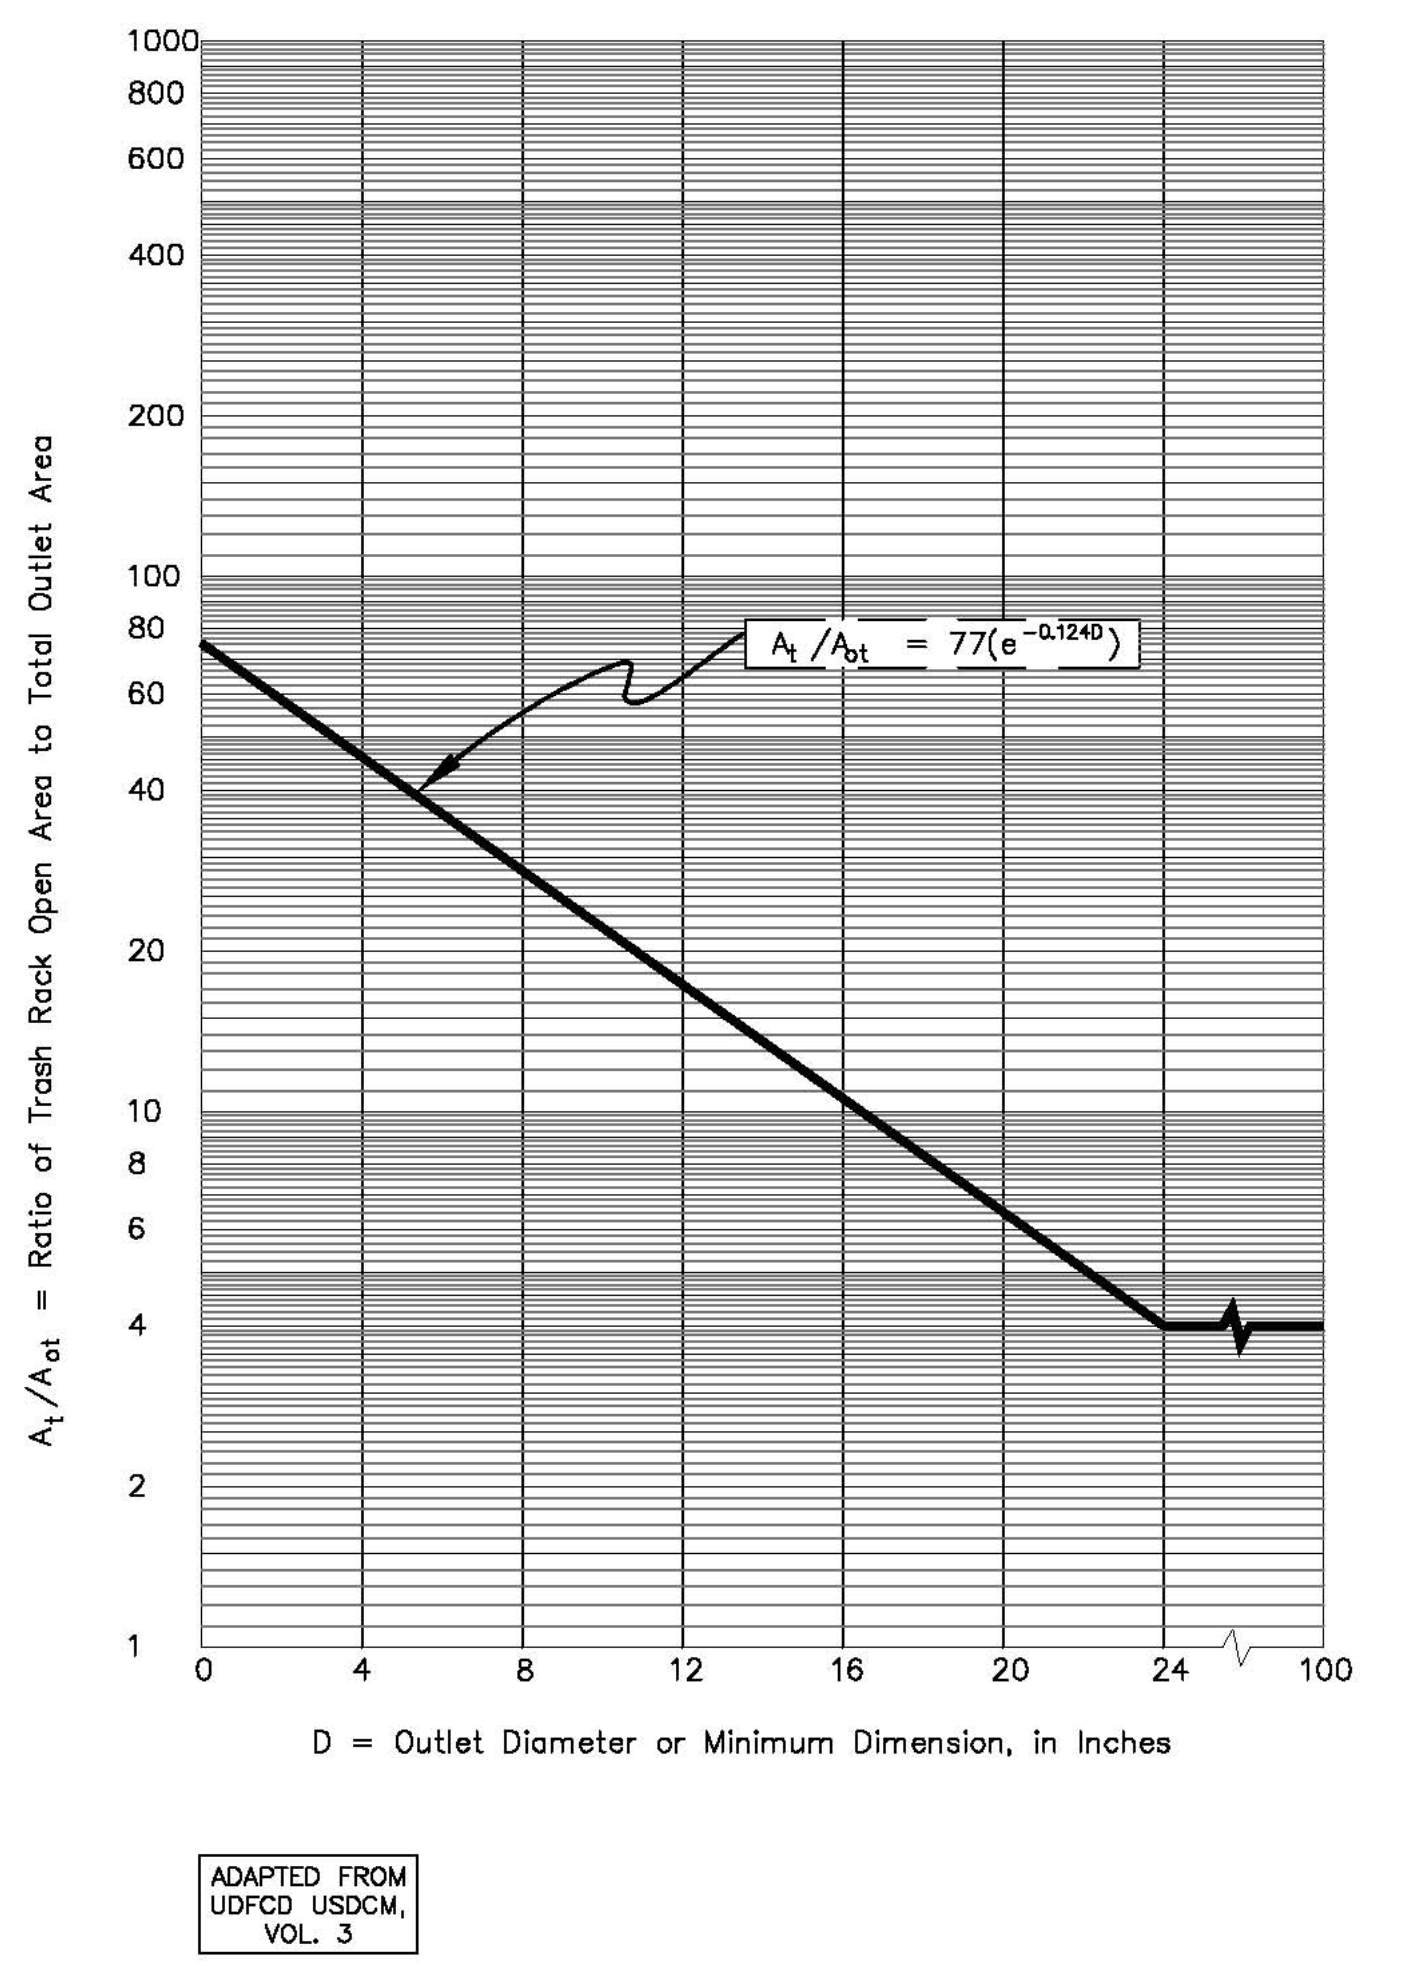
4.1.5. Extended Dry Detention Basin Design Example
The following example demonstrates use of the Extended Dry Detention Basin (EDB) Worksheet in the BMP Spreadsheet.
Given: The contributing watershed area is 51.37 acres and the land use type is residential (1/2 acre lot size). Approximately 7.7 acres (15% of the site) are impervious areas.
Determine: Basin volume, basin geometry, outlet structure characteristics, trash rack characteristics and forebay characteristics, if applicable.
Worksheet Data Input
The user selects various input parameters as part of the basin and outlet structure design. Watershed, basin, and outlet characteristics are entered into the input cells in the EDB Worksheet.
Watershed Characteristics – User Inputs
Watershed area = 51.37 acres (given)
The WQCV required is calculated for a facility with a 48 hour drain time using the method described in Section 3.2 of this chapter or using the WQCV Worksheet in the BMP Spreadsheet.
The WQCV value (27,223 ft3) is used as an input to the worksheet to calculate the minimum design volume for the EDB (Minimum design volume = WQCV * 1.25).
Preliminary Basin Geometry – User Inputs
The preliminary basin geometry consists of a trapezoidal basin with the following characteristics:
Basin length to width ratio, L:W = 3.0
Basin side slope, Z = 4.0 feet/feet (ft/ft)
Basin Depth, D = 2.0 ft
Water Quality Outlet Structure – User Inputs
To determine the perforation geometry of the plate that will drain the WQCV in 24 to 48 hours, it is necessary to use an iterative process that varies the perforation diameter, number of holes per row, and row spacing. It is recommended that the designer use the fewest number of holes per row in order to maximize the perforation diameter and reduce the potential for clogging. The final perforation geometry selected is shown below:
Perforation diameter, dperforation = 1.0 inch
Number of holes per row, nholes per row = 5
Row spacing, Rs = 4 inches
Pre-sedimentation Forebay Basin – User Inputs
The optional forebay volume should be between 3 and 5 percent of the WQCV. This results in a volume between 1,021 and 1,702 ft3. For this example, a volume of 1,500 ft3 was selected and a gravel filter forebay outlet and a concrete floor are included.
Forebay volume = 1,500 ft3
Results
Results of the analysis are displayed in the EDB Worksheet (see sample worksheet following this design example). The results indicate an extended detention basin with the following characteristics:
- Basin bottom width = 70 ft
- Basin bottom length = 210 ft
- Calculated Design Volume = 34,136 ft3
- Number of rows = 6 (based on row spacing and depth of WQCV)
- Outlet area per row = 3.93 square inches
- Total outlet area = 23.56 square inches
- Drain time for WQCV = 45.3 hours
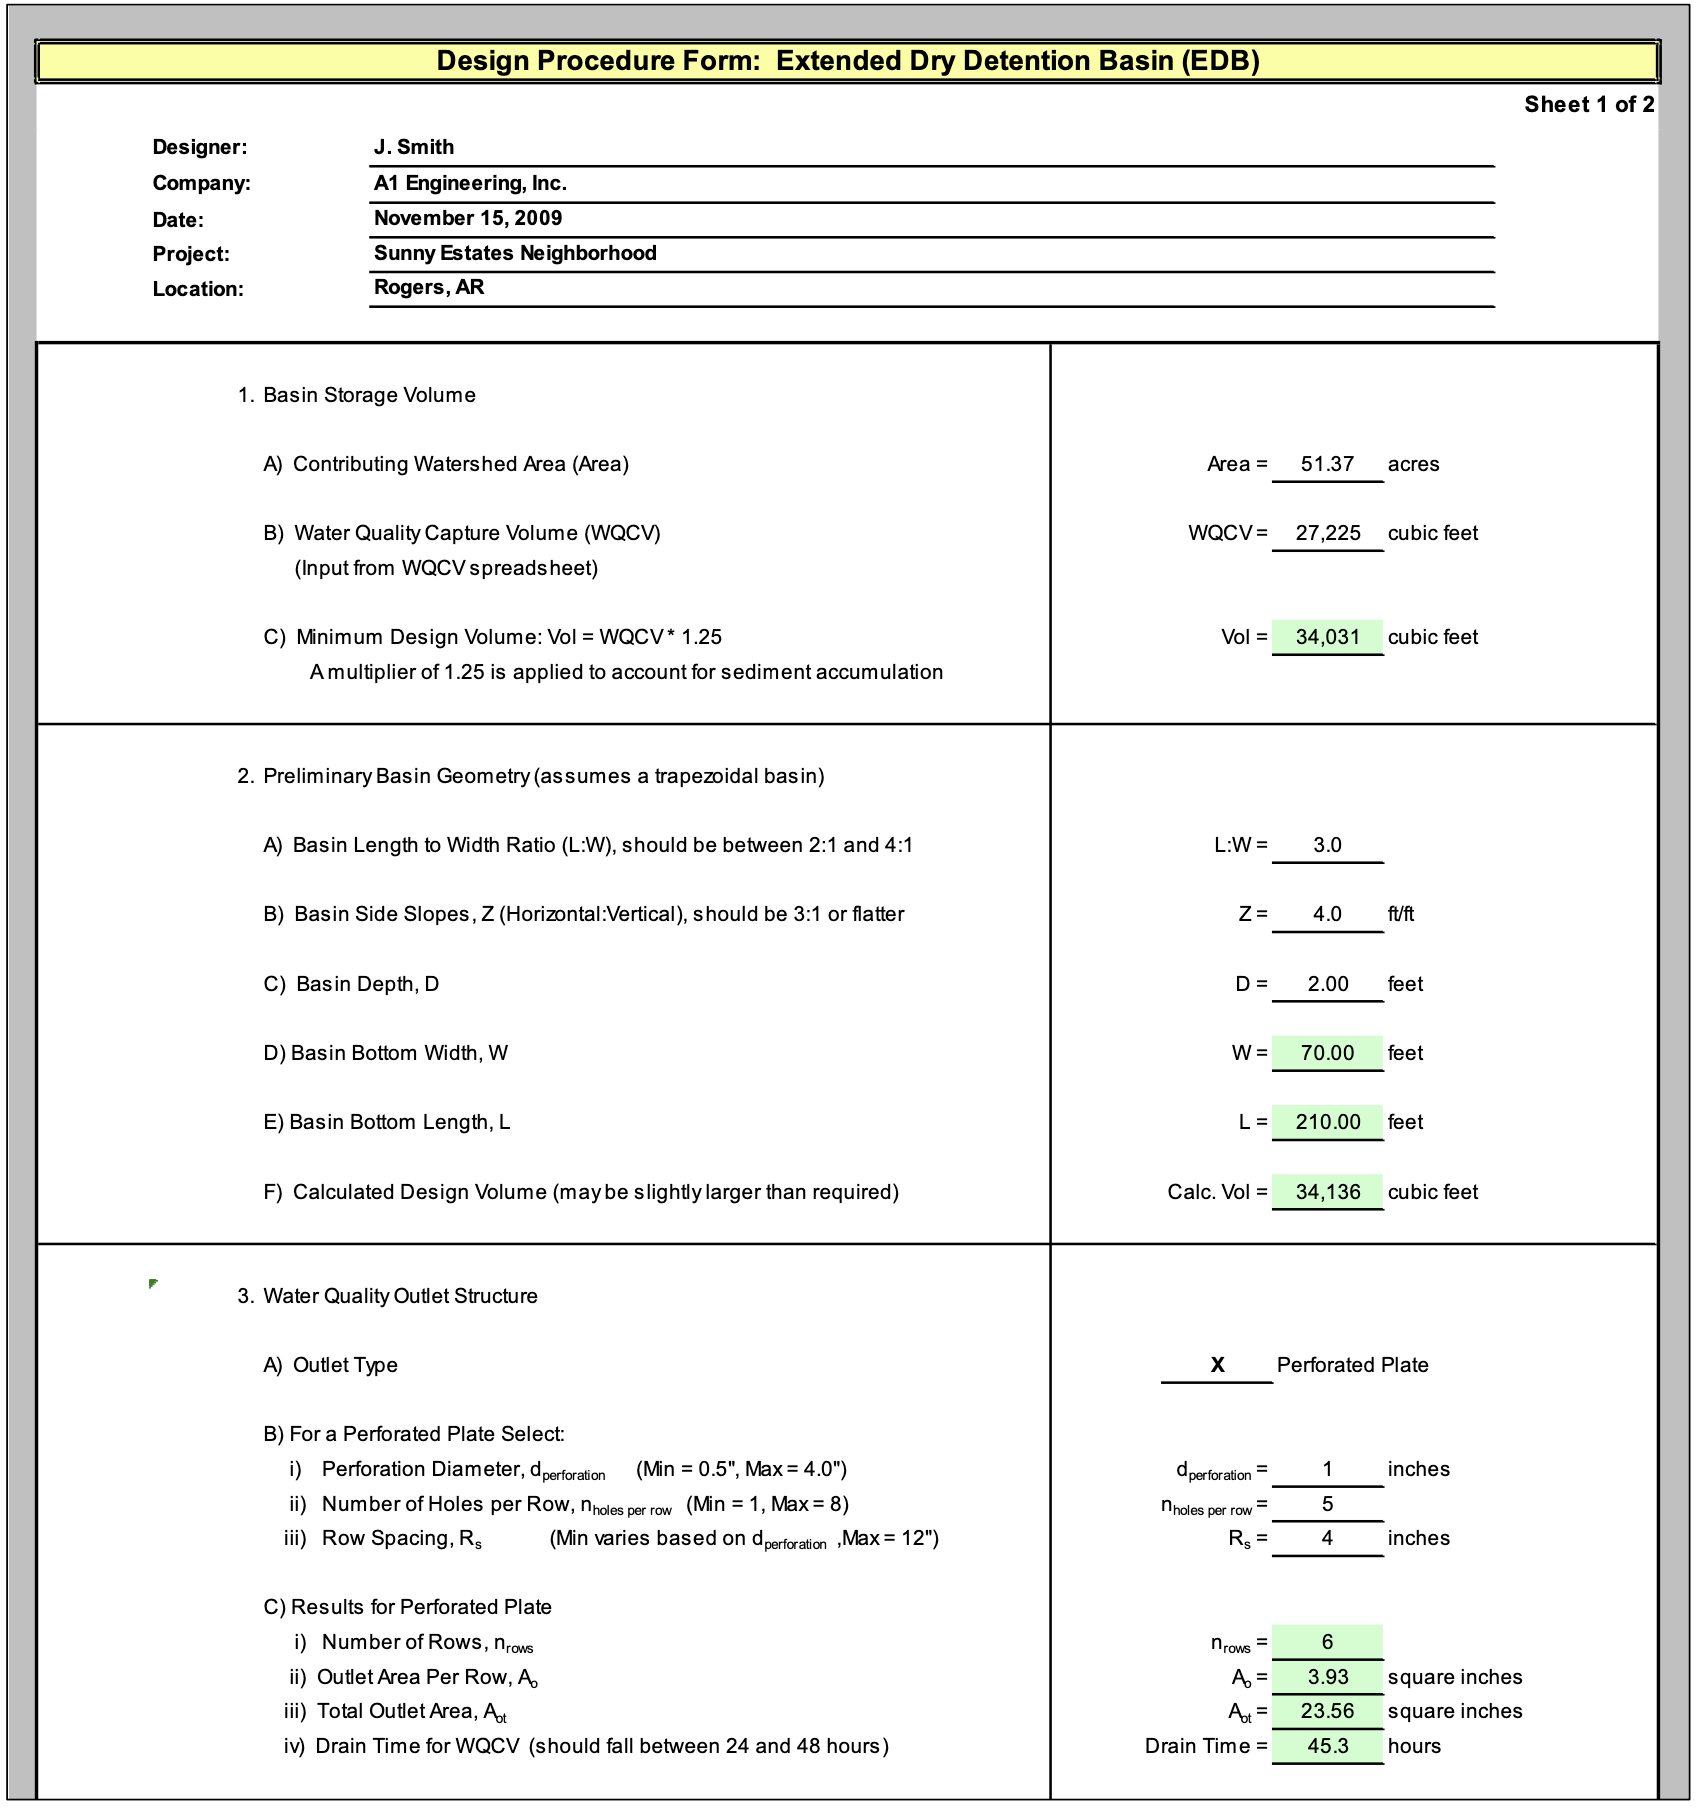
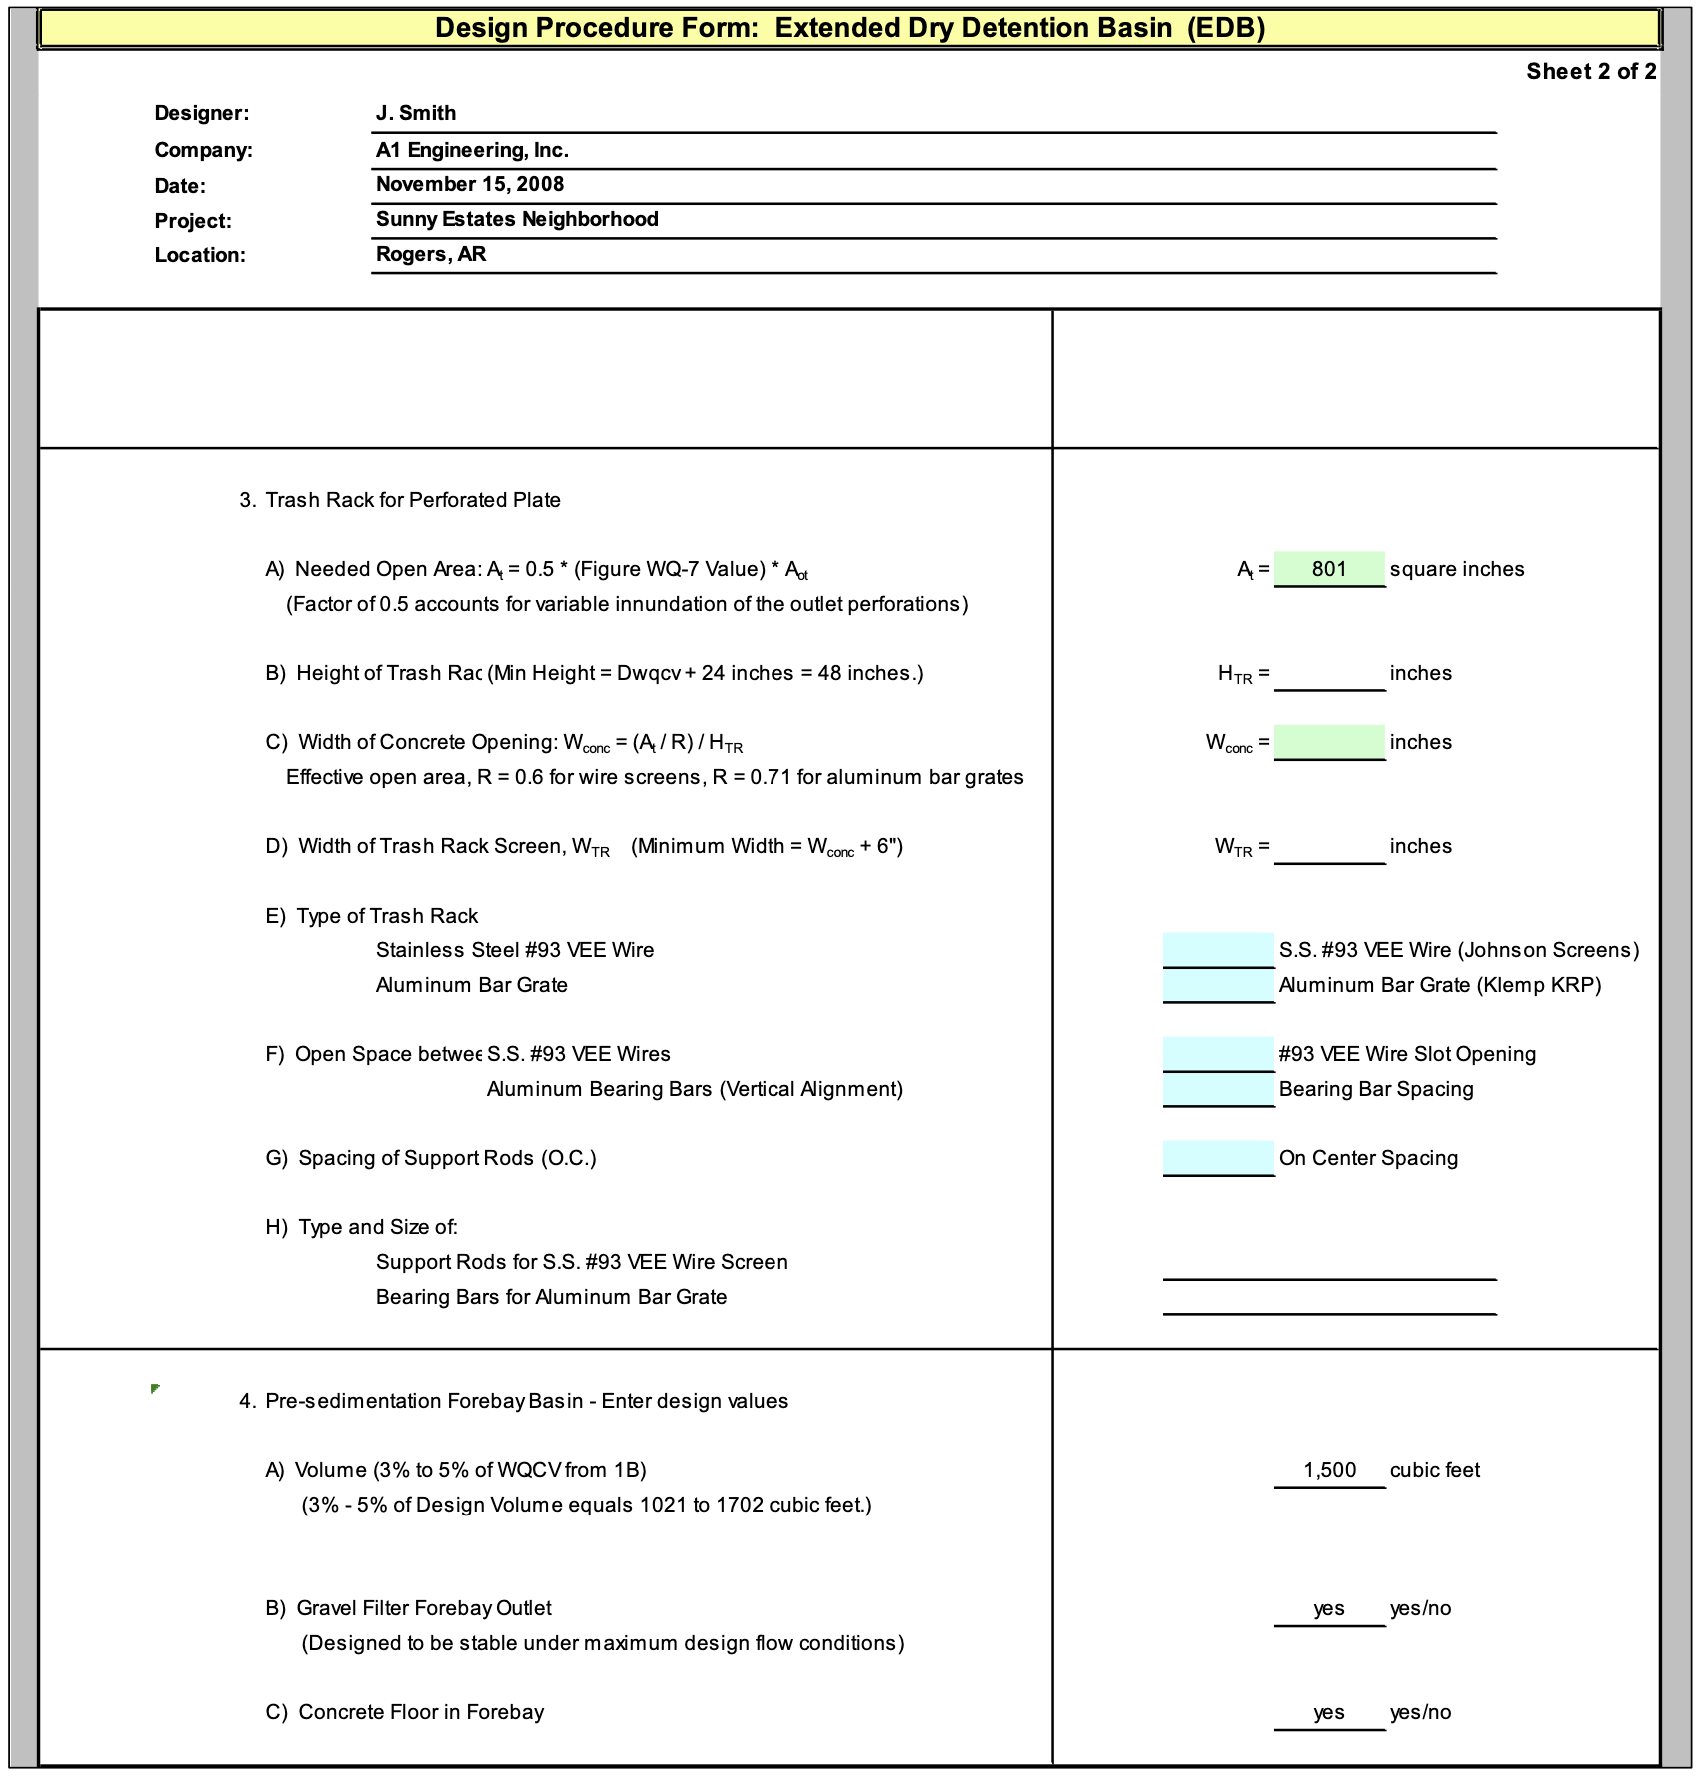
4.2.1. Description
An extended wet detention basin differs from and extended dry detention basin because it is designed with a permanent pool, which provides water quality benefits as the influent water mixes with the permanent pool water and most of the sediment deposits remain in the permanent pool zone. Similar to an extended dry detention basin, an extended wet detention basin is designed to collect the runoff from smaller, more frequent rainfall events and release the runoff over a longer period of time. The design collects and treats the “first flush” runoff, which frequently has a higher concentration of most pollutants found in urban runoff. Like an extended dry detention basin, an extended wet detention basin can be used for regional or on-site treatment and as follow-up treatment in series with other BMPs.
An extended wet detention basin provides a similar level of water quality treatment due to the permanent pool compared to an extended dry detention basin, but in less time because the outflow occurs above the bottom of the basin and sedimentation continues after the captured surcharge volume is emptied.
Photograph WQ-2 – Example of an Extended Wet Detention Basin.
This extended wet detention basin is aesthetically pleasing and serves as an amenity to the community, in addition to providing water quality benefits.
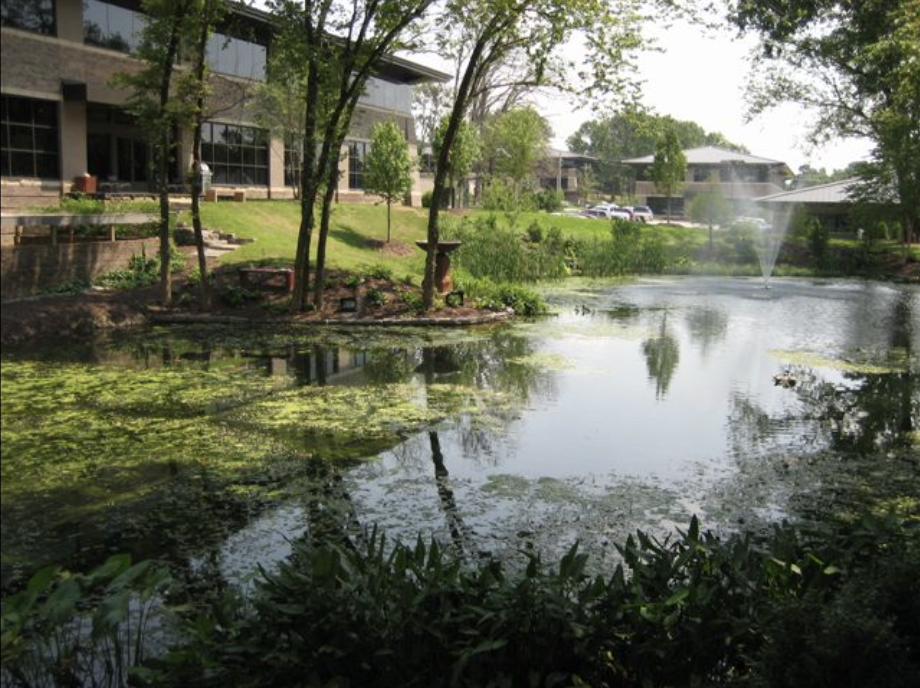
An extended wet detention basin shall be designed with the WQCV above the permanent pool, and the outlet structure shall be sized to drain the WQCV in approximately 12 to 15 hours. The reduced drain time (when compared to the extended dry basin) is due to water quality benefits provided by the permanent pool. Flood control volume may also be provided above the permanent pool by including modified outlet controls, a minimum of 1 foot of freeboard above the 100-year water surface, and a 100-year (minimum) overflow spillway.
Extended wet detention basins can be very effective in removing pollutants and, when properly designed and maintained, can satisfy multiple objectives such as the creation of wildlife habitats; provision of recreational, aesthetic, and open space opportunities; and inclusion into a larger, regional flood control basin. An extended wet detention basin must be carefully designed and maintained to address safety concerns, bank erosion, sediment removal, and upstream and downstream impacts to waterways. In addition, extended wet detention basins have the potential for floating litter, debris, algae growth, nuisance odors, and mosquito problems. Aquatic plant growth can be a factor in clogging outlet works, and the permanent pool can attract waterfowl, which can add to the nutrient and bacteria loads entering and leaving the pond. Design considerations for an extended wet detention basin are described below in Section 4.2.2.
Refer to Chapter 5 – Detention Design for additional design criteria.
4.2.2. Design Considerations
Major considerations for the design of an extended wet detention basin are summarized below:
Basin volume - The total basin volume of an extended wet detention basin facility consists of: 1) the permanent pool volume, 2) the WQCV above the permanent pool, and 3) the flood control volume above the WQCV (if included). Care shall be taken to assess the complete water budget of the watershed accounting for runoff, baseflow, evaporation, evapotranspiration, seepage, and other losses to assure the permanent pool can be maintained.
Design considerations unique to an extended wet detention basin - In addition to the considerations typically given to an extended dry detention basin, design considerations for an extended wet detention basin include:
- Water balance calculations shall be conducted (including inflow, outflow, evaporation, and subsurface flows in and out of the pond) to assure there is adequate flow to maintain a desirable permanent pool and provide adequate flushing through the basin.
- Edge treatments that will prevent bank erosion must be considered and described in the drainage report as well as shown in the plans.
- To minimize the potential of algae growth, a minimum permanent pool depth of 6 feet must be provided. Aeration shall be provided and other upstream BMPs may also be provided. If algae become a problem, then the property owner or Property Owners Association (POA) must demonstrate that a reasonable effort to remedy the condition has been made within one month of being notified by the City.
- Basin lining must be provided to ensure the basin is watertight and a permanent pool will be maintained. This is particularly important where karst geology exists and the potential for a leaky pond is high. Lining ponds in such areas can be difficult and expensive. A map of the Karst formation/Cave Spring recharge area, which has specific development restrictions enforced by the USFWS, is provided on Figure WQ-2.
- The embankments must be carefully designed to prevent seepage and piping that can lead to loss of the permanent pool or dam failure.
- A shorter detention time of 12 to 15 hours may be used due to the inherent sedimentation that occurs in a wet basin.
- A fence surrounding the pond is required unless the pond design incorporates a safety bench. See Chapter 5 – Detention Design.
4.2.3. Design Procedure and Criteria
The following steps outline the design procedure and criteria for an extended wet detention basin. Figure WQ-6 shows a representative layout for an extended wet detention basin. The Extended Wet Detention Basin (EWDB) Worksheet in the BMP Spreadsheet will aid in the design procedure discussed below.
- Residence time - For large ponds, if the residence time for the permanent pool volume is 24 hours or greater during a 2-year, 24-hour storm event, the surcharge WQCV is not required above the permanent pool. The residence time, t (hr), is calculated by dividing the permanent pool volume, Vp (ft3), by the average inflow rate during a 2-year, 24-hour storm event, Q2-yr avg (cfs), as shown in Equation WQ-2. The 2-year, 24 hour average inflow rate is equal to the total event runoff volume divided by the event duration (24 hours). The runoff volume must be calculated using the appropriate hydrologic analysis method presented in Chapter 3 – Determination of Stormwater Runoff.
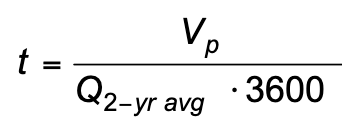 (Equation WQ-2)
 - WQCV (if needed) - If the residence time in the permanent pool is less than 24 hours, the WQCV shall be added above the permanent pool and shall be calculated using the method provided in Section 3.2 of this chapter. The WQCV is the surcharge volume above the permanent pool. Generally, an extended wet detention basin shall be located away from any offsite drainage crossing the site to ensure proper function. If offsite area is drained through the facility, that area must be included in all volume calculations.
- Minimum volume required - The minimum volume required for the permanent pool is a function of the WQCV and is calculated using Equation WQ-3.
 (Equation WQ-3)
The permanent pool shall have a depth of at least 6 feet (and preferably deeper) to decrease the likelihood of algae growth. An option to improve water quality treatment and minimize bank erosion is to provide a littoral zone 18 inches deep and 10 feet wide for aquatic plant growth along the perimeter of the permanent pool. This also serves as a safety bench and enhances pond safety. - Outlet works - The outlet works are to be designed in accordance with requirements set forth in Section 4.1.3, Design Procedure and Criteria for an extended dry detention basin, with the exception being that the outlet works must be designed to release the WQCV over a 12- to 15-hour period.
- Trash rack -The trash rack is to be designed in accordance with requirements set forth in Section 4.1.3, Design Procedure and Criteria for an extended dry detention basin. The trash rack shall extend at least 24 inches below the permanent pool level.
- Basin length:width ratio - The basin length to width ratio shall be between 2:1 and 4:1. Maximizing the distance between the inlet and the outlet will minimize short-circuiting.
- Basin side slopes - Basin side slopes above the permanent pool shall be no steeper than 3:1, preferably 5:1 or flatter to limit rill erosion and facilitate maintenance and safety. A “safety bench” shall be constructed around the pond perimeter to promote safety.
- Establishing vegetation - A 4- to 6-inch organic topsoil layer, vegetated with aquatic species, shall be provided on the littoral bench, if incorporated. Areas of vegetation above the permanent pool shall include water tolerant species in anticipation of periodic inundation.
- Maintenance access - Access to the basin bottom, forebay (if applicable), and outlet area must be provided for maintenance vehicles. Grades of the access shall not exceed 10 percent, and a stabilized, all-weather driving surface must be provided.
- Erosion protection - Provide erosion protection at all inlets to the pond.
- Forebay - A forebay, while optional, should be considered when the design volume exceeds 20,000 ft3 or a large sediment, trash, or debris load is anticipated due to upstream land use. Forebays provide an opportunity for larger particles to settle out at a controlled location where sediment and debris can be more easily removed. Install a solid driving surface on the bottom and sides below the permanent water line to facilitate sediment removal. A berm consisting of rock and topsoil mixture shall be part of the littoral bench to create the forebay. The forebay volume within the permanent pool volume shall be between 5 and 10 percent of the design WQCV.
4.2.4. Maintenance
Intermittent maintenance may be necessary to remove floating trash, debris, and algae from the surface of the permanent pool. If algae become a problem, then the property owner or POA must make a reasonable effort to remedy the condition, such as using chemical treatments. It may also be necessary to remove accumulated sediments from the pond bottom on a regular basis. A maintenance plan with these criteria, at a minimum, shall be recorded as part of the subdivision covenants.
Figure WQ-6 Plan, Profile, and Details of an Extended Wet Detention Basin
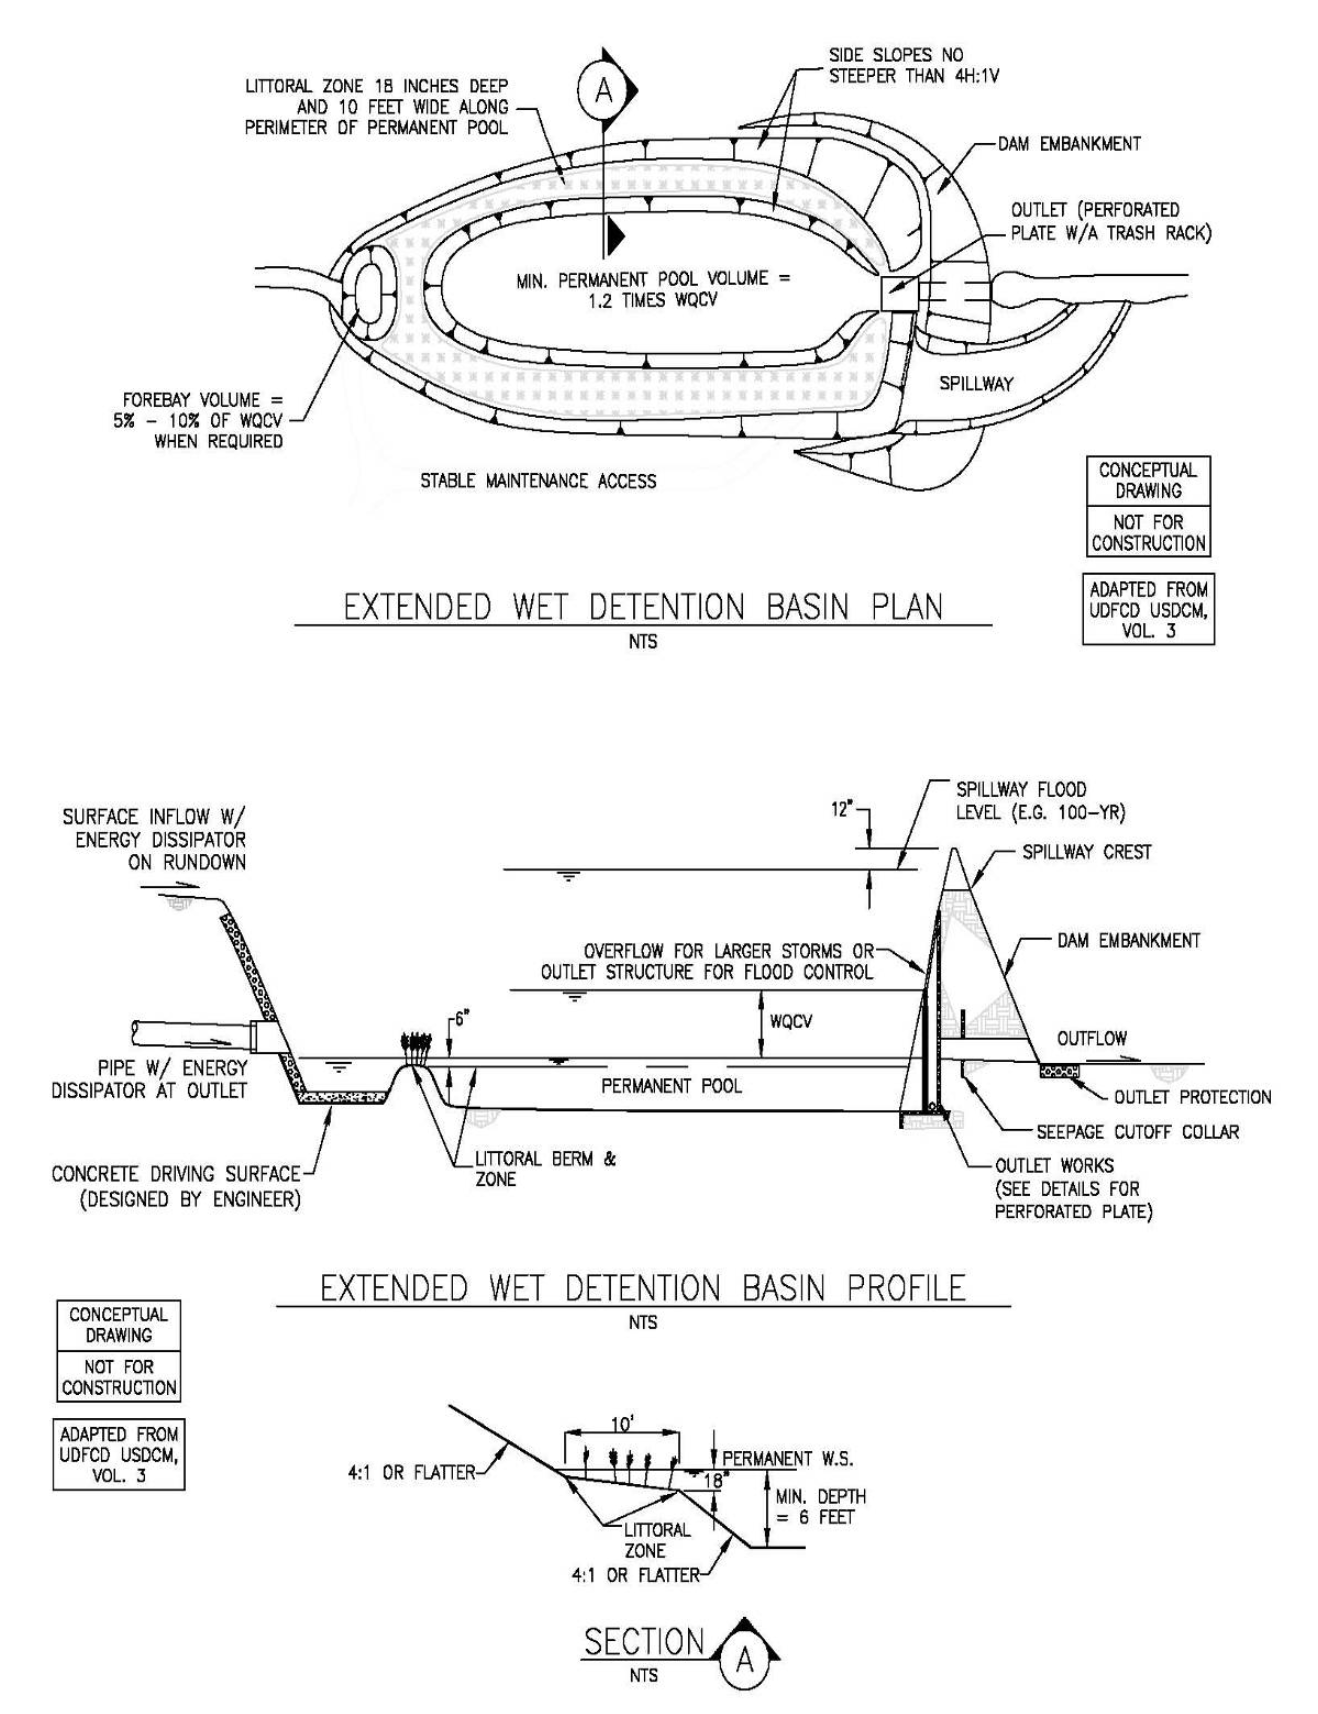
4.2.5. Extended Wet Detention Basin Design Example
The following example demonstrates use of the Extended Wet Detention Basin (EWDB) Worksheet in the BMP Spreadsheet.
Given: The contributing watershed area is 46.4 acres, consisting of commercial development (85 percent impervious). All the impervious area on the site is directly connected impervious area (e.g. rooftops, downspouts, paved parking, storm sewer, etc.).
Determine: Basin volume, residence time, basin geometry, outlet structure characteristics, trash rack characteristics, and forebay characteristics.
Worksheet Data Input
Watershed, basin, and outlet characteristics are entered into the input cells in the EWDB Worksheet.
Watershed Characteristics – User Input
Watershed area = 26.4 acres (given, convert to square feet for the worksheet input)
Ia = 85.0% (given)
The WQCV required is calculated in the WQCV worksheet using the method described in Section 3.2 of this chapter for a facility with a 12-hour drain time. For this example, the WQCV calculated is 48,349 ft3.
This value is automatically carried over to the EWDB worksheet to calculate the minimum design volume for the EWDB (Minimum permanent pool design volume = WQCV * 1.2).
Minimum Permanent Pool Volume – User Input
As described above, the minimum permanent pool volume is based on the WQCV. For this example, a permanent pool volume of 1.35 acre-ft (58,806 ft3) was selected to ensure the minimum was met.
Permanent Pool Volume, Vp = 58,806 ft3
Residence Time of Permanent Pool – User Input
The residence time is calculated by dividing the permanent pool volume by the average inflow rate during a 2-year, 24-hour storm event. The average inflow rate is calculated using the appropriate hydrologic analysis method from Chapter 3 – Determination of Stormwater Runoff. In this example, the Rational Method is appropriate because of the limited size of the watershed. The average inflow rate is equal to the total runoff volume divided by the event duration. The total runoff volume is a function of the rainfall depth, drainage area and runoff coefficient. The 2-year rainfall depth for the City of Rogers is 4.08 inches in 24 hours. With a drainage area of 26.4 acres and a runoff coefficient of 0.95, the total 2-year runoff volume is approximately 371,445 ft3. The total runoff volume divided by the event duration (24 hours) results in an average inflow rate to the pond of approximately 4.3 cfs.
Average inflow rate, Q2yr, avg = 4.3 cfs
Preliminary Basin Geometry – User Input
The preliminary basin geometry consists of a trapezoidal basin with the following characteristics:
Basin length to width ratio, L:W = 3.0
Basin side slope, Z = 4.0 ft/ft
Basin Depth, D = 6.0 ft
Water Quality Outlet Structure – User Input
To determine the perforation geometry of the plate that will drain the WQCV in 12 to 15 hours, it is necessary to undergo an iterative process of varying the perforation diameter, number of holes per row, and row spacing. It is recommended that the designer use the fewest number of holes per row in order to maximize the perforation diameter and reduce the potential for clogging. Using the EWDB worksheet, the final perforation geometry selected is:
Perforation diameter (dperforation) = 3.5 inches
Number of holes per row (nholes per row) = 2
Row spacing (Rs) = 8 inches
Trash Rack Selection – User Input
The trash rack design is based on the size of the perforated plate and the perforation geometry. For this example, the minimum height of the trash rack is based on the depth of the WQCV plus 24 inches. Since the WQCV depth is 36 inches (see Worksheet line 3.G), a height of 60 inches was selected. The minimum width of the trash rack was based on the required width of the concrete opening calculated in the EWDB Worksheet. The minimum width for the trash rack is 91 inches, however a width of 96 inches (8 feet) was selected based on standard material sizes.
Height of trash rack, HTR = 60 inches
Width of trash rack, WTR = 96 inches
Pre-sedimentation Forebay Basin – User Input
The optional forebay volume should be between 5 and 10 percent of the WQCV. This results in a volume between 4,252 and 8,503 ft3. For this example, a volume of 6,000 ft3 was selected and a gravel filter forebay outlet and a solid driving surface are included.
Forebay volume = 3,000 ft3
Results
Results of the analysis are displayed in the EWDB Worksheet (see sample worksheet following this design example). The results indicate:
Volume and Geometry
- Minimum permanent pool volume = 58,019 ft3
- Selected permanent pool volume = 58,800 ft3 (2.35 acre-feet)
- Residence time = 3.8 hours (WQCV surcharge is required)
- Basin bottom width = 41 ft
- Basin bottom length = 123 ft
- Calculated permanent pool volume = 60,786 ft3
- Depth of the WQCV = 2.7 ft
- Calculated WQCV = 85,041 ft3
Perforated Plate Sizing
- Number of rows = 4 (based on row spacing and depth of WQCV)
- Outlet area per row = 19.24 square inches
- Total outlet area = 76.97 square inches
- Drain time for WQCV = 14.3 hours
Trash Rack Sizing
- Open area required for trash rack = 1,920 square inches
- Type of trash rack = aluminum bar grate (Klemp KRP or equal)
- Selected height of trash rack = 60 inches (equal to minimum required)
- Width of concrete opening = 45 inches
- Selected width of trash rack = 60 inches (rounded up to standard size)
- Open space between aluminum bearing bars = 1 3/16 inches
- Spacing of cross bars (on center) = 2 inches
- Type of bearing bars = 1 1/4 inch by 3/16 inch rectangular bar
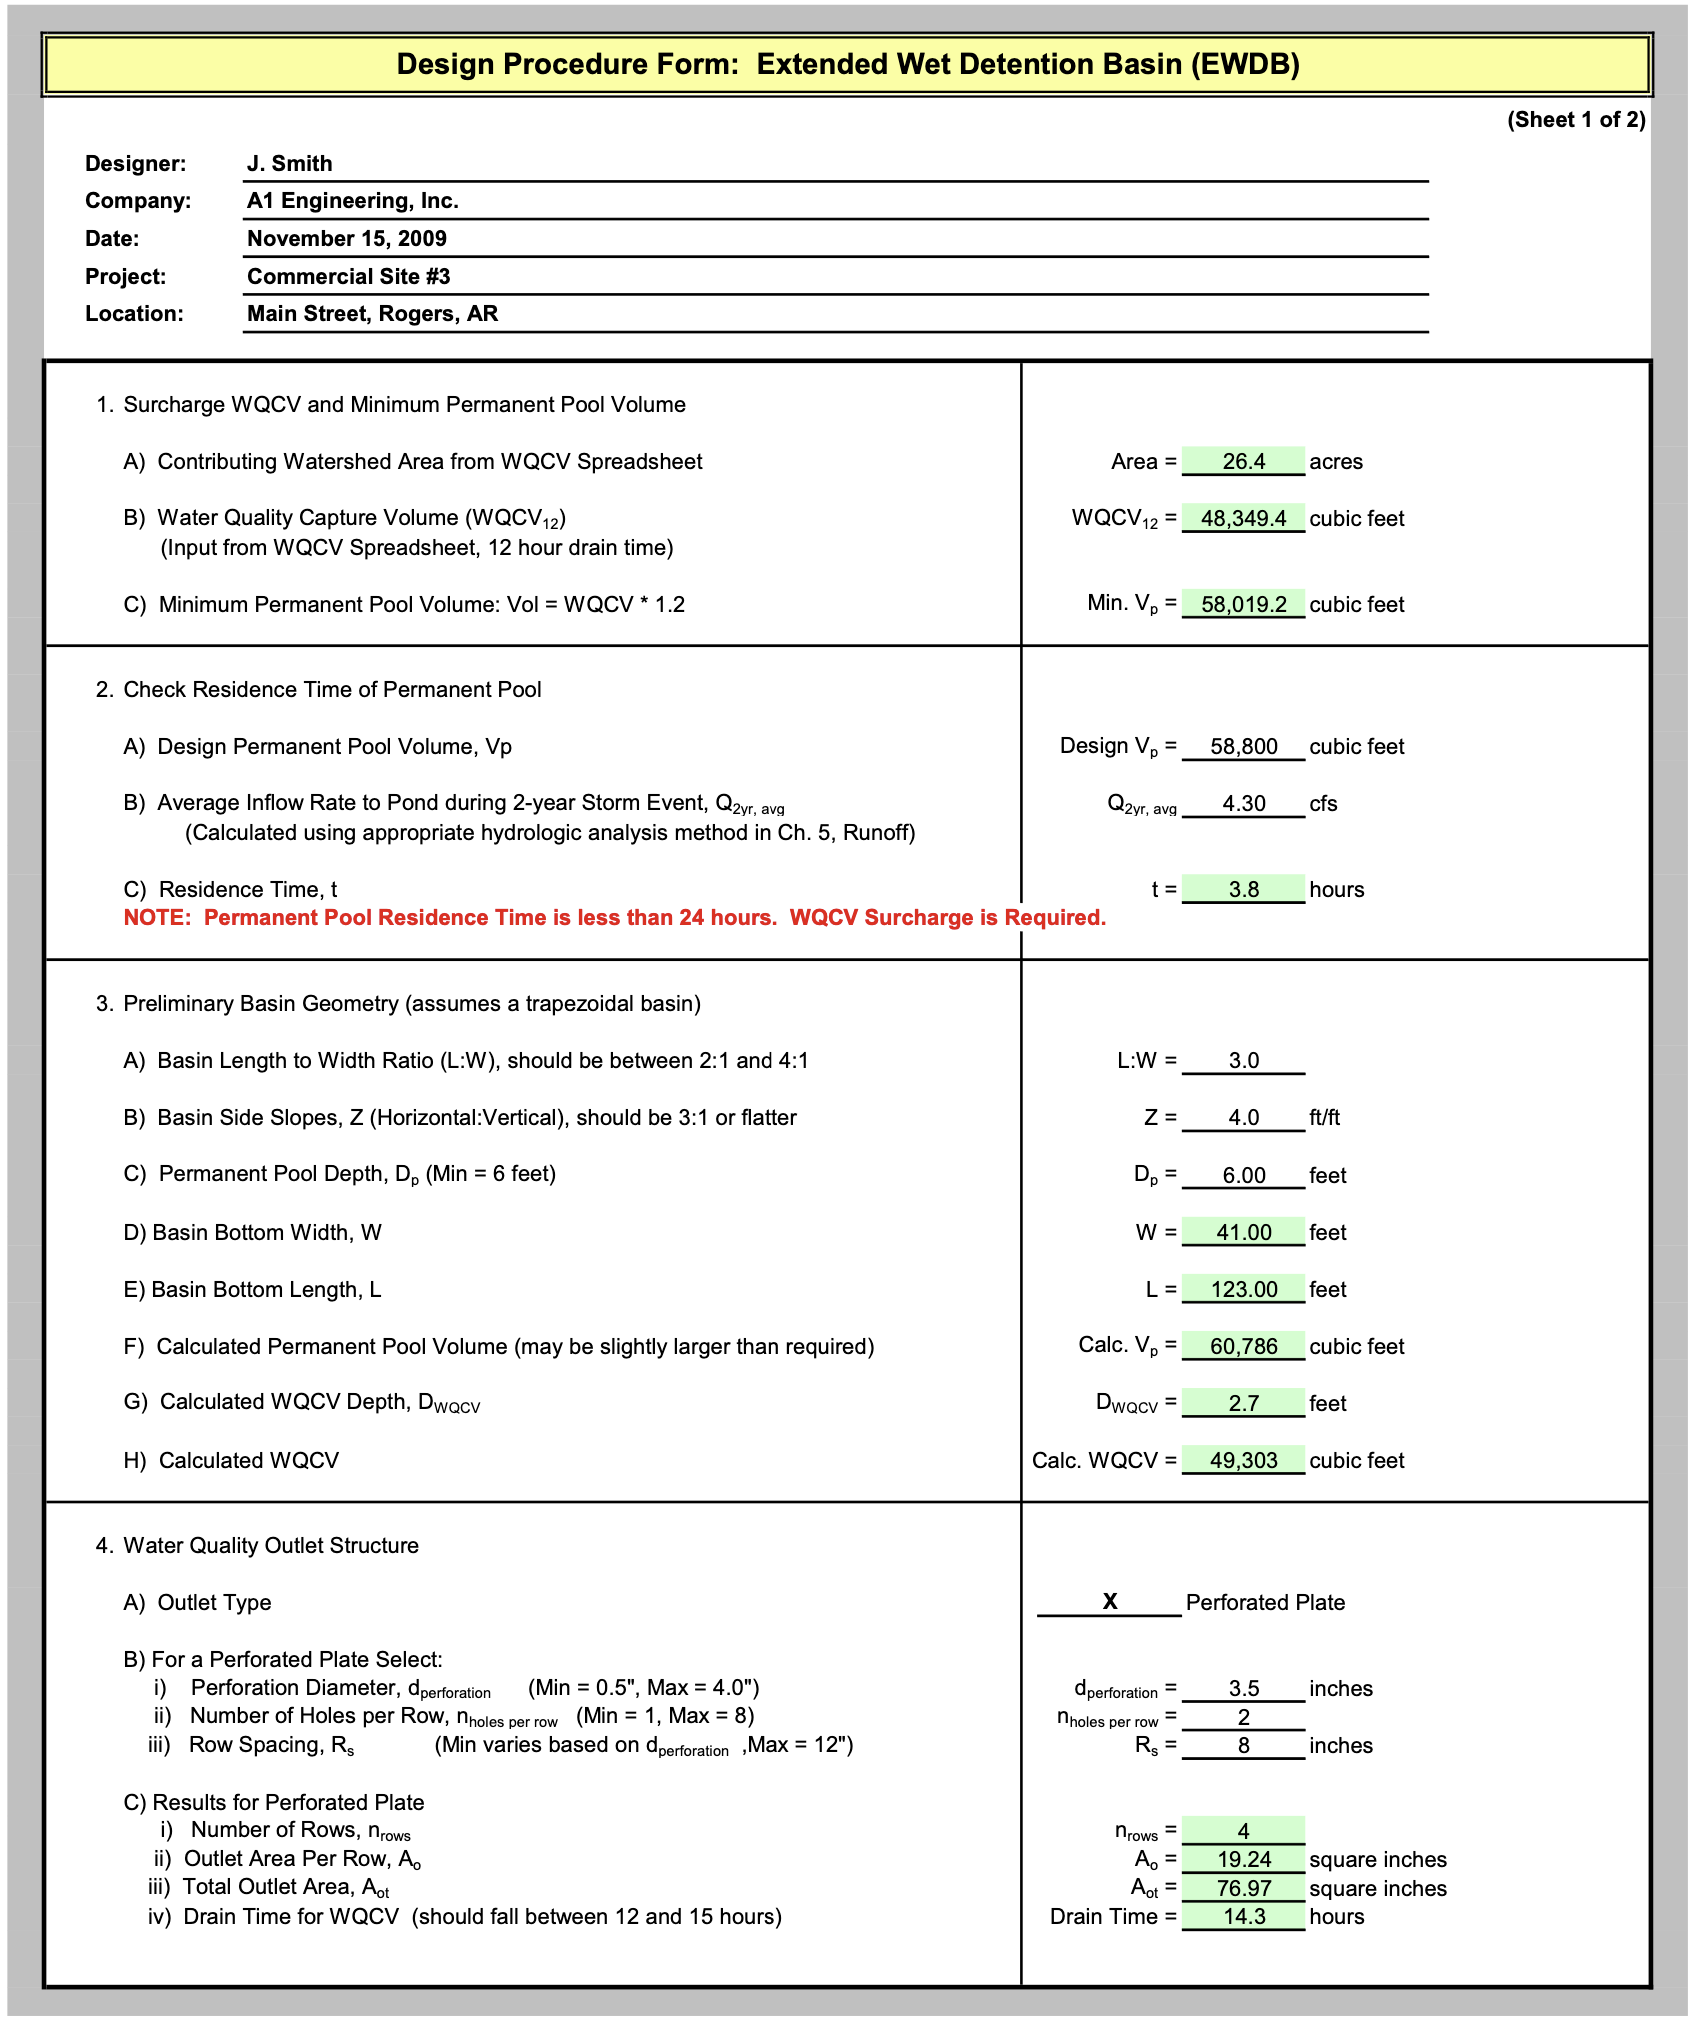
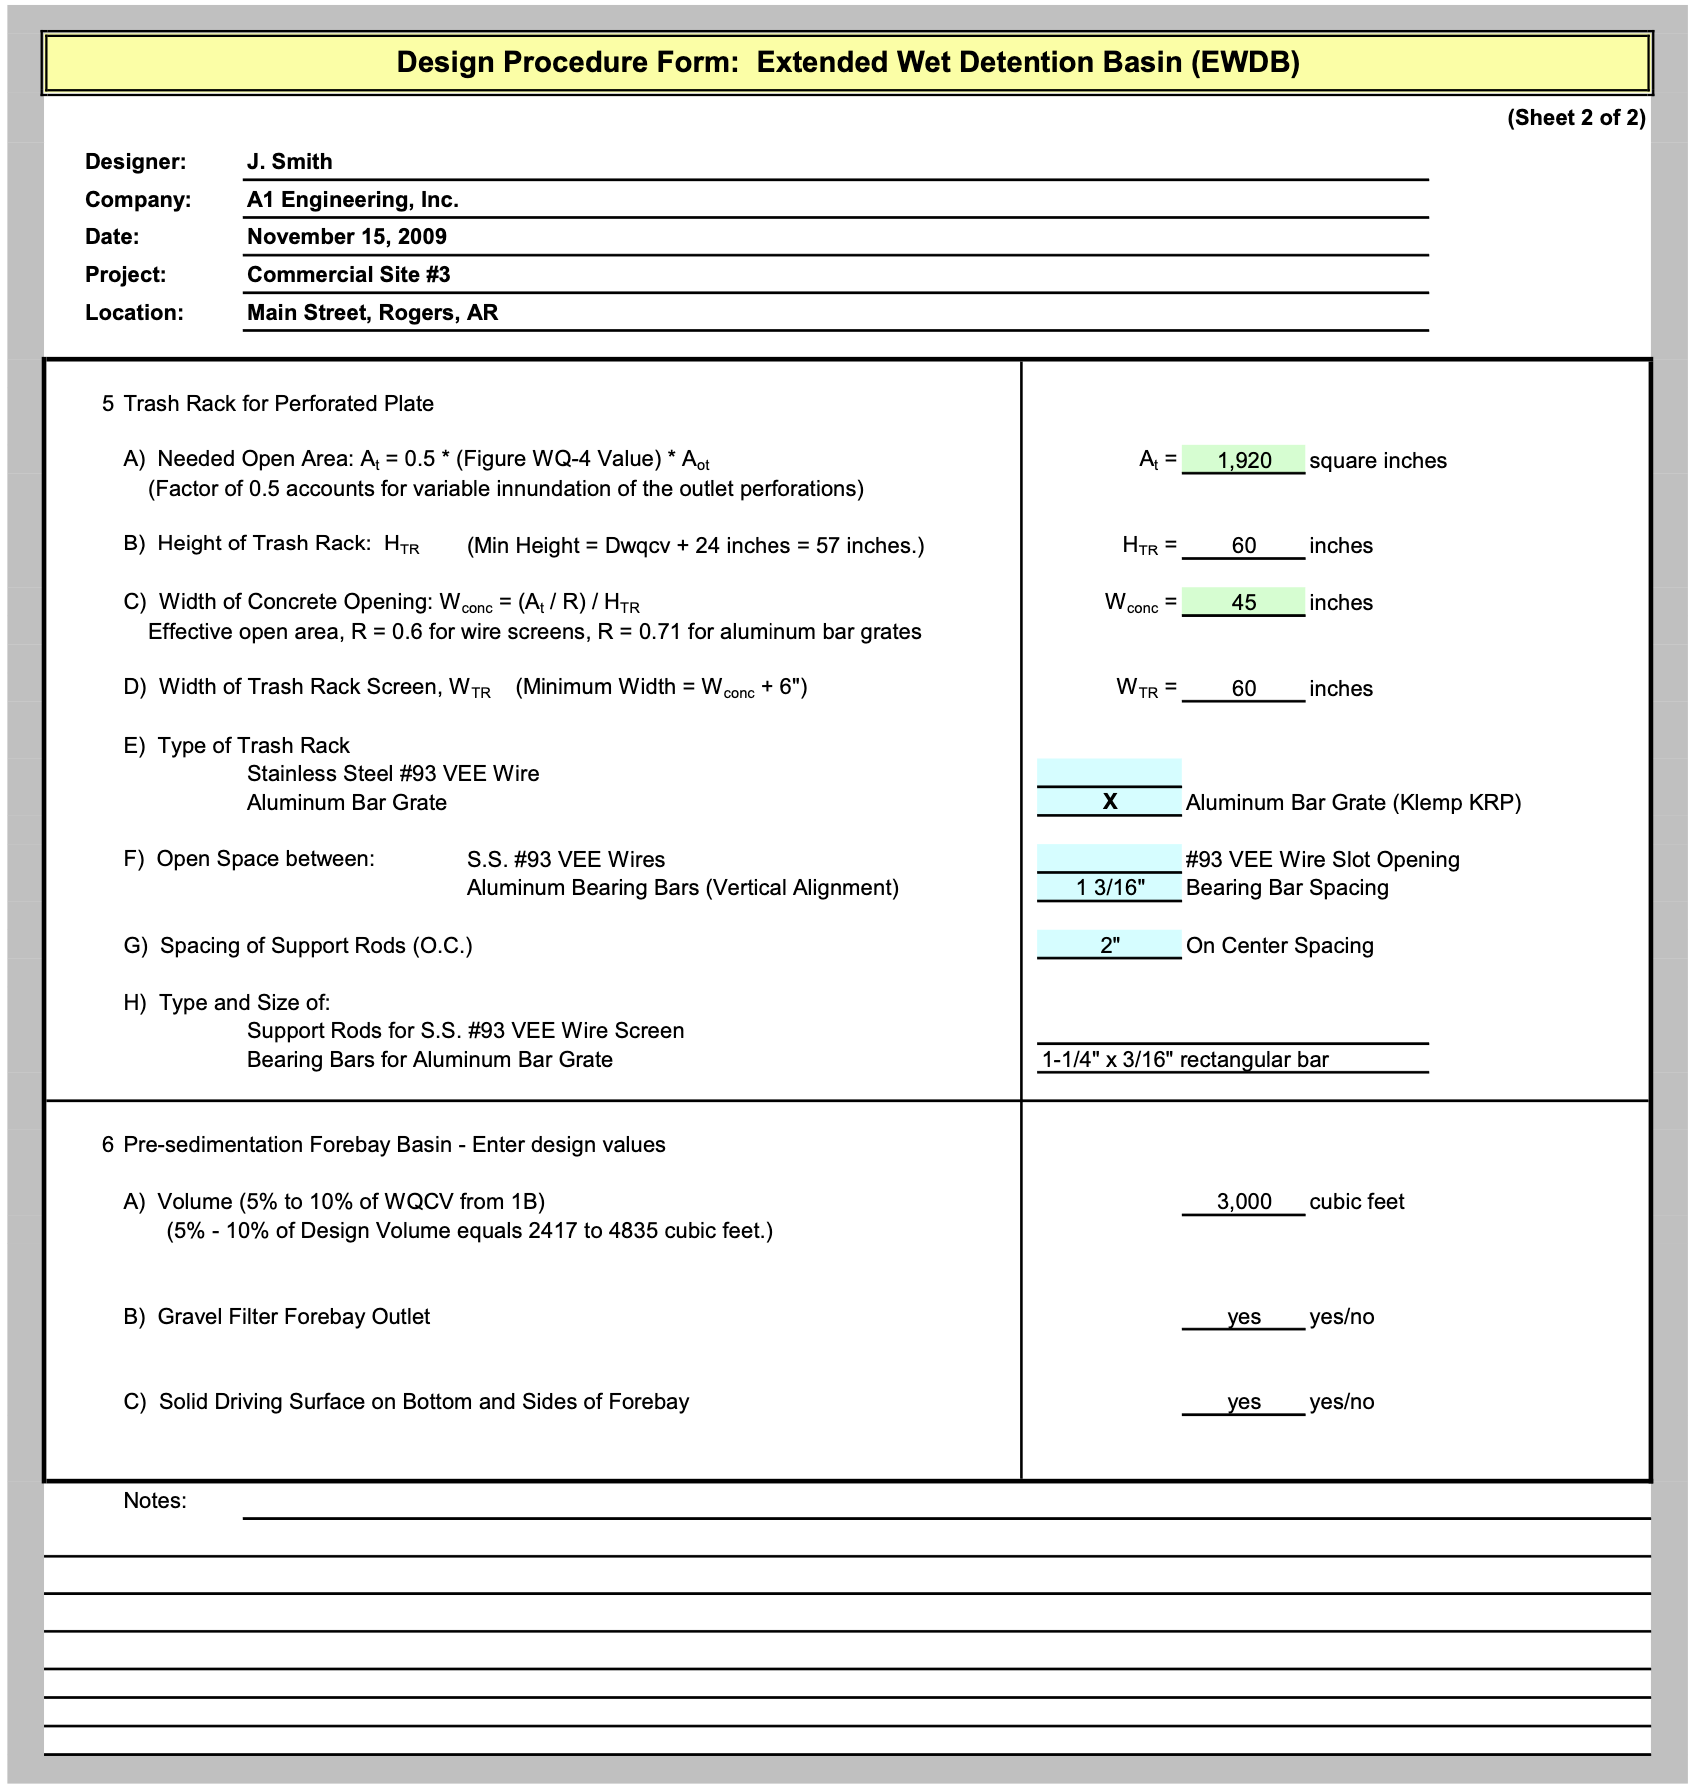
4.3.1. Description
A constructed wetland basin is a shallow extended wet detention basin that requires a perennial base flow to maintain microorganism habitat and to permit the growth of rushes, willows, cattails, and reeds. The wetland vegetation functions to slow runoff and allow time for sedimentation, filtering, and biological uptake. Existing small wetlands along ephemeral drainageways could be enlarged and incorporated into a constructed wetland system. Such action, however, requires the approval of federal and state regulators.
Photograph WQ-3 – Example of a Constructed Wetland Basin.
These basins can provide multiple benefits, but proper design is essential to avoid development of nuisance conditions, such as excessive algae growth.
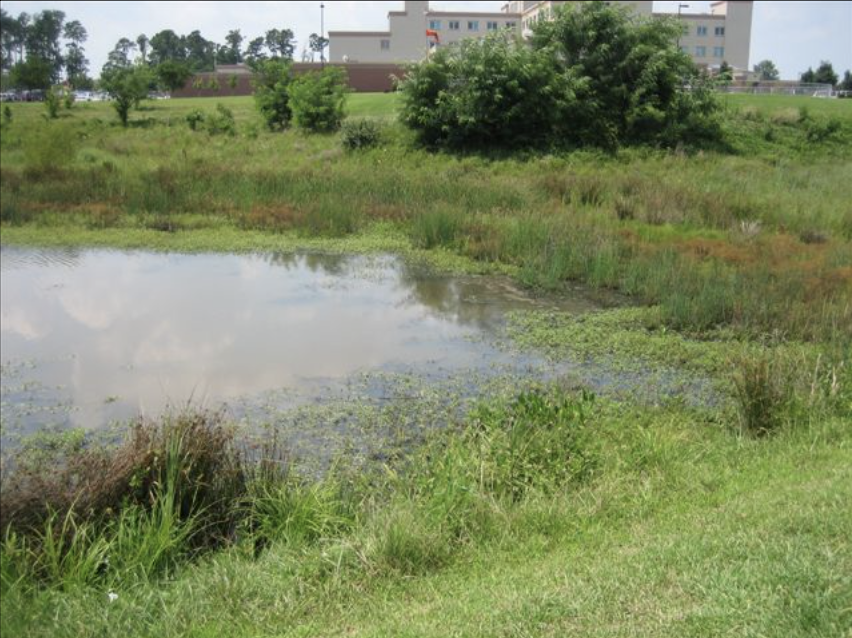
When properly designed, a constructed wetland basin can offer several potential advantages, such as natural aesthetic qualities, wildlife habitat, erosion control, and pollutant removal. Additionally, the constructed wetland basin can act as part of a multi-use facility by providing flood control storage above the WQCV pool or by providing effective follow-up treatment to other BMPs (such as onsite BMPs or source controls) that rely upon settling of larger sediment particles.
The primary constraint of a constructed wetlands basin is the need for a relatively continuous base flow to ensure viable wetland growth. In addition, silt and algae can accumulate and be flushed out during larger storms, adversely affecting downstream water quality, unless the wetlands are properly designed and built. Also, in order to maintain healthy wetland growth, the surcharge depth for WQCV above the permanent water surface cannot exceed roughly 2 feet. Another potential concern is that a wetland BMP may require a Section 404 permit from the USACE for significant maintenance if the facility is considered a jurisdictional wetland. Jurisdictional wetlands are subject to strict regulatory requirements administered by the USACE. These issues shall be reviewed with the USACE during the design process.
The City will review wetlands projects on a case-by-case basis. The City reserves the right to deny use of a constructed wetland because of these potential concerns.
4.3.2. Design Considerations
Major considerations for the design of a constructed wetland basin are summarized below:
Water budget - Development and analysis of a water budget is needed to show the net inflow of water is sufficient to meet all the projected losses (such as evaporation, evapotranspiration, and seepage for each season of operation) and ensure a perennial baseflow. Insufficient inflow can cause the wetland to become saline or die.
Soils analysis - Loamy soils are needed in a wetland bottom to permit plants to take root. Exfiltration through a wetland bottom cannot be relied upon because the bottom is either covered by soils of low permeability or because the groundwater is higher than the wetland's bottom.
Longitudinal slope - Wetland basins require a nearzero longitudinal slope, which can be provided using embankments.
4.3.3. Design Procedure and Criteria
The following steps outline the design procedure for a constructed wetland basin.
Figure WQ-7 illustrates an idealized constructed wetland basin. The Constructed Wetland Basin (CWB) Worksheet in the BMP Spreadsheet will aid in the design procedure discussed below.
- WQCV – Calculate the WQCV in ft3 using the method described in Section 3.2. The WQCV is the surcharge volume above the permanent wetland pool.
- Permanent pool volume – The volume of the permanent wetland pool shall be no less than 75 percent of the WQCV.
- Pool area and depth – Proper distribution of wetland habitat is needed to establish a diverse plant community. Distribute pond area in accordance with Table WQ-3.
Table WQ-3
Wetland Pond Water Design DepthsComponents
% of Permanent Pool Surface Area
Water Design Depth
Forebay, outlet and free water surface areas
30 to 50%
2 to 4 feet deep
Wetland zones with emergent vegetation
50 to 70%
6 to 12 inches deep*
* One-third to one-half of this zone should be 6 inches deep.
- WQCV surcharge depth – The surcharge depth of the WQCV above the permanent pool’s water surface shall not exceed 2.0 feet.
- Outlet works – The outlet works shall be designed in accordance with requirements set forth for extended dry detention basins in Section 4.1, with the following exceptions:
- Design the outlet works to release the WQCV in 22 to 28 hours.
- Outlet design shall consider the increased potential for wetland vegetation growth and clogging around the outlet. A micro-pool shall be incorporated into the outlet design to allow sub-surface flow to go under the pool surface (where debris typically accumulates against the trash rack) and through the lower portion of the trash rack.
- Trash rack – The trash rack shall be designed in accordance with requirements set forth for extended dry detention basins in Section 4.1. The trash rack shall extend at least 24 inches below the permanent pool level.
- Basin Usage – Determine whether flood storage or other uses will be provided and design accordingly for combined uses.
- Basin length:width ratio – The basin length to width ratio shall be between 2:1 and 4:1. Maximizing the distance between the inlet and the outlet will minimize short-circuiting.
- Basin side slopes – Basin side slopes shall be no steeper than 4:1, preferably 5:1 or flatter to facilitate maintenance, safety, and access.
- Water balance – A net influx of water must be available through a perennial base flow and must exceed the losses. A hydrologic balance shall be used to estimate the net quantity of base flow available at a site.
- Energy dissipation at inlets – Provide energy dissipation at all inlets to limit sediment resuspension.
- Forebay – If a forebay is incorporated into the design, design considerations and criteria for extended wet detention basins (described in Section 4.2) shall be followed.
- Wetland vegetation – Cattails, sedges, reeds, and wetland grasses shall be planted in the wetland bottom. Qualified professionals must be utilized to develop the planting plan and to plant the wetland vegetation. Berms and side-slopes shall be sodded with native or turf-forming grasses. Initial establishment of the wetland requires control of the water depth. After planting wetland species, the permanent wetland pool shall be kept at 3 to 4 inches deep at the plant zones to allow growth and to help establish the plants, after which the pool shall be raised to its final operating level. Suggested plant species for constructed wetlands are provided in Table WQ-4. The planting plan for wetlands must be developed by a qualified Wetland Scientist or a Landscape Architect with wetland experience. The wetland plantings must be guaranteed to have a minimum survival rate of three years.
Table WQ-4
Suggested Plant List for Constructed WetlandsBasin Area
Plant Species
(Botanical Name)Plant Species
(Common Name)Planting Guidelines
Micro-pool
Equisetum hyemale
Horsetail/Scouring Rush
1 gal., plant 30” O.C.
Typha Angustifolia
Narrow-leaved Cattail
1 gal., plant 30” O.C.
Pontederia cordata
Pickeral Weed
1 gal., plant 30” O.C.
Scirpus zebrinus
Zebra Rush
1 gal., plant 30” O.C.
Pond Bottom
Juncus effuses
Soft Rush
1 gal., plant 18” O.C.
Acourus calamus
Sweet Flag
1 gal., plant 18” O.C.
Carex stricta ‘Bowles Golden’
Bowles Golden Sedge
1 gal., plant 24” O.C.
Caltha palustris
Marsh Marigold
1 gal., plant 24” O.C.
Peltandra virginica
Arrow Arum
1 gal., plant 24” O.C.
Equisetum hyemale
Horsetail/Scouring Rush
1 gal., plant 30” O.C.
Typha Angustifolia
Narrow-leaved Cattail
1 gal., plant 30” O.C.
Berms/ Sideslopes
Juncus effuses
Soft Rush
1 gal., plant 18” O.C.
Acourus calamus
Sweet Flag
1 gal., plant 18” O.C.
Carex stricta ‘Bowles Golden’
Bowles Golden Sedge
1 gal., plant 24” O.C.
Caltha palustris
Marsh Marigold
1 gal., plant 24” O.C.
Iris ensata
Japanese Iris
1 gal., plant 12” O.C.
Iris fulva
Copper Iris
1 gal., plant 15” O.C.
- Maintenance access – Provide vehicle access to the forebay (if applicable) and outlet area for maintenance and removal of bottom sediments. Maximum grades shall not exceed 10 percent, and a stabilized, all-weather driving surface must be provided.
4.3.4. Maintenance
Because proper maintenance of a constructed wetland is necessary to achieve optimal performance, submittal of a maintenance plan for the wetlands will be required for the City to approve a constructed wetlands project. The maintenance plan must include tasks and schedule for both routine and non-routine maintenance, including the following major categories:
- Conduct routine inspections and perform minor maintenance, as needed, for accumulation of litter and debris, burrows, integrity of the outlet, and sediment accumulation (perform semi-annually).
- Perform non-routine maintenance based on the findings from the routine maintenance inspections. Remove accumulated sediment in forebay and main pool basin, as necessary. Removal of sediment from the main pool is required whenever sediment accumulation occupies approximately 20 percent of the WQCV. Periodic sediment removal is also needed if water movement within the wetland is restricted.
As noted in Section 4.3.1, the USACE shall be consulted regarding maintenance of a wetland with respect to Section 404 Permit requirements.
Figure WQ-7
Plan and Profile of an Idealized Constructed Wetland Basin
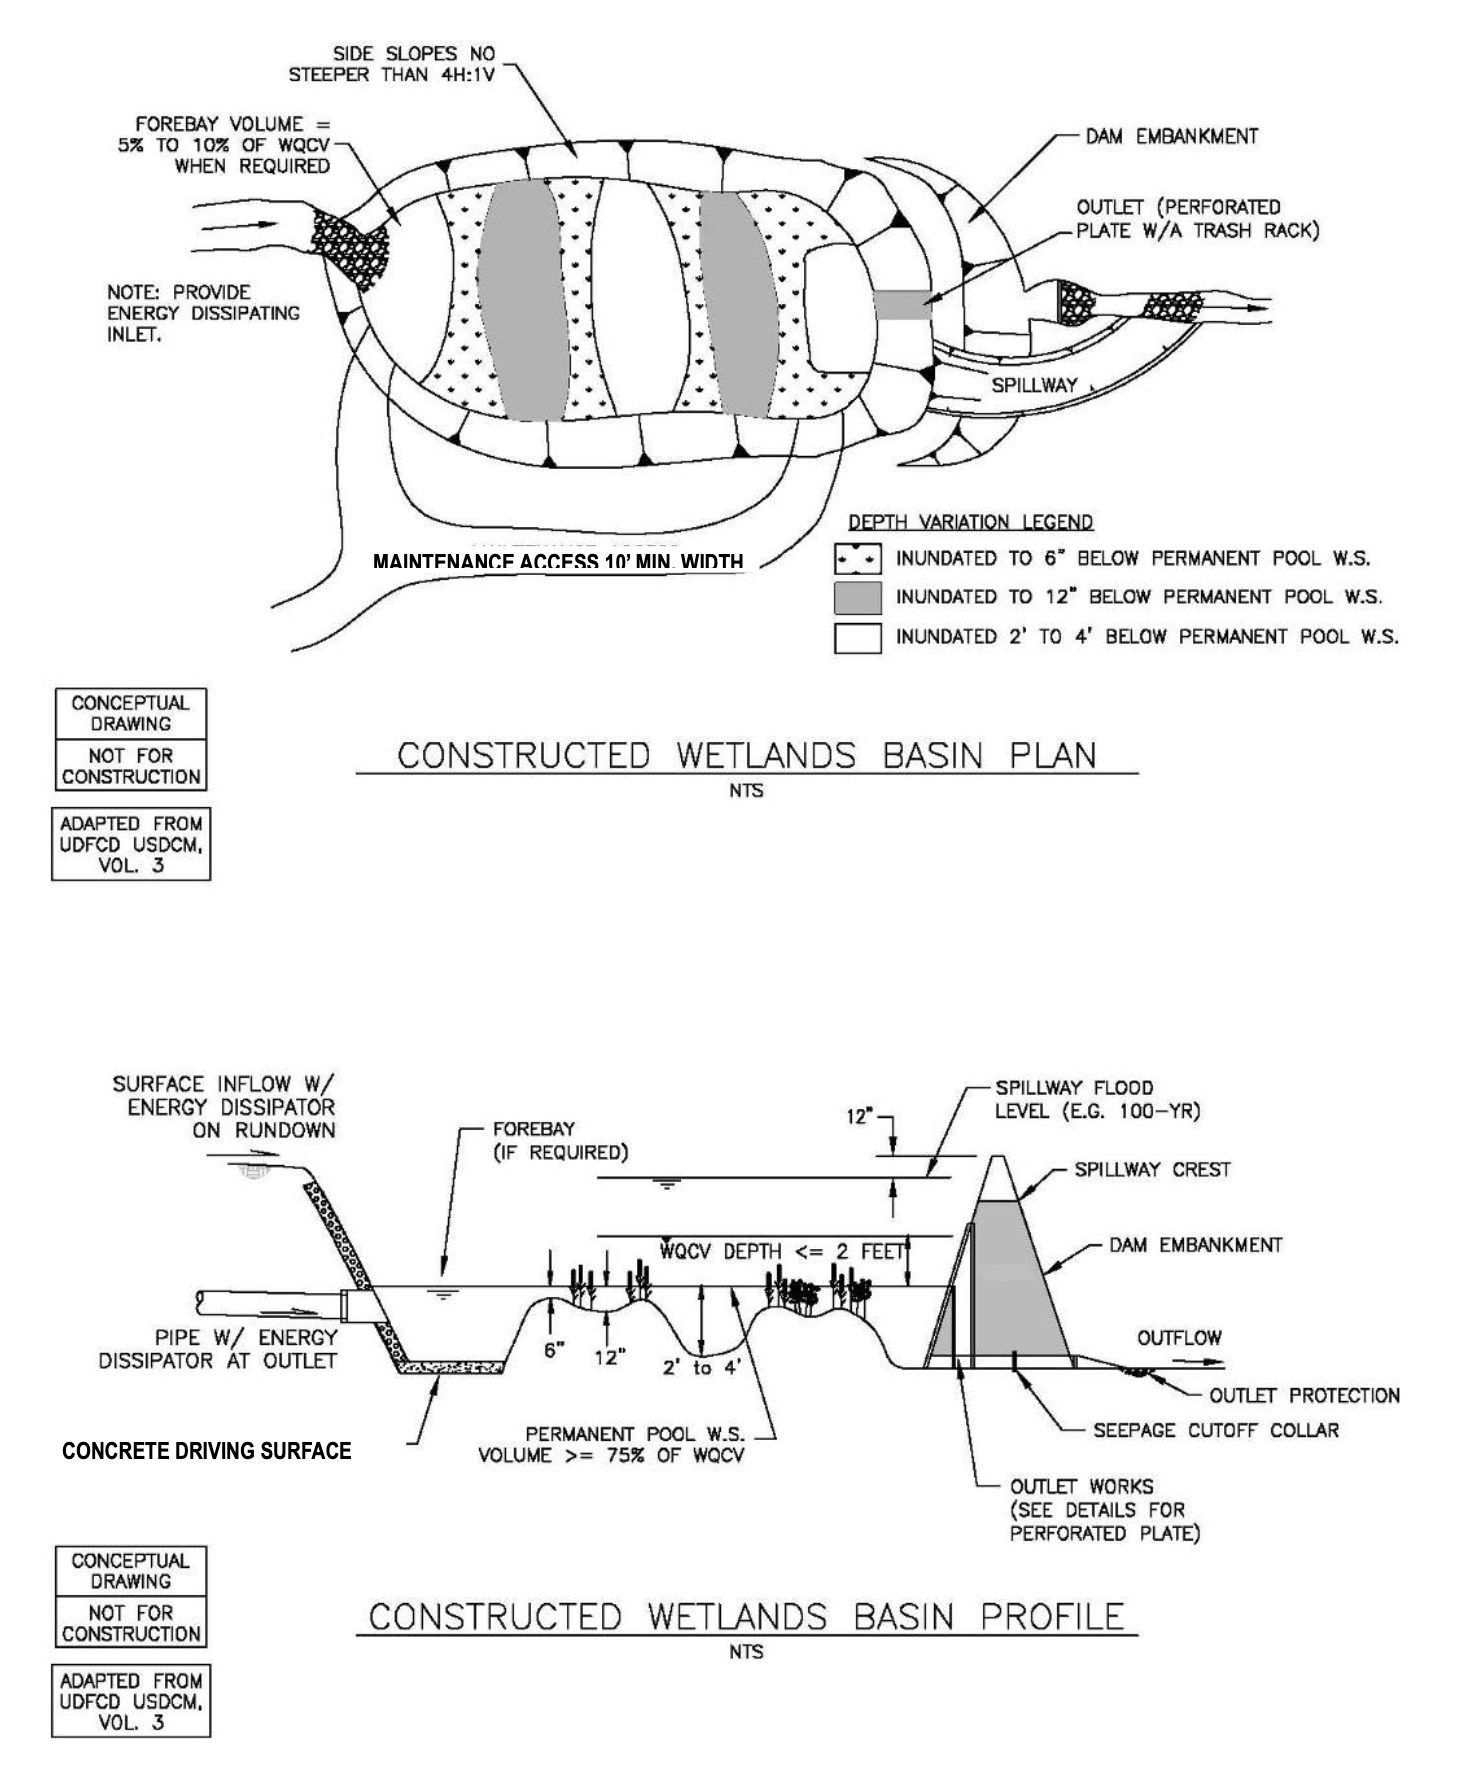
4.3.5. Design Example
The following example demonstrates use of the Constructed Wetland Basin (CWB) Worksheet in the BMP Spreadsheet.
Given: Assume a contributing watershed area of 86,980 square feet (approximately 2.0 acres), consisting of commercial development for a grocery store (85 percent impervious). All the impervious area on the site is directly connected impervious area (e.g. rooftops connected to downspouts which drain onto paved parking areas that are drained by the local storm sewer).
Determine: Basin volume, basin geometry, outlet structure characteristics, trash rack characteristics and forebay characteristics.
Worksheet Data Input
Watershed, basin, and outlet characteristics are entered into the input cells in the CWB Worksheet as described below:
Watershed Characteristics – User Inputs
Watershed area = 86,980 square feet (approximately 2.0 acres) (given)
The WQCV required is calculated using the method described in Section 3.2 of this chapter.
A WQCV value of 4,387 ft3 is used to calculate the minimum permanent wetland pool volume for the CWB (Minimum permanent pool design volume = WQCV * 75% = 4,387 x 0.75 = 3290.25 ft3.
Permanent Wetland Pool Volume – User Inputs
As described above, the minimum permanent wetland pool volume is based on the WQCV. For this example, a permanent wetland pool volume of 3300 ft3 was selected to ensure the minimum was met.
Permanent wetland pool volume, Vp = 3300 ft3
Permanent Wetland Pool Surface Area – User Inputs
The permanent wetland pool water surface area is based on an estimated area calculated in the CWB Worksheet. A water surface area of 2,200 ft2 was selected for this example.
Water surface area = 2,200 ft2
Permanent Wetland Pool Depth – User Inputs
The depth of the permanent wetland pool varies for different portions of the basin (see Table WQ-3). For this example, a depth of 36 inches was selected for the forebay, outlet and free water surface areas. These areas account for approximately 45 percent (830 ft2) of the total surface area. A depth of 9 inches was selected for the wetland zones.
Depth of forebay, outlet and free water surfaces = 36 inches
Surface area of forebay, outlet and free water surfaces = 880 ft2 (40 percent)
Depth of wetland zones with emergent vegetation = 9 inches
Preliminary Basin Geometry – User Inputs
The preliminary basin geometry consists of a trapezoidal basin with the following characteristics:
Basin length to width ratio, L:W = 3.0
Basin side slope, Z = 4.0 ft/ft
Water Quality Outlet Structure – User Inputs
To determine the perforation geometry of the plate that will drain the WQCV in 22 to 28 hours, it is necessary to use an iterative process that varies the perforation diameter, number of holes per row, and row spacing. It is recommended that the designer use the fewest number of holes per row while still providing the necessary area of the openings. Using the fewest number of holes will maximize the diameter of each perforation, thereby reducing their potential for clogging. Using the CWB Worksheet, the final perforation geometry selected is shown below:
Perforation diameter, dperforation = 1.0 inch
Number of holes per row, nholes per row = 2
Row spacing, Rs = 12 inches
Trash Rack Selection – User Inputs
The trash rack design is based on the size of the perforated plate and the perforation geometry. For this example, the minimum height of the trash rack is based on the depth of the WQCV plus 24 inches. A height of 42 inches was selected. The minimum width of the trash rack was based on the required width of the concrete opening calculated in the CWB Worksheet. The minimum width for the trash rack is 15 inches; however, a width of 18 inches was selected based on standard material sizes. It is noted that the trash rack is larger than required to provide the needed open area. The size is constrained by the required depth (WQCV + 24 inches) and the width of the concrete opening. A conceptual detail of the plate and trash rack is shown on Figure WQ-4.
Height of trash rack, HTR = 43 inches
Width of trash rack, WTR = 18 inches
Pre-sedimentation Forebay Basin – User Inputs
The forebay volume, if used, must be between 5 and 10 percent of the WQCV. This results in a volume between 219 and 439 ft3. For this example, a volume of 250 ft3 was selected and a gravel filter forebay outlet and a solid driving surface are included.
Results
Results of the analysis are displayed in the CWB Worksheet (see sample worksheet following this design example). The designer must select actual design values based on the estimated values calculated in the spreadsheet. The results of the CWB Worksheet analysis are shown below:
Volume, Depth and Water Surface Area
- Minimum permanent wetland pool volume = 3,290.5 ft3
- Selected design permanent wetland pool volume = 3,300 ft3
- Estimated permanent wetland pool surface area = 2,200 ft2
- Selected design permanent wetland pool surface area = 2,200 ft2
- Selected depth of forebay, outlet and free water surface = 36 inches
- Selected surface area of forebay, outlet and free water surface = 880 ft2 (approximately 40 percent of total surface area)
- Selected depth of wetland zones with emergent vegetation = 9 inches
- Surface area of wetland zones = 1,320 ft2 (approximately 60 percent of total surface area)
- Depth of the WQCV = 1.51 ft
- Calculated WQCV = 4,420 ft3
Perforated Plate Sizing
- Number of rows = 2 (based on row spacing and depth of WQCV)
- Outlet area per row = 1.57 square inches
- Total outlet area = 3.14 square inches
- Drain time for WQCV = 27.0 hours
Trash Rack Sizing
- Open area required for trash rack = 107 square inches
- Type of trash rack = stainless steel wire (#93 VEE) screen (Johnson Screens or equal)
- Selected height of trash rack = 43 inches
- Width of concrete opening = 9 inches (required by the perforation size and spacing)
- Selected width of trash rack = 18 inches
- Wire slot opening = 0.139 inches
- Spacing of support rods (on center) = 0.75 inches
- Type of support rods = #156 VEE
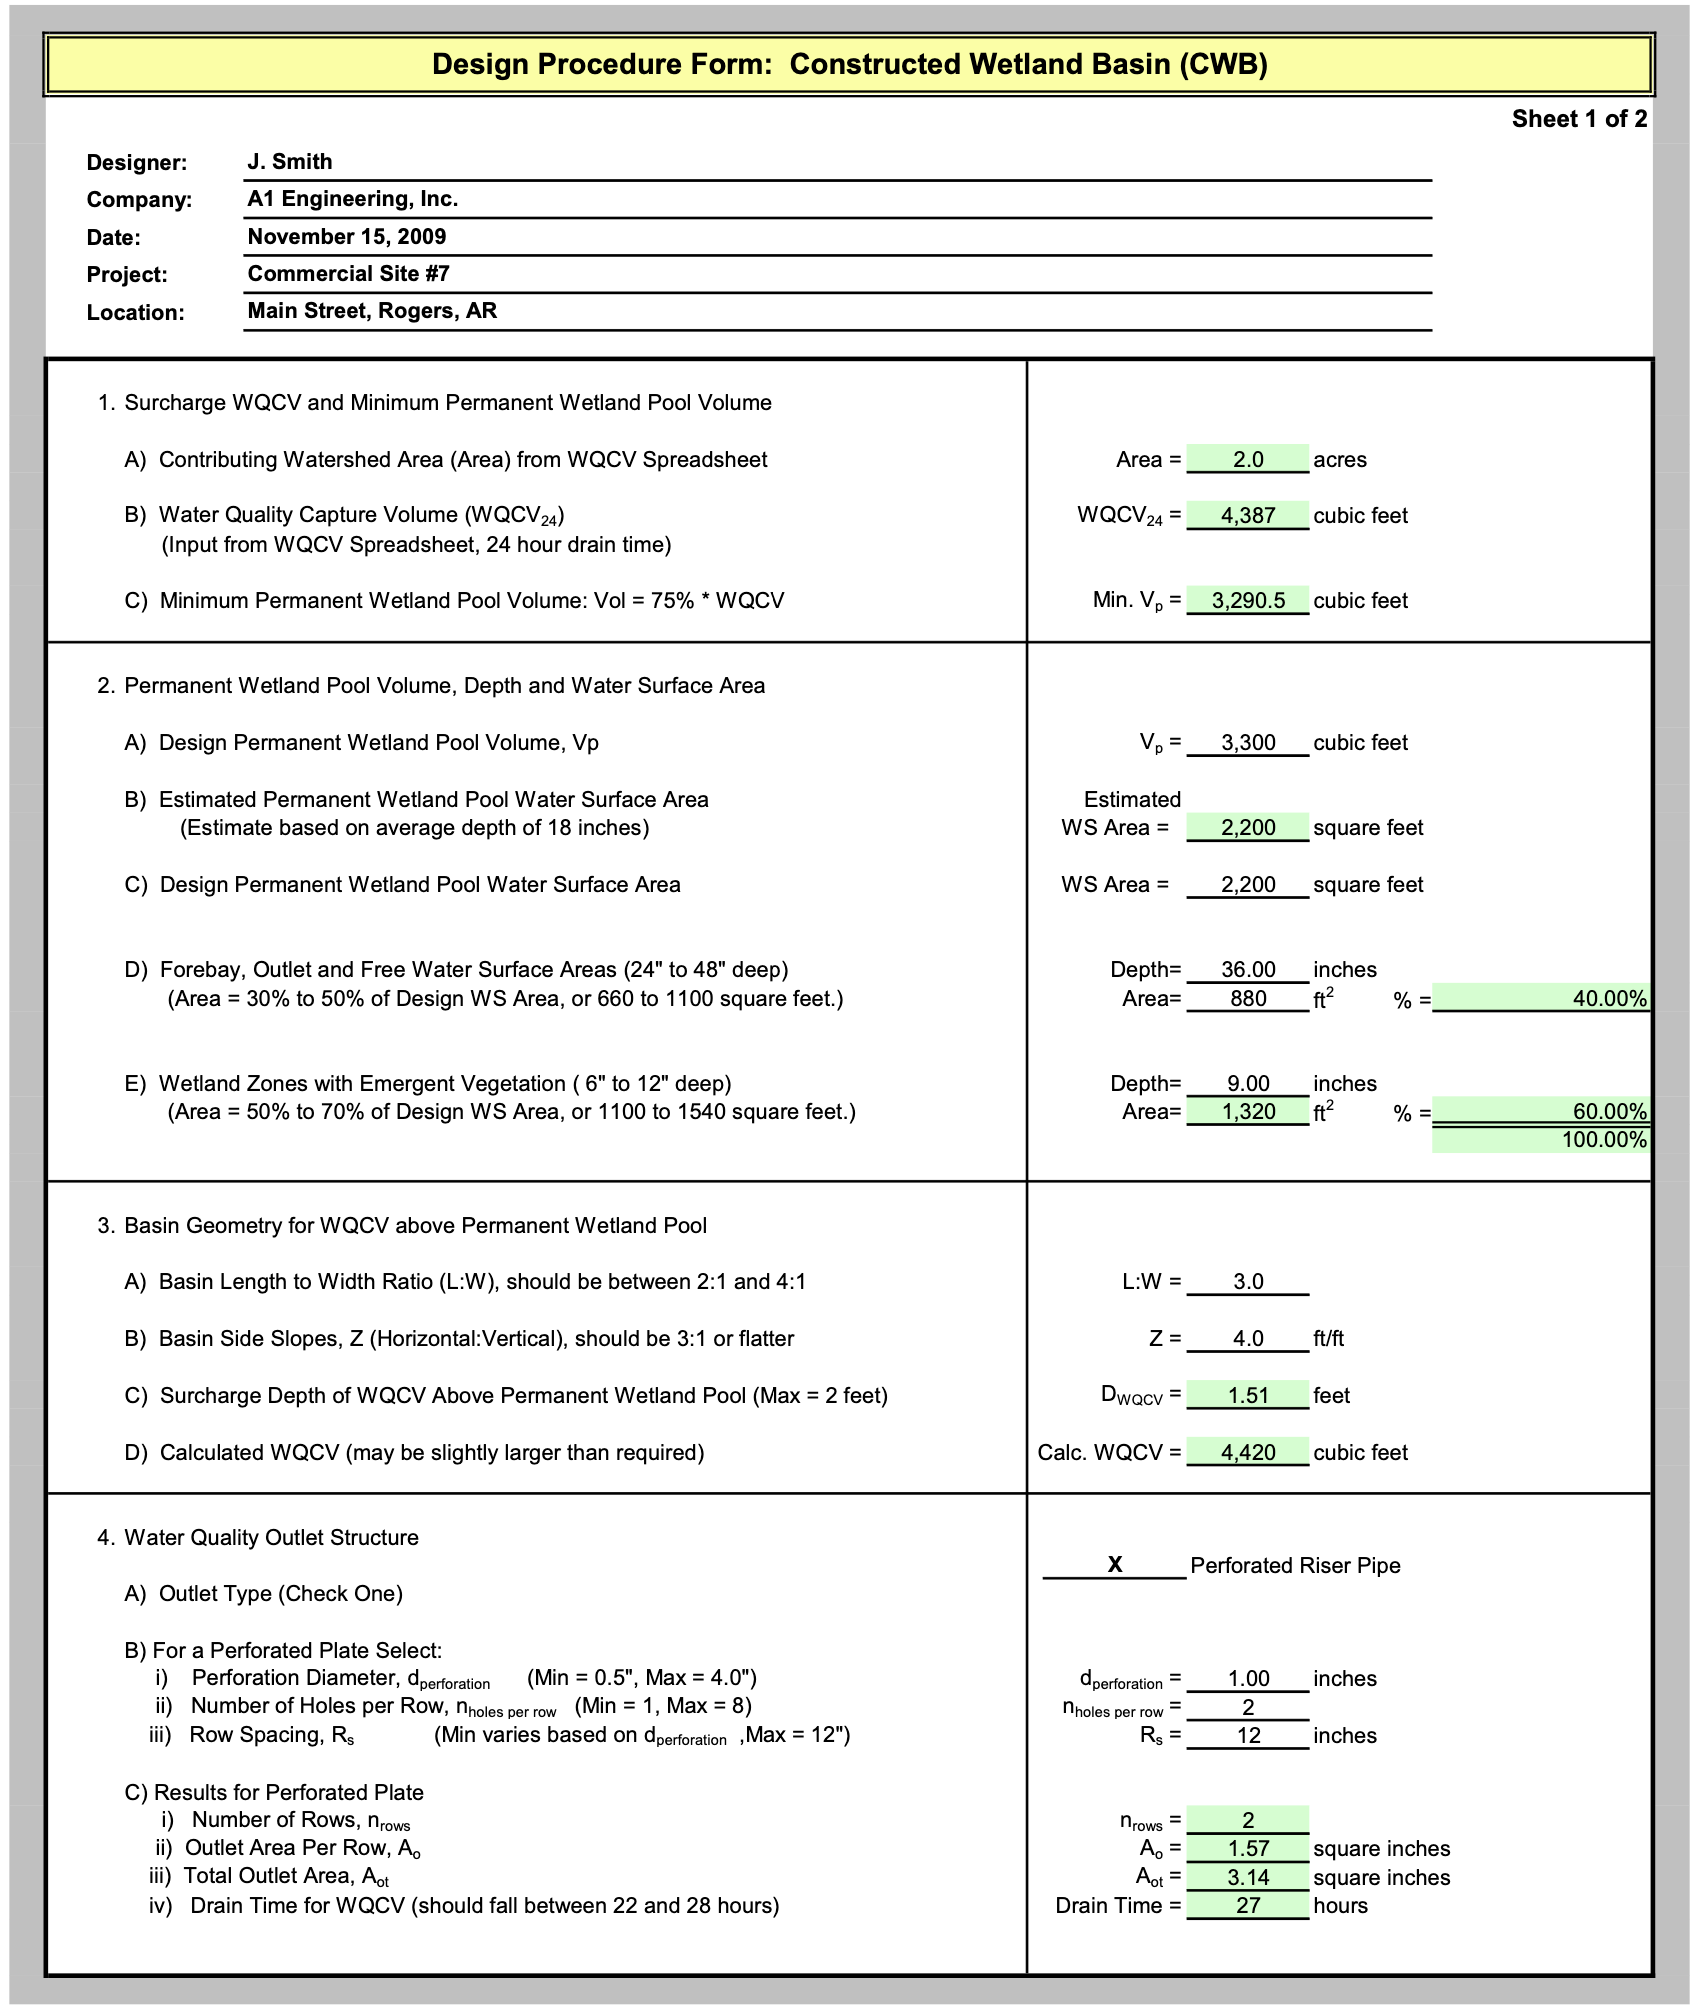

4.4.1. Description
Porous landscape detention consists of a low-lying vegetated area underlain by a porous media bed with an underdrain pipe, which gradually dewaters the porous media bed and discharges the runoff to a nearby channel, swale, or drainage system. A shallow surcharge zone exists above the porous landscape detention for temporary storage of the WQCV. During a storm, accumulated runoff ponds in the vegetated zone and gradually infiltrates into the underlying porous media bed.
Photograph WQ-4 – Example of Porous Landscape Detention.
PLD can be integrated into a wide variety of development conditions and can be particularly beneficial for sites with limited green space, such as this parking lot.
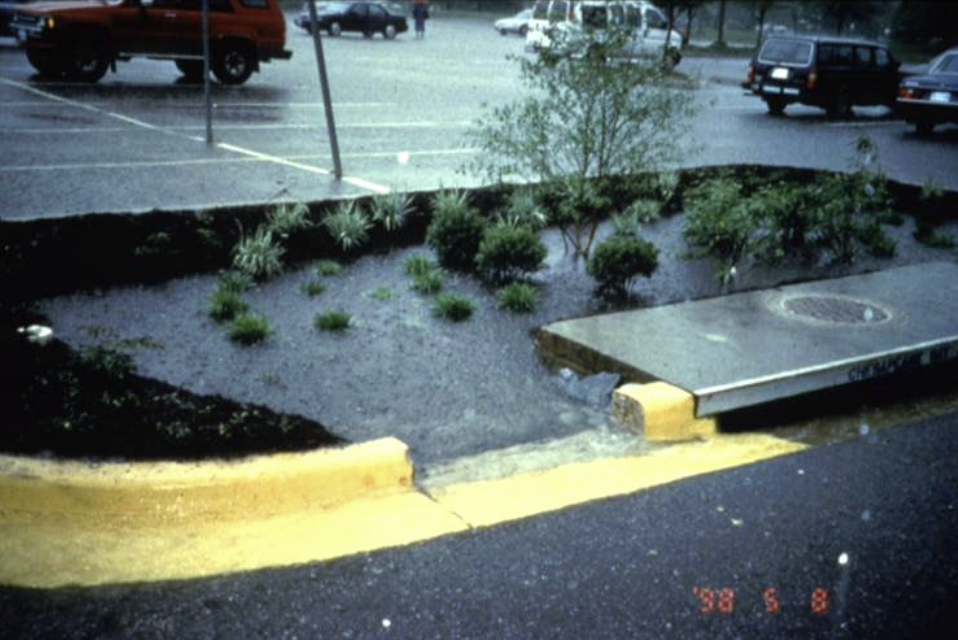
Porous landscape detention is ideally suited for small installations such as parking lot islands, street medians, roadside swale features, and site entrance or buffer features. This BMP may also be implemented at a larger scale, serving as an infiltration basin for an entire site, provided the WQCV and average depth requirements contained in this section are met. Vegetation may consist of turfgrass or natural grasses with shrub and tree plantings.
The primary disadvantage of porous landscape detention is the potential for clogging if moderate to high quantities of silts and clays are allowed to flow into the facility. Also, this BMP shall be avoided within 20 feet of building foundations, although an underdrain and impermeable liner can address the concern of saturation, shrink, and swell near a foundation. Additionally, this BMP has a relatively flat surface area and may be difficult to incorporate into steeply sloping terrain.
4.4.2. Example Applications
The photograph below shows an example of a relatively large porous landscape detention facility featuring a dense turfgrass bottom with a putting green.
Photograph WQ-5 –Porous landscape detention facilities can be implemented
in many creative ways.
4.4.3. Design Considerations
When implemented using multiple small installations on a site, it is important to accurately account for each upstream drainage area tributary to each porous landscape detention site to make sure that each facility is properly sized for the tributary area.
4.4.4. Design Procedure
The following steps outline the porous landscape detention design procedure and criteria. Figure WQ-8 shows a cross-section for a porous landscape detention. The Porous Landscape Detention (PLD) Worksheet in the BMP Spreadsheet will aid in the design procedure discussed below.
- WQCV – Calculate the WQCV in ft3 based on Section 3.2 of this chapter. The storage volume equals the WQCV.
- Minimum surface area – Calculate the minimum required surface area, As (ft2), as follows:
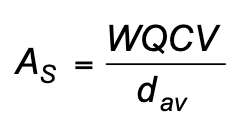 (Equation WQ-4)
In which:
dav = Average depth of the porous landscape detention basin (6-inch minimum, 12-inch maximum) - Vegetation growth medium – To treat stormwater and also serve as a medium for plant growth, provide a well-mixed layer composed of 50% sand (ASTM C-33, no builder’s sand), 25% cotton burr or hardwood compost and 25% sandy loam topsoil as shown in Figure WQ-8. The depth of the media should range from a minimum of 18 inches up to a maximum of 3 feet in cases where deeper-rooted plants will be used. The media should have a maximum hydraulic conductivity of approximately 20 inches/hour, with less than 8 inches/hour preferred to sustain plant growth. The top surface should be as flat as possible, with side slopes steeper than 3:1 not recommended. If steeper side-slopes are necessary, use vertical walls to contain the growth medium.
- Sub-base – Install an 8-inch layer of granular sub-base with all fractured faces meeting the requirements of AASHTO #3 coarse aggregate specifications. Install 4-inch underdrains at the bottom of the granular layer. Underdrains shall be spaced at a maximum of 20 feet with a minimum slope of 0.2 percent. Underdrains shall connect to an existing drainage system or daylight to an appropriate stormwater drainage channel. Use porous geotextile fabric to line the entire basin bottom and sides. When certified tests show percolation rates of less than 60 minutes per inch of drawdown under the bottom of the basin and infiltration is acceptable, eliminate the gravel layer, underdrains and geotextile fabric.
- Impermeable liner (if needed) – When an existing or proposed building is within 20 feet, and/or when land uses pose a risk for groundwater contamination, use an impermeable liner under and on all sides of the porous landscape detention basin.
4.4.5. Maintenance
Periodic maintenance will be necessary for the landscaping in the porous landscape detention. Eventually, a porous landscape detention will require cleanout and replacement of the porous media. If a high level of silts and clays are allowed to flow into the facility, the porous media may become clogged and require replacement more often. The Low Impact Development Center website (www.lowimpactdevelopment.org) provides additional design and maintenance recommendations for bioretention cells, which are comparable to porous landscape detention.
Figure WQ-8 Porous Landscape Detention
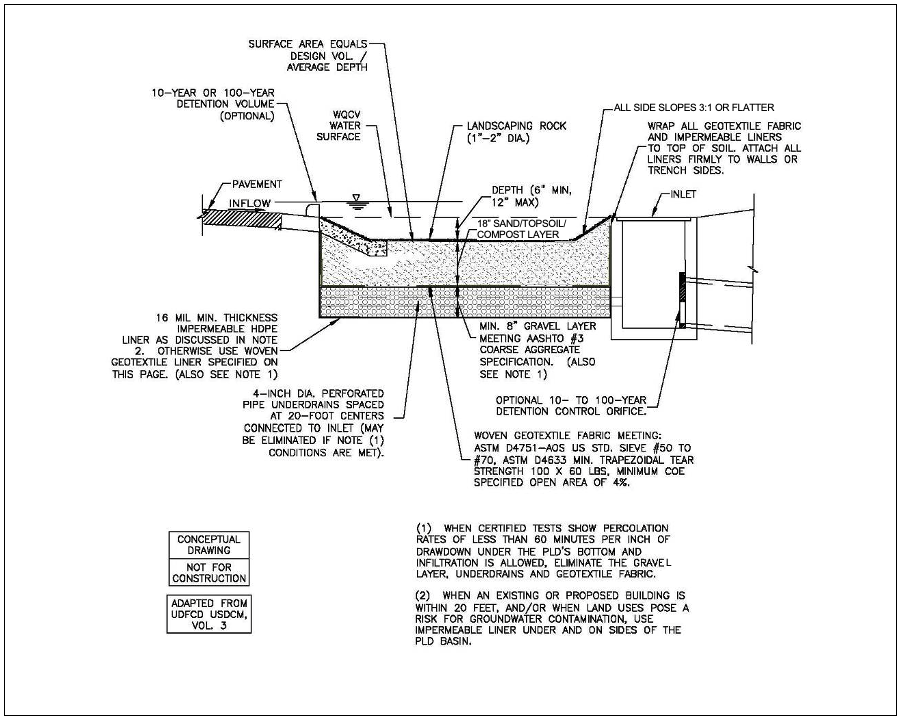
4.4.6. Design Example
The following example demonstrates use of the PLD Worksheet in the BMP Spreadsheet.
Given: Assume a tributary drainage area of 50,350 square feet (approximately 1.16 acres) of impervious parking area draining to a parking lot island depression.
Determine: Volume and surface area of a porous landscape detention basin along with other design attributes.
Worksheet Data Input
Porous landscape detention characteristics and design constraints are entered into the input cells of the PLD Worksheet. The WQCV required is calculated using the method described in Section 3.2 of this chapter for a 12 hour drain time.
A WQCV of 2,870 ft3 was used for further calculations. The average depth of the porous landscape detention basin must fall between 0.5 feet and 1.0 foot. For this example, an average depth of 9 inches (0.75 feet) was selected. Also, assume that the site consists of well-draining soils and that the tributary drainage area does not contain land uses that may have petroleum products, greases or other chemicals.
Porous Landscape Detention Characteristics – User Inputs
- Contributing watershed area = 50,350 ft2
- Ia = 100%
- Average depth, dav = 0.75 ft
- Subgrade soil characteristics = well-draining
- Land use = no potential for contamination
Results
Results of the analysis are displayed in the PLD Worksheet (see example worksheet on following page). The results indicate:
- The minimum required surface area = 3,827 ft2.
- The porous landscape detention basin will be drained via infiltration to the subgrade with a woven geotextile fabric.
- A sand-topsoil-compost mix (minimum 18 inch depth) will be used above the woven geotextile fabric. No underdrain is required.
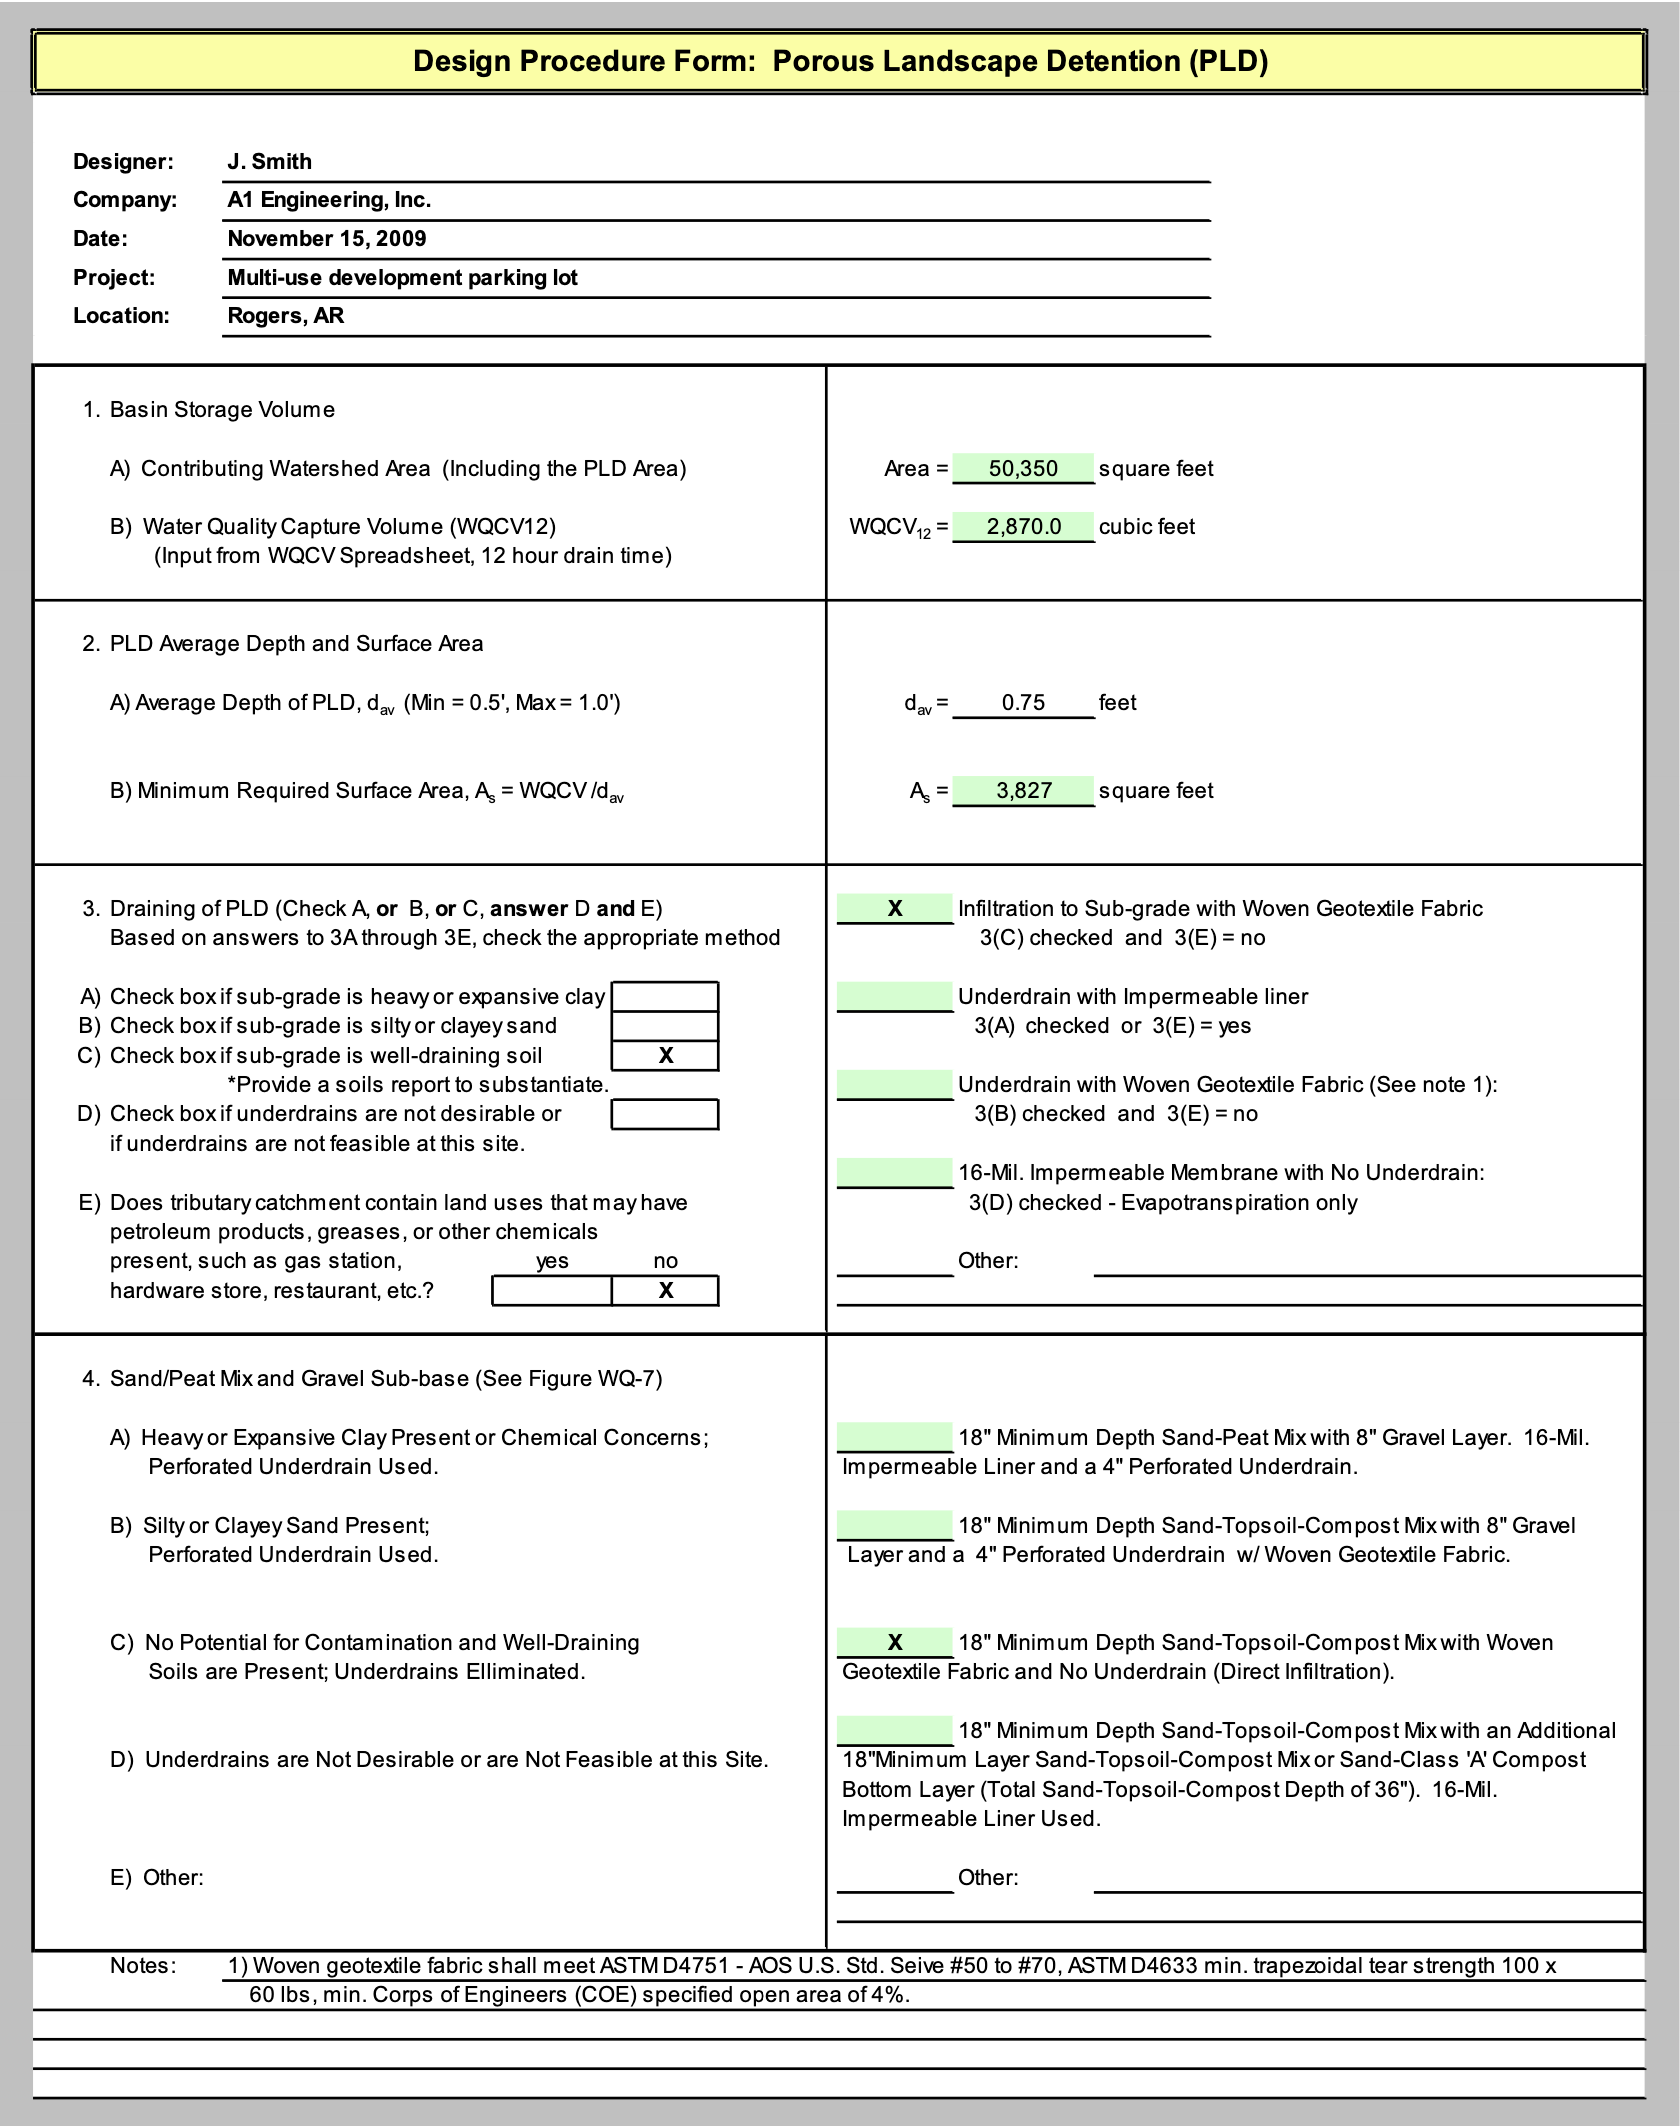
4.5.1. Description
Permeable pavers are intended for use in low vehicle movement areas such as residential driveways and parking pads to accommodate vehicles while simultaneously facilitating stormwater infiltration from precipitation on the porous pavement. Permeable pavers can also be used for residential street parking lanes; maintenance roads and trails; emergency vehicle and fire access lanes in apartment or office complexes; low vehicle movement zones such as parking aprons and maintenance roads; and emergency stopping lanes, crossovers, or parking lanes on divided highways. Some of these options will require City approval and a variance from the City’s standard road sections; the developer is strongly urged to discuss these options with the City early in the development process.
Porous asphalt and concrete will be considered on an individual basis and an individual design shall be provided stamped by a licensed engineer. This chapter will provide information and a design process for permeable pavers.
Permeable pavers consist of open void concrete block units laid on a gravel sub-grade. The surface voids are filled with sand or sandy loam turf. An alternate approach is to use reinforced grass porous pavement, consisting of grass turf reinforced with plastic rings and filter fabric underlain by gravel. The permeable pavers shall be mildly sloped, but not completely flat, to decrease the effective imperviousness of a site without creating standing water problems. The permeable pavers can be considered to reduce the imperviousness over the installation area by approximately 25 percent, depending on the exact void ratio of the block.
Photograph WQ-6 – Example of Permeable Pavers.
This pavement helps to reduce imperviousness and promote
Infiltration in low vehicle movement areas.
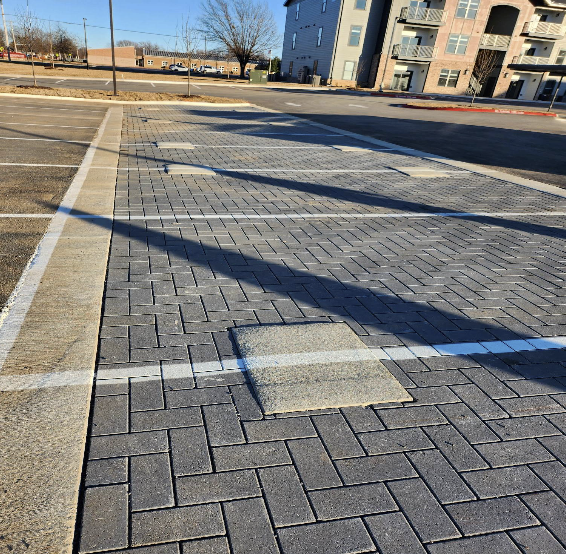
In addition to serving the function of removing particulate pollutants and other constituents, similar to a sand filter application, permeable pavers can reduce flooding potential by infiltrating or slowing down runoff. Paver block patterns, colors, and materials can serve both functional and aesthetic purposes.
Photograph WQ-7 –A variety of designs are available for porous pavement that can be selected to best fit the site surroundings.
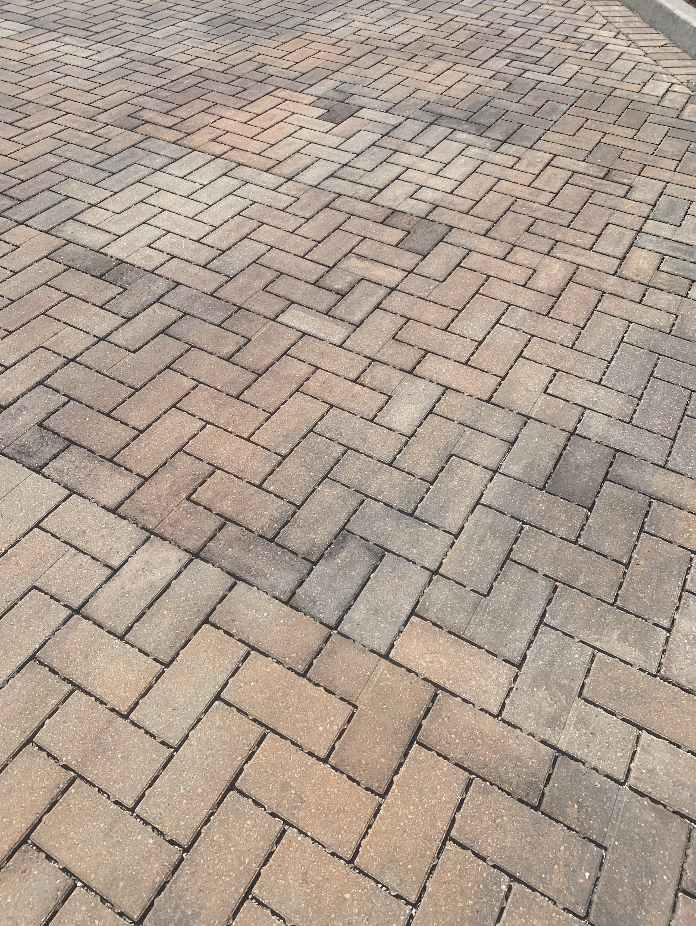
The primary disadvantages of permeable pavers are cost and the lack of performance data in areas that are subject to severe freeze-thaw cycles. However, observations indicate that permeable pavers functions well in freeze-thaw cycles when properly designed and installed. Other potential disadvantages are uneven driving surfaces and potential traps for high-heeled shoes. Also, the cost of restorative maintenance can be relatively high if the system gets plugged with sediment. Maintenance of permeable pavers is the responsibility of the property owner or POA.
4.5.2. Design Considerations
Drainage – Permeable pavers must be installed with a free draining sub-grade or an underdrain system to ensure drainage of the gravel sub-grade. This BMP may not be used at industrial, transportation, or similar sites where chemical or petroleum spills are a possibility unless an impermeable membrane is installed to prevent groundwater contamination. The cumulative drainage area directed to the permeable pavers’ surface area must not exceed a 5:1 ratio without consulting and receiving approval from the City Engineer.
Vehicle access lanes - Vehicle movement (i.e., not parking) lanes that lead up to the permeable pavers need to be solid asphalt or concrete pavement.
Void area - Multiple block patterns are acceptable, provided they have at least 20 percent (40 percent preferred) of the surface area as voids. Upon installation, every effort shall be made to assure even flow distribution over the entire porous surface. The pervious area is generally assumed equal to the surface void area of the paver block.
Sedimentation and Debris – Every effort shall be made to prevent sedimentation and debris from entering the void space within the paver blocks during and after construction. A woven geotextile fabric will need to be placed over the base course and/or paver blocks depending on the completion of the system while there are ongoing construction activities adjacent to the permeable paver system or anywhere they would be driven over during construction. Woven geotextile fabric will need to be covered with ply wood to protect the permeable pavers. Additional steps may be required if damage is observed.
Upstream Stabilization – Any area upstream of the permeable paver system will need to be stabilized to prevent sedimentation and debris from entering the system during construction. Any slope 3:1 or greater and adjacent or upstream to the pavers will be required to be sodded.
Adjacent Foundations – Because the permeable paver system promotes infiltration of storm runoff into the sub-base, structural foundations will need to be proposed at least 20-feet away from the edges of the system unless engineered for saturated soil conditions.
Subsurface Detention – The permeable paver system may be utilized as detention to address an increase in runoff. The system will need to be sized to detain for a period of 24 hours.
Pre-Construction Infiltration Testing - The contractor shall conduct pre-construction infiltration testing per Section 103 of the Rogers Standard Specifications after Preparation of Surface and prior to placement of aggregate. The Contractor shall submit pre-construction infiltration test results to the EOR and City Engineer for review and approval prior to installation of other permeable paver system components.
Post-Construction Infiltration Testing - The contractor shall conduct post-construction infiltration testing within 7 days prior to the Final Acceptance Inspection per Section 103 of the Rogers Standard Specifications and submit post-construction infiltration test results to the EOR and City Engineer. Passing post-construction infiltration tests will be required prior to issuance of Certificate(s) of Occupancy.
Manufacturer’s Specifications – Permeable pavers shall be installed per manufacturer’s specifications. Conflicts between the manufacturer’s specifications and City Standard Specifications will be evaluated on a case-by-case basis.
4.5.3. Design Procedure and Criteria
The following steps outline the permeable pavers design procedure and criteria. The Permeable Pavers (PmP) Worksheet in the BMP Spreadsheet will aid in the design procedure. Figure WQ-9 shows cross-sections of paver block installation and its sub-grade.
- Block selection - Select appropriate paver blocks that have no less than 20 percent (40 percent preferred) of the surface area open and have a minimum thickness of 3 inches. The manufacturer’s installation requirements shall be followed with the exception that Rock Media Pore Volume Inlay Material and Base Course minimum dimensions and requirements in this section shall be followed.
- Void space fill material - The permeable pavement openings shall be filled with jointing and bedding aggregates as specified by the paver block manufacturers and shall be placed on a 1-inch-thick leveling course of the aggregate.
- Base course and geotechnical report - The base course shall be AASHTO No. 3 coarse aggregate with all fractured surfaces and have a minimum depth of 8 inches. For drainage volume calculations, assume 30 percent of the total base coarse volume to be open pore space. The geotechnical characteristics of the base coarse and sub-grade shall be documented in a report from a geotechnical engineer. A pavement design may be required by the City.
- Geotextile - The use of any geotextile material will need to meet the following requirements: ASTM D-4751 – AOS U.S. Std. Sieve #50 to #70 and D-4632 – Trapezoidal tear strength ≥ 100 x 60 lbs; with USACE specified minimum open area ≥ 4 percent.
- Barrier for pollutants (if needed) - If the contributing drainage area is a land use with potential activities that store, manufacture, or handle fertilizers, chemical, or petroleum products, install an uninterrupted and puncture free 16-mil polyethylene or PVC impermeable membrane and provide an underdrain system under the base course. Otherwise, to permit infiltration, use a geotextile material that meets the ASTM requirements listed under Item 4, above.
- Required porous pavement area - The design area ratio of contributing impervious area to porous pavement area shall not exceed 5:1.
- Perimeter wall - If a concrete perimeter wall is provided, it should confine the edges of the permeable pavers block area. The wall shall be a minimum of 8-inches wide and 18-inches deep (see Figure WQ-9). If necessary, perimeter walls that are 36 inches in depth or greater shall incorporate rebar in the design to increase the tensile strength of the walls. Perimeter wall designs incorporating rebar will need to include, at a minimum, a #4 horizontal bar offset 3 inches from the bottom of the wall.
- Flow cut-off barrier - Provide 16-mil or thicker polyethylene or PVC membrane liner placed vertically or concrete walls to separate individual cells of the porous base course to cut-off horizontal flow of water (see Figure WQ-9).
Space these cut-off barriers according to the following equation: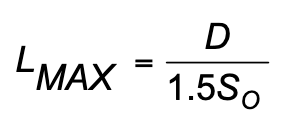 (Equation WQ-5)
in which:
LMAX = Maximum distance between cut-off membrane normal to the flow (ft)
SO= Slope of the base course (ft/ft) (0.0 < SO< 0.02)
D = depth of gravel base course (ft)
Underdrains and Cleanouts – Install 6-inch or 8-inch underdrains at the bottom of the coarse aggregate layer. Underdrains shall connect to an existing storm sewer or daylight to an appropriate stormwater drainage conveyance. Cleanout ports shall be provided with 45º vertical bends at the upstream end and horizontal bends, spaced at a maximum of 200 feet. See Figure WQ-10. Provide a soils analysis.
4.5.4. Maintenance
The sand filling the voids within the concrete block pavement will need to be replaced when clogging is evident. Intermittent repairs to the permeable pavers may be necessary due to potential for breakage or displaced blocks caused by heavy machinery or trucks on the permeable pavers. Maintenance of permeable pavers is the responsibility of the property owner or POA. Use of permeable pavers in areas used by the public will be required to be maintained according the maintenance schedule provided by the City. The responsible party must maintain the permeable paver system as directed by the City of Rogers Permeable Paver System Inspection and Maintenance requirements. The responsible party must record maintenance activities and frequencies on City of Rogers Annual Inspection and Maintenance Log. A letter stating the paver system will be perpetually maintained by the owner per the manufacturer’s specifications and per the annual maintenance and inspection log will need to be submitted prior to issuance of a Land Disturbance Permit.
Figure WQ-9 Permeable Pavers
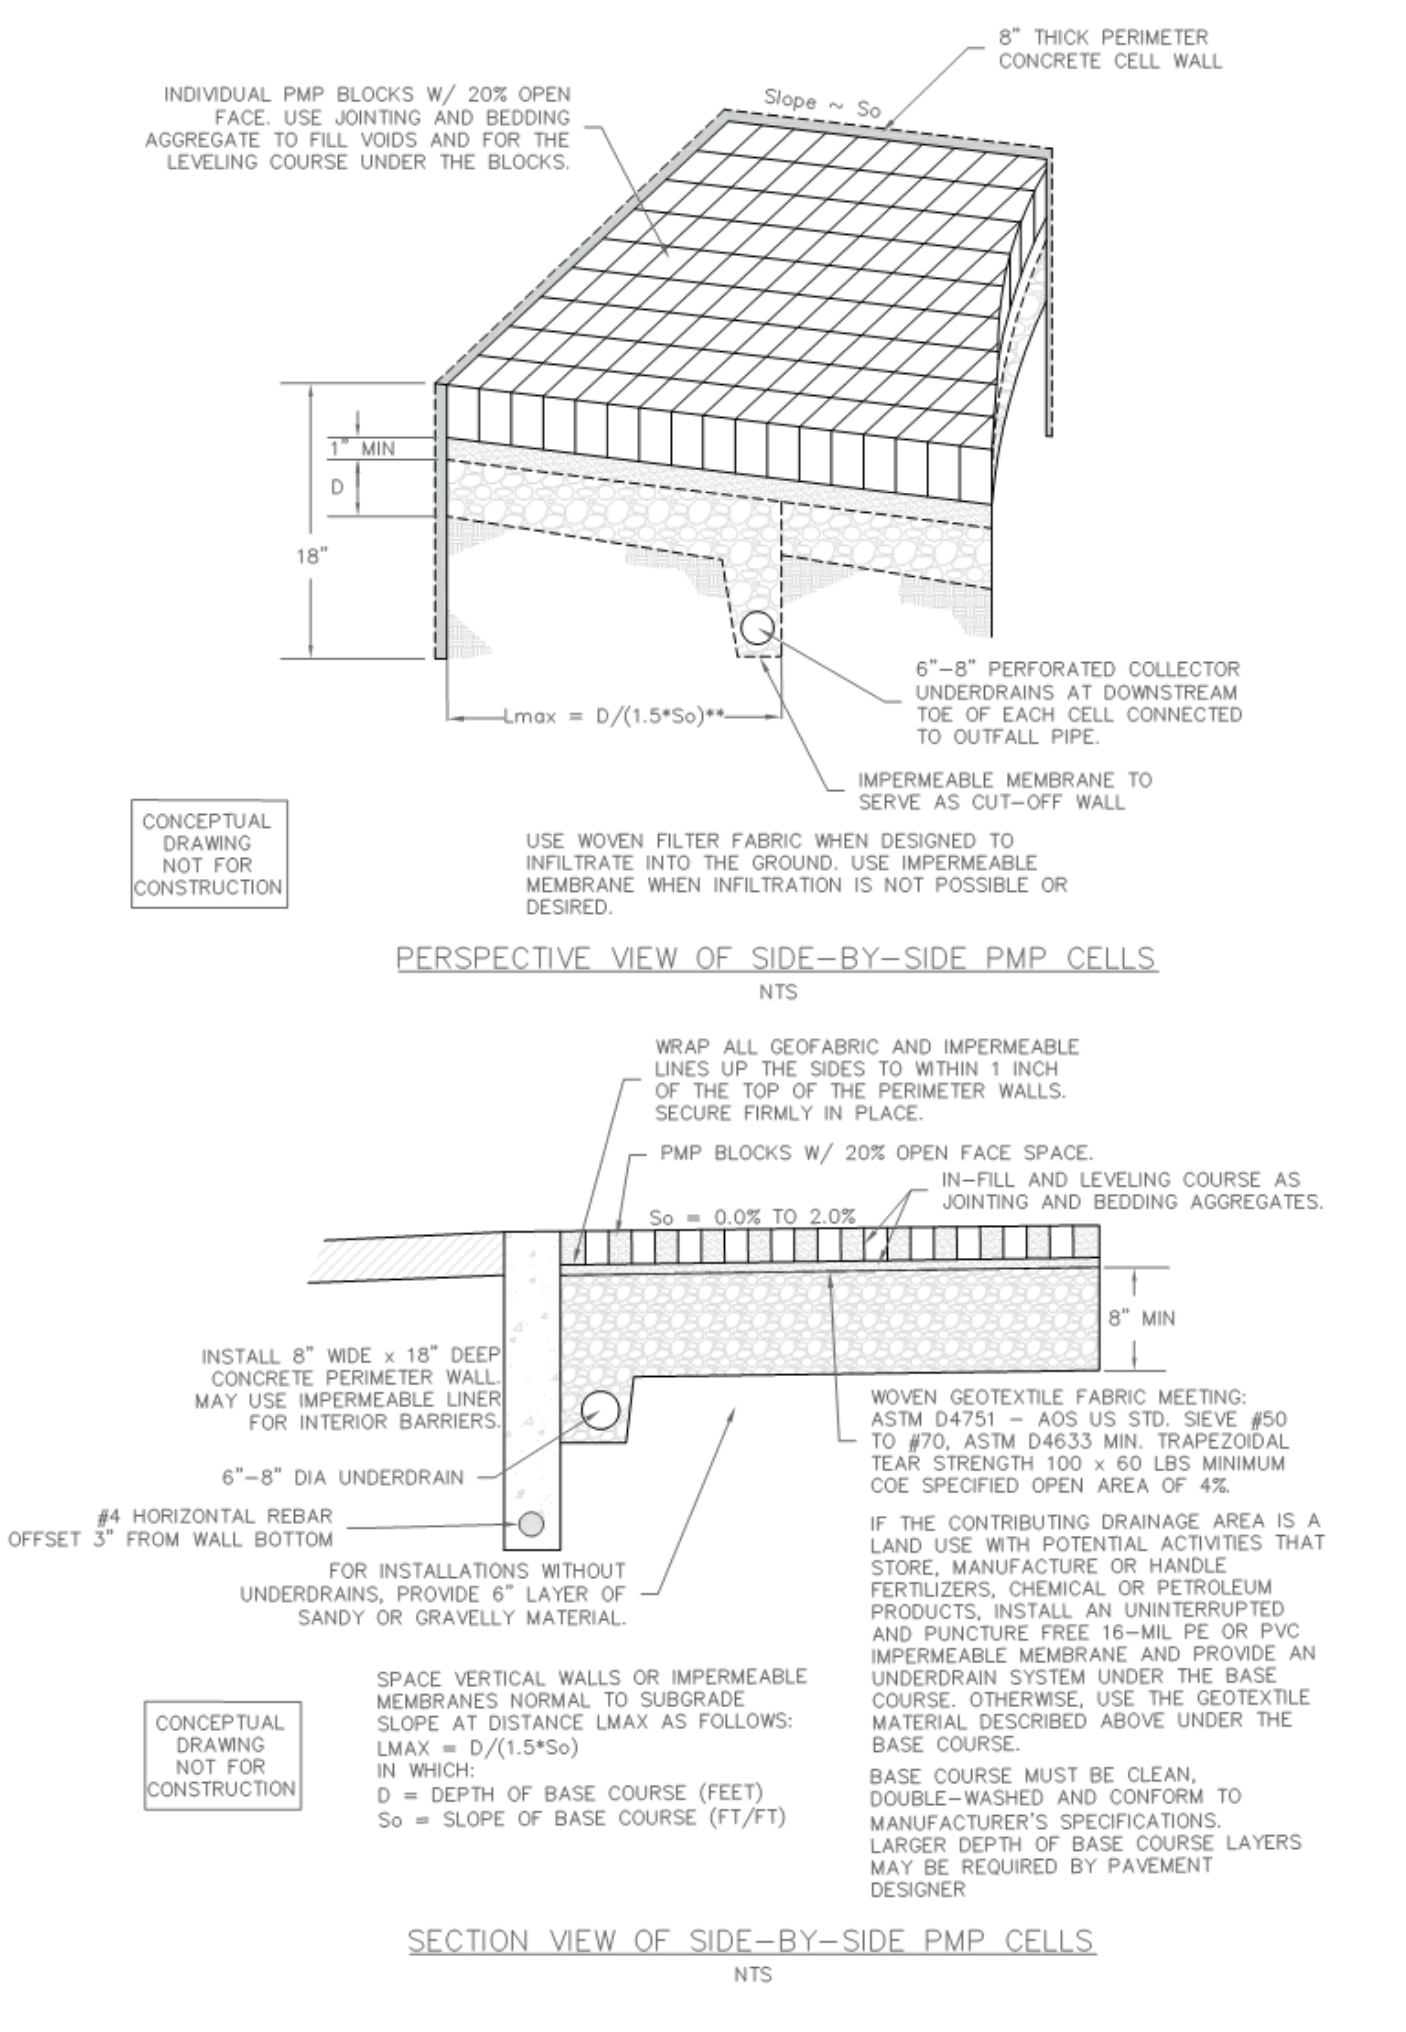
Design Example
The following example demonstrates use of the Permeable Pavers (PmP) Worksheet in the BMP Spreadsheet. The tributary area, porous pavement area, type of modular block, and existing sub-grade soils are given. There are several additional parameters that must be selected by the designer.
Given: Assume a porous pavement area (pedestrian shopping plaza) of approximately 10,000 ft2 with an additional 14,000 ft2 of impervious area (surrounding building rooftops) draining onto the porous pavement. The resulting ratio of contributing impervious area to porous pavement area is 1.4. Paver block properties for the selected block (Uni Eco-Stone by Unilock) include an open surface area of 40 percent with a block thickness of 3 1/8 inches. The existing sub-grade consists of silty sands and there is no anticipated potential for groundwater contamination. Open surface area of paver blocks = 40 percent. Minimum thickness of paver blocks = 3.125 inches.
Determine: The materials and layout of a permeable paver system
Worksheet Data Input
Permeable paver characteristics and design constraints are entered into the input cells of the PmP Worksheet.
There are several design parameters that are selected by the designer for materials and layout. The City recommends specific materials and layouts; however, other types may be selected if approved by the City. For this example, criteria set forth by the City are used:
- ASTM C-33 sand for porous pavement infill and leveling course
- A woven geotextile fabric between the sand and gravel layers
- Minimum thickness of gravel layer = 8 inches. (12 inches selected for this example)
- Maximum impervious area to porous pavement area ratio = 2.0 (1.4 for this example)
- A concrete wall (6 inches thick) around the perimeter and to separate interior cells
- Slope of base course = 1 percent (0.01 ft/ft)
- Distance between cutoff walls = 50 ft (selected based on maximum calculated in spreadsheet)
Results
Results of the analysis are displayed in the PmP Worksheet (see sample worksheet on following page).
- Maximum distance between cutoff walls = 67 ft. A distance of 50 feet was selected since the porous pavement area is approximately 200 feet long by 50 feet wide (4 cells with 3 interior walls).

Figure WQ-11 Permeable Paver System Annual Inspection & Maintenance Log

4.6.1. Description
Vegetated filter strips/grass buffer strips are uniformly graded and densely vegetated areas of turfgrass, planted native grasses, or adequate existing grass. They require sheet flow to promote filtration, infiltration, and settling of runoff pollutants. Grass buffers differ from grass swales since they are designed to accommodate overland sheet flow rather than concentrated or channelized flow. Grass and other vegetation provide aesthetically pleasing green space, which can be incorporated into a landscaping and bufferyard plan. In addition, their use typically adds little cost to a development when incorporated into the existing green space requirements, and their maintenance requirements are comparable to routine maintenance of onsite landscaping.
Grass buffers can be utilized for a variety of land uses and are typically located adjacent to impervious areas. Because of the large amount of space required for grass buffers to satisfy complete water quality requirements, additional BMPs are often required. Grass buffers can be used on many sites and are strongly encouraged to provide first flush pollutant removal and infiltration for small rainfall events.
Because the effectiveness of grass buffers depends on having an evenly distributed sheet flow over their surface, the size of the contributing area and the associated volume of runoff must be limited. Whenever concentrated runoff occurs, it shall be evenly distributed across the width of the buffer via a flow spreader or other type of structure used to achieve uniform sheet-flow conditions.
Photograph WQ-8 – Example of a Grass Buffer.
Healthy, dense vegetation helps filter runoff from an adjacent road and parking lot.
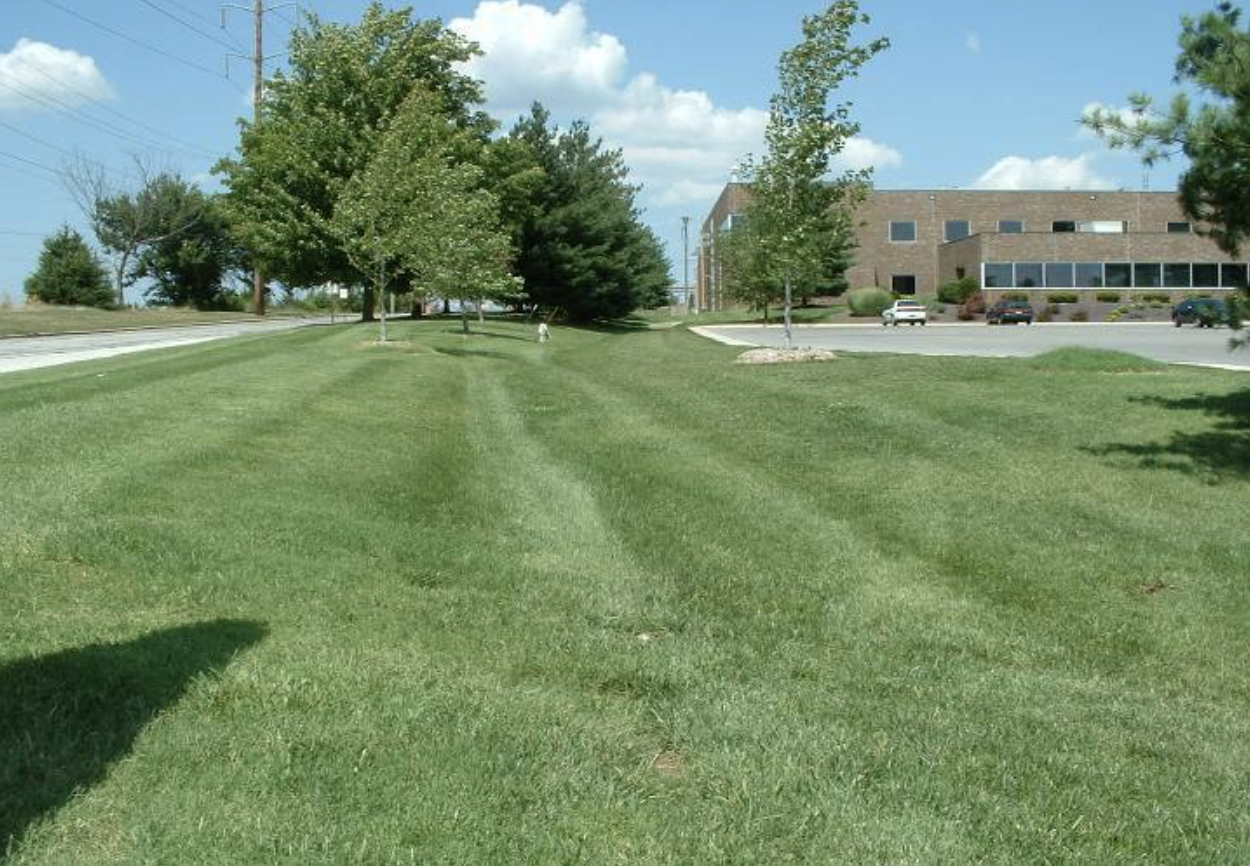
4.6.2. Design Considerations
Major considerations for the design of a vegetated filter strip/grass buffer are summarized below:
Preservation of sheet flow – Design of a grass buffer is largely based on maintaining sheet-flow conditions across a uniformly graded area with a gentle slope and a dense grass cover. When a grass buffer is used in areas with unstable slopes, soils or vegetation, formation of rills and gullies that disrupt sheet flow will occur. The resultant short-circuiting will eliminate the intended water quality benefits and must be corrected through maintenance.
Shape of grass buffer area – The preferred shape for a grass buffer is a rectangular strip. The strip shall be free of gullies or rills that concentrate the flow over it. Concentrated runoff shall be evenly distributed across the width of the grass buffer via a flow spreader.
Protection of vegetation – Grass buffers shall be protected from excessive pedestrian or vehicular traffic that can damage the grass cover and affect uniform sheet-flow distribution. A 4-inch topsoil layer that is free of rocks and debris must, prior to vegetation, be spread over the grass buffer area to promote a healthy stand of grass. A mixture of grass and trees may offer benefits for slope stability and improved aesthetics.
4.6.3. Design Procedure and Criteria
The following steps outline the grass buffer design procedure and criteria. Figure WQ-10 is a schematic of a grass buffer facility and its components. The Grass Buffer (GB) Worksheet in the BMP Spreadsheet will aid in the design procedure using the steps described below.
- Peak flow rate – Calculate the 2-year peak flow rate, Q2-yearof the area draining to the grass buffer (in cubic feet per second [cfs]), as described in Chapter 3 – Determination of Stormwater Runoff.
- Minimum design width – The minimum design width, WG (ft), (perpendicular to flow) is calculated as:
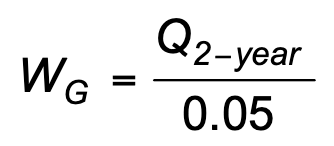 (Equation WQ-6)
 - Minimum design length – The minimum design length, LG (ft), along the sheet flow direction is dependent on the upstream flow conditions.
For sheet flow conditions, LG (ft) is calculated as the greater of the following:
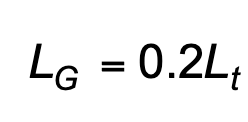 or 6 feet (Equation WQ-7)
In which:
Lt = Flow path length (ft) of sheet flow over the tributary impervious surface
For concentrated flow conditions, LG is calculated as the greater of the following:
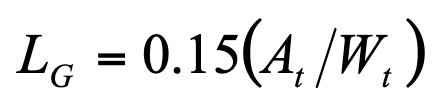 (Equation WQ-8)
or 6 feet
In which:
Wt = Width of the tributary inflow normal to the flowspreader (i.e., width of flowspreader) (ft)
At = Tributary area (ft2)
- Longitudinal slope – The slope in the direction of flow, S, shall not exceed 4 percent.
- Flow dispersal – Incorporate a device on the upstream end of the buffer to evenly distribute flows along the design length when runoff is concentrated.
- Establishment of vegetation – Sod the grass buffer, or plant an alternative vegetation cover approved by the City, and cover with suitable erosion control measures until vegetation is established.
- Collection of outflow – Provide a means for outflow collection. The buffer can drain to a grass swale, storm sewer, or street gutter in accordance with design criteria for those facilities. In some cases, the use of underdrains can maintain better infiltration rates as the soils saturate. This will help dry out the buffer after storms or periods of irrigation.
4.6.4. Maintenance
If the grass buffer is located adjacent to urban activity, routine mowing of the strip may be necessary for aesthetic purposes. Eventually, the grass strip next to the spreader or the pavement will accumulate a sufficient amount of sediment to block runoff. At that time, a portion of the grass buffer strip will need to be removed and replaced.
Figure WQ-12 Application of Grass Buffers (Filter Strips)
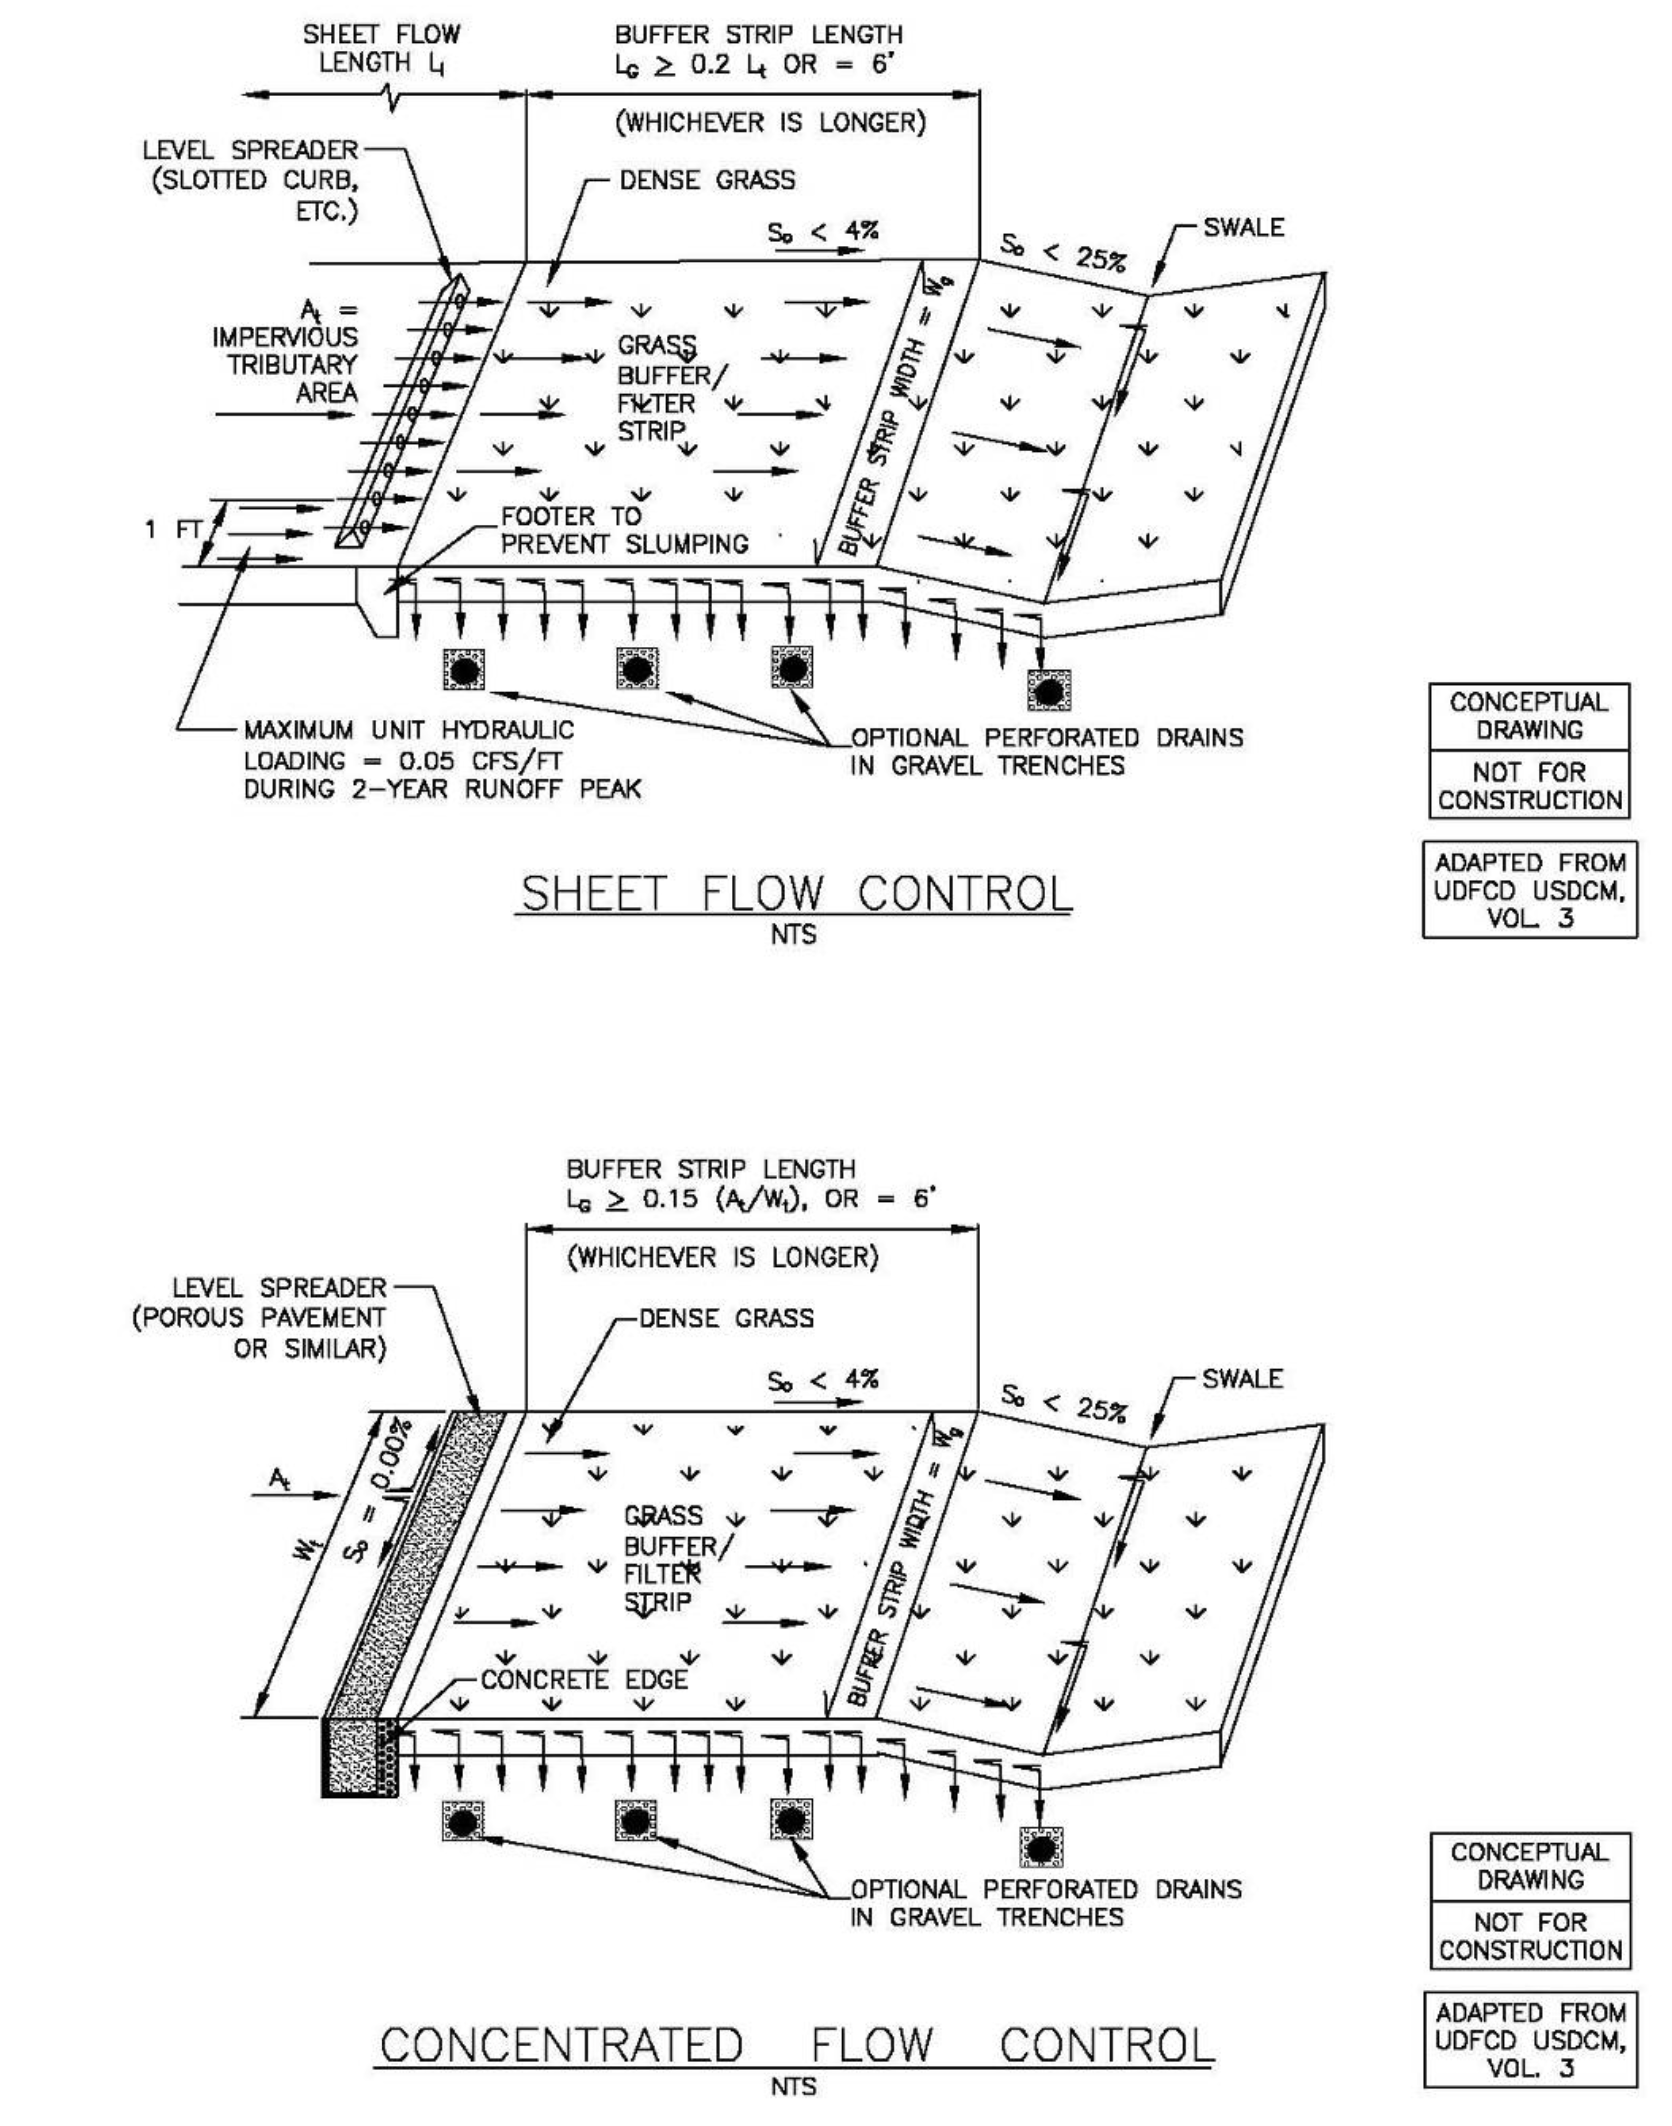
4.6.5. Grass Buffer Design Example
The following example demonstrates use of the GB Worksheet in the BMP Spreadsheet.
Given: A tributary drainage area of 30,000 square feet (ft2) of impervious parking area that results in a 2-year peak flow rate of 3.7 cfs (the peak flow rate is calculated using the Rational Method as described in Chapter 3 – Determination of Stormwater Runoff. The tributary flow path is approximately 100 feet long, and the runoff from the parking area is sheet flow.
Determine: Minimum width and length of a grass buffer along with other design attributes.
Worksheet Data Input
The GB Worksheet requires input for the grass buffer characteristics and design constraints as described below:
Grass Buffer Characteristics - User Inputs
Q2 = 2-year peak flow rate = 3.7 cfs
At = Tributary area = 30,000 ft2
Lt = Length of flow path over tributary impervious surface = 100 ft
S = Slope = 3.0 percent
Additional User Inputs
A flow distribution method is not required since the parking area runoff exhibits sheet flow.
Sod was selected as the vegetation method for the grass buffer.
A grass swale will be used for outflow collection.
Results
Results of the analysis are displayed in the GB Worksheet (see sample worksheet on following page). The results indicate:
- Minimum width of grass buffer (WG)(normal to runoff flow path) = 74 ft
- Design length of grass buffer (LG)(along direction of flow) = 20 ft

4.7.1. Description
A grass swale is a densely vegetated drainageway with gentle side slopes that collects and slowly conveys runoff. A grass swale can be located to collect overland flows from areas such as parking lots, buildings, residential yards, roadways, and vegetative filter strips/grass buffers. A grass swale is set below adjacent ground level and runoff enters the swale over grassy banks. Swales in residential and commercial settings can also minimize DCIA by using them as an alternative to a curb-and-gutter system. A grass swale is generally less expensive to construct than a concrete or rock-lined drainage system, and via infiltration can also provide some reduction in runoff volumes from small storms. The grass swale shall be vegetated with dense grasses that can reduce flow velocities and protect against erosion during larger storm events.
Photograph WQ-9 – Example of a Grass Swale.
This grass swale filters runoff from a road and helps reduce flow velocities.
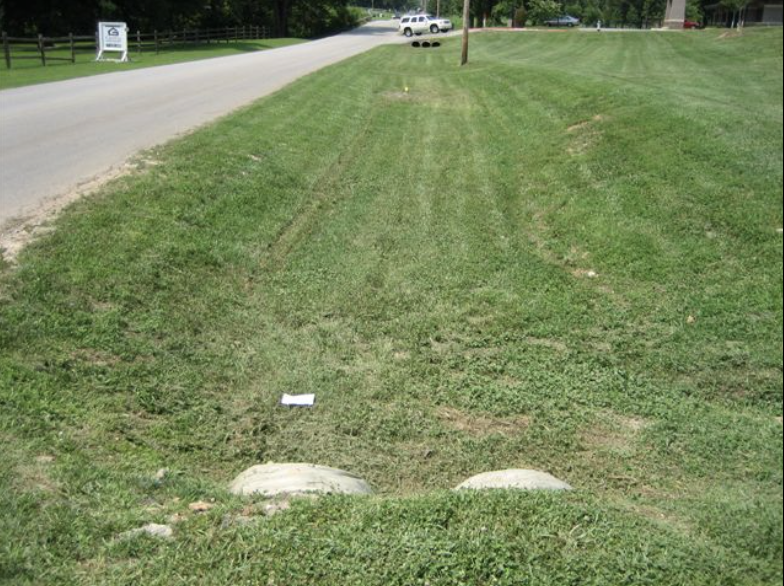
4.7.2. Design Considerations
Major considerations for the design of a grass swale are summarized below:
Swale slope – A grass swale is sized to maintain a low velocity during small storms and to collect and convey larger runoff events. A grass swale generally shall not be used where site slopes exceed 5 percent. The longitudinal slope of a grass swale shall be 0.5 to 1 percent, which often necessitates the use of grade control checks or drop structures. Figure WQ-11 shows trapezoidal and triangular swale configurations.
Use of a swale as a grass buffer – If one or both sides of the grass swale are also to be used as a grass buffer, the design of the grass buffer must incorporate the requirements of Section 4.6.
4.7.3. Design Procedure and Criteria
The following steps outline the grass swale design procedure and criteria. Figure WQ-11 is a schematic of a grass swale facility and its components. The Grass Swale (GS) Worksheet in the BMP Spreadsheet will aid in the design procedure using the steps described below.
- Peak flow rate – Calculate the 2-year peak flow rate, Q2-year(cfs), to be conveyed in the grass swale using a method described in Chapter 3 – Determination of Stormwater Runoff. For public improvements, the grass swale must meet the criteria provided in Chapter 6 – Open Channel Flow Design. For all developments with detention, it must be shown that the channel can convey the maximum design flow to the detention basin and that bypass will not occur.
- Swale cross-section geometry – The geometry of the cross-section shall be either trapezoidal or triangular with side slopes of 3H:1V or, preferably, flatter.
- Longitudinal slope – The longitudinal slope, So, of the grass swale shall be 0.5 to 1 percent. If the longitudinal slope requirements cannot be met with the available terrain, grade-control checks or small drop structures must be incorporated to maintain the required longitudinal slope. (See Chapter 6 – Open Channel Flow Design)
- Maximum velocity – To promote sedimentation and enhanced water quality, the maximum velocity of the 2-year peak flow shall not exceed 2 feet per second (ft/s) and the maximum flow depth of the same flow shall not exceed 1 foot.
- Vegetation – Sod the grass swale and cover with a suitable erosion control measure until vegetation is established.
4.7.4. Maintenance
Dense turfgrass must be maintained within a grass swale to retain optimal performance as a water quality BMP. The grass swale must be mowed in accordance with City ordinance unless a maintenance plan for other maintenance methods has been approved by the City Department of Planning and Transportation. If check dams are installed in the grass swale, sediment may accumulate up-gradient of the dams. Accumulated sediment shall be removed when sediment depth exceeds 6 inches, or as necessary to prevent the deposition of sediment downstream.
Figure WQ-13 Profile and Sections of a Grass Swale
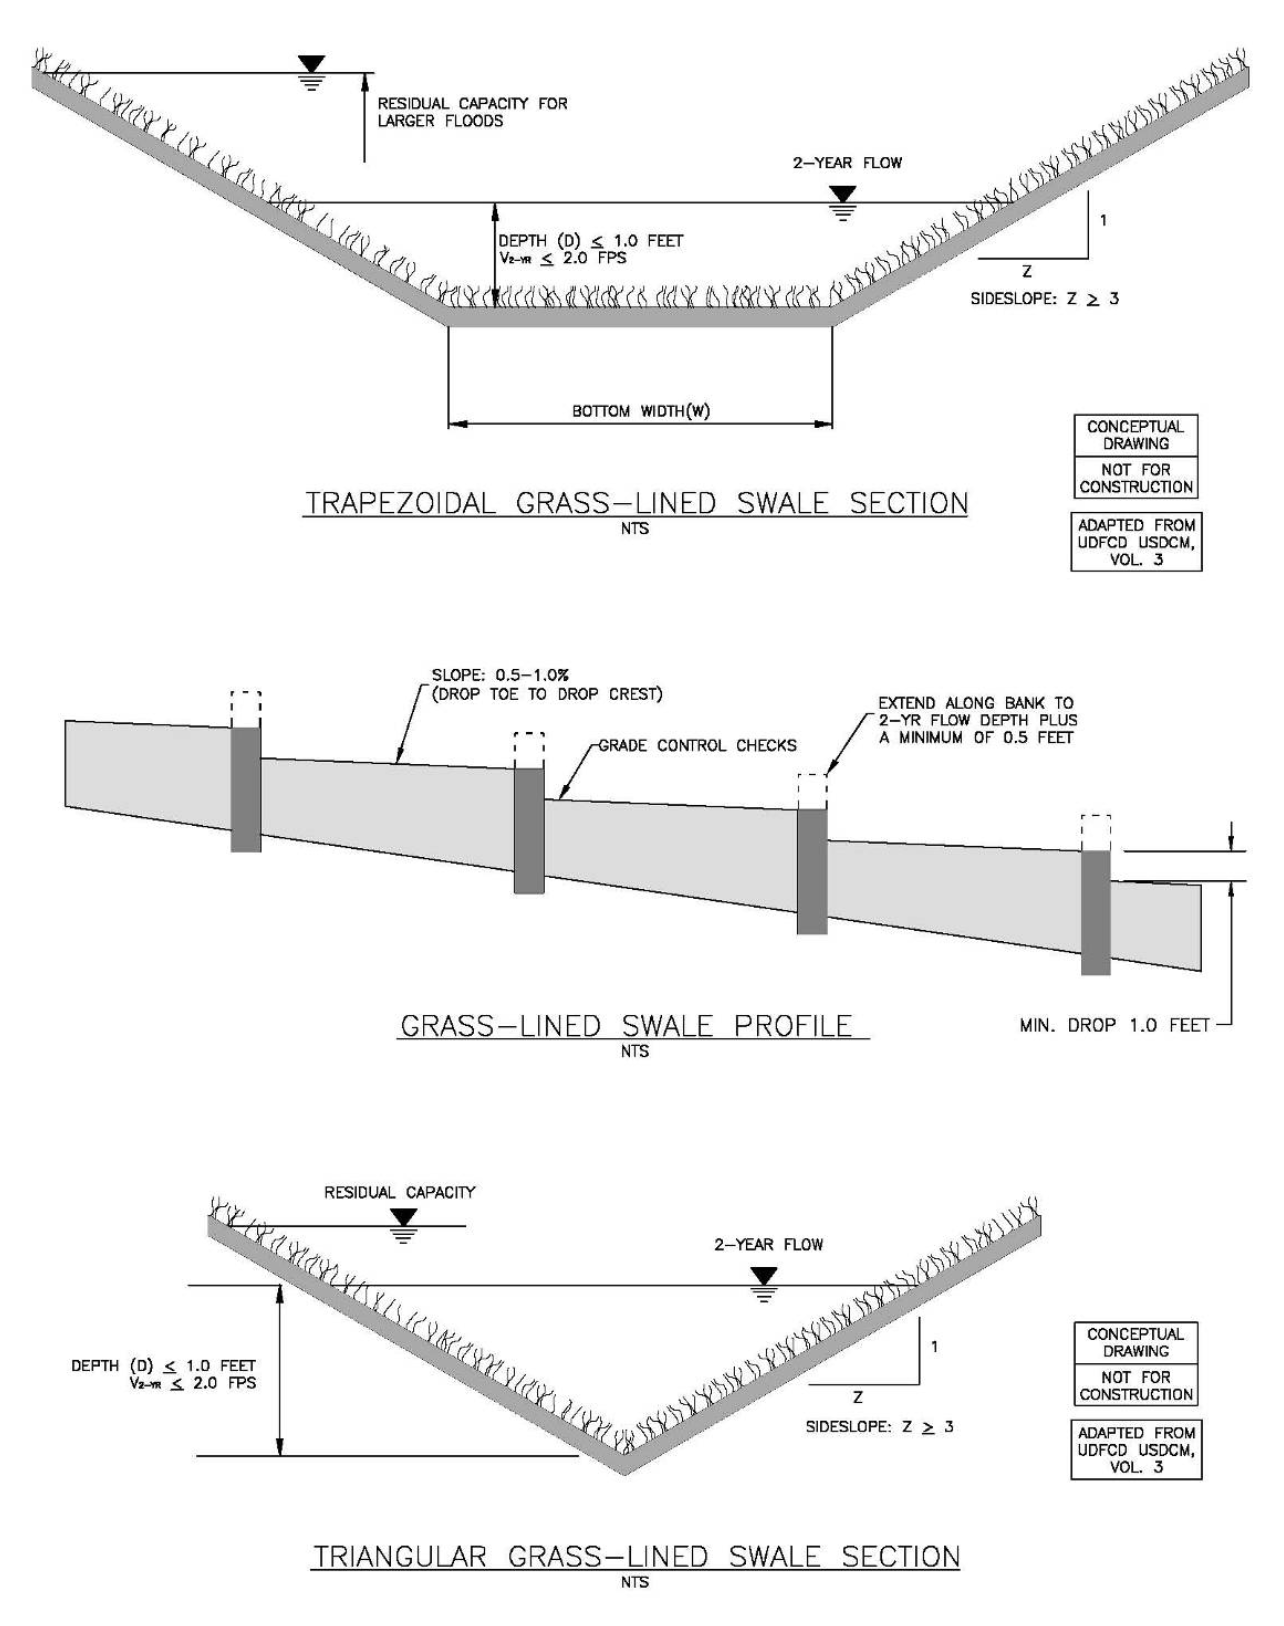
4.7.5. Grass Swale Design Example
The following example demonstrates use of the GS Worksheet in the BMP Spreadsheet.
Given: Assume a portion of the drainage from a residential neighborhood discharges to a grass swale. The 2-year peak flow rate in the grass swale is 18.0 cfs. For water quality purposes, the swale velocity shall not exceed 2.0 ft/s. The design velocity is set at 1.8 ft/s and a side slope of 3:1 horizontal:vertical is selected.
Determine: Swale geometry and longitudinal slope for a given 2-year peak flow rate and design velocity.
Worksheet Data Input
The GS Worksheet requires input for the grass swale characteristics and design constraints as described below:
Grass Swale Characteristics - User Inputs
Q2 = 2-year peak flow rate = 18.0 cfs
V2 = 2-year design flow velocity = 1.8 ft/s
Z = side slope = 3
Additional User Inputs
Sod was selected as the method of achieving stabilized vegetation.
A detention basin is located at the downstream end of the grass swale to provide additional water quality treatment and flood control.
Results
Results of the analysis are displayed in the GS Worksheet (see sample worksheet on following page). The results indicate:
- Design flow depth = 1.0 ft (the maximum allowed for water quality purposes)
- Bottom width of grass swale = 6.0 ft (trapezoidal channel)
- Froude number = 0.38
- Design slope = 0.0058 ft/ft (0.6%)

Photograph WQ-10 – Example of Covered Storage/Handling Area.
This industrial loading dock is covered to prevent loss of
material during transfer.
Photograph WQ-11 – Spill containment structure with valve control.
- Alternative Structural BMPs
Site conditions may be conducive to the use of alternative BMPs such as proprietary packaged stormwater treatment units. Site conditions may include limited space in an ultra-urban or redevelopment setting, a sensitive receiving water or feature, a site with a high pollutant discharge potential, etc. All proposed units of this type must be reviewed and accepted by the City prior to installation.
1.1. EFFECTIVE DATE
The CSK Regulations shall apply only to development activities that occur in the Cave Springs Direct Recharge Area after Council Approval on July 29, 2015.
1.2. APPLICABILITY
The CSK Regulations shall apply to the following development activities:
- Any development, including but not limited to residential, commercial, industrial, construction of public infrastructure, or other grading activity, that exceeds one acre in disturbance or is part of a larger common development [any project that requires a permit for stormwater discharge from DEQ];
- Any development, including but not limited to residential, commercial, industrial, construction of public infrastructure, or other grading activity, within vulnerability zones 1 and 2 regardless of the size of the disturbance;
- New or expanded industrial use, gas stations, laundromats, commercial development, mining, or hazardous material storage regardless of the size of the disturbance; and,
- Subdivisions of tracts of land which create three or more lots or which subdivide tracts of land greater than one acre.
1.3. EXEMPTIONS
The following development activities shall be exempt from the application of the CSK Regulations:
- Pending applications that have received preliminary plat approval prior to the effective date of the CSK Regulations, provided that such applications shall not be exempt if the final plat is denied or if the preliminary plat approval expires.
- Development of single-family detached home on a residential lot, which was subdivided and developed with public infrastructure prior to the effective date of the CSK Regulations.
- Residential or commercial development on a lot which existed prior to the effective date of the CSK Regulations, which does not cause the disturbance of 1 acre or more and is not part of a larger common development.
1.4. MORE RESTRICTIVE REGULATION APPLIES
In the interpretation and application of these CSK Regulations the provisions herein shall be held to be minimum requirements for the promotion of the public health, safety and welfare. Whenever the requirements of these CSK Regulations are more or less restrictive than the requirement of any other lawfully adopted rules, regulations or ordinances, including any applicable state or federal regulations, the more restrictive regulation or the regulation imposing the higher standards shall govern.
Zones are depicted on mapping shown on Exhibit 10-2. If site-specific conditions indicate that topography, soils, geology or other factors should result in an alternate zone classification, it will be the responsibility of the applicant to technically evaluate and provide supporting information to justify a variance for their project area. Such justification would need to be provided by an Arkansas-registered Professional Engineer and/or an Arkansas-registered Professional Geologist experienced in karst hydrology in a format described in City Ordinance No.
Cave Springs Outer Buffer Width Adjustment Worksheet
| Note: Buffers apply to losing stream and other sensitive features that directly recharge the Cave Springs aquifer. Most losing streams are included in Zone 1; however, there may be losing stream segments and other sensitive features in Zones 2 and 3. Determination of reductions to outer buffer zone should be based on the section(s) of land that are directly affected by the considered reduction(s), rather than applied to the entire area of development. One or more of the reduction considerations can be applied to different areas of the development. Each side of the channel should be considered separately. | ||||||
|---|---|---|---|---|---|---|
| Buffer Condition | Zone 1 - Extremely High Vulnerability | Zone 2 - High Vulnerability | Zone 3 - Moderate Vulnerability | |||
| Maximum outer buffer width both sides of centerline of channel (feet) | 300 | 200 | 100 | |||
| Minimum inner buffer width both sides of centerline of channel (feet) | 100 | 50 | 50 | |||
| Eligible outer buffer width adjustment both sides of centerline of channel (feet) | 200 | 150 | 50 | |||
| Describe the portion and side of channel being considered (banks identified left to right looking downstream) | Ex. Clear Creek, Right Bank Buffer, 2000 feet through Green Acres Development (see attached map). | |||||
| Adjustment Factors | Buffer Adjustment (feet) | Place "X" if applicable | Buffer Adjustment (feet) | Place "X" if applicable | Buffer Adjustment (feet) | Place "X" if applicable |
| 1 - Land Use | ||||||
1a – Parks and open space | -50 | -40 | -30 | |||
| 1b – Large lot residential (>0.5 acre) or low‐density (<2 units/acre) | -25 | -20 | -15 | |||
| 1c – Residential high‐density (>2 units/acre) | 0 | 0 | 0 | |||
| 1d – Office land use | 0 | 0 | 0 | |||
| 1e – Commercial land use | Not allowed per zoning without variance process | Not allowed per zoning without variance process | 0 | |||
| 1f – Industrial land use | 0 | |||||
| 1g – Agricultural land use | 0 | 0 | 0 | |||
| Total Land Use Width Adjustment (feet) | Sum of X's = | Sum of X's = | Sum of X's = | |||
| 2 – Average Ground Slope within 50 feet of edge of inner buffer (choose one) | ||||||
| 2a – 0‐3% toward waterway | -10 | -10 | -10 | |||
| 2b –Greater than 3% toward waterway | 0 | 0 | 0 | |||
| Total Ground Slope Width Adjustment (feet) | Sum of X's = | Sum of X's = | Sum of X's = | |||
| 3 – Outer Buffer Zone Vegetation Characteristics within 50 ft of inner buffer (choose one) | ||||||
| 3a –Good dense, healthy vegetative cover (>80%) | -25 | -20 | -15 | |||
| 3b – Existing fair cover (30‐70%) to be restored to good (>80%) | -35 | -30 | -20 | |||
| 3c –Existing poor cover (<30%) to be restored to good (>80%) | -50 | -40 | -30 | |||
| Total Filtration Characteristics Width Adjustment (feet) | Sum of X's = | Sum of X's = | Sum of X's = | |||
| 4 – Implementing Best Management practices (BMPs) | ||||||
| 4a – No below‐surface disturbance within inner buffer | -20 | -15 | -10 | |||
| 4b – No direct overland or piped discharge to inner buffer or losing stream | -25 | -20 | -15 | |||
| 4c ‐ Minimize directly connected impervious surfaces | -20 | -15 | -10 | |||
| 4d – Stormwater pond designed in accordance with Karst Provisions of City Drainage Manual with additional media filtration layer | -100 | -75 | -50 | |||
| 4e ‐ Other stormwater quality BMPs from City Drainage Manual that provide the WQCV and media filtration of runoff (raingardens, media filters, and similar) | -100 | -75 | -50 | |||
| Total Best Management Practices Adjustment (feet) | Sum of X's = | Sum of X's = | Sum of X's = | |||
| 5 – Wastewater Disposal Quantities & Quality | ||||||
| 5a – City Gravity Sewer System | 0 | -25 | -25 | |||
| 5b – Pumped Effluent Sewer System | 0 | 0 | -25 | |||
| 5c– Septic Tank & Leaching Fields | Not allowed without variance process | Not allowed without variance process | Not allowed without variance process | |||
| 5d ‐Utility trenches constructed with cutoffs in trench to minimize preferential flow through trench bedding | -25 | -20 | -15 | |||
| Total Wastewater Disposal Width Adjustment (feet) | Sum of X's = | Sum of X's = | Sum of X's = | |||
| TOTALS | ||||||
| Outer Buffer Adjustment Total (feet) ‐ Total of adjustments for items with "X" = | ||||||
| Eligible Outer Buffer Width Adjustment from Centerline of Channel | 200 | 150 | 50 | |||
| Adjusted Outer Buffer 200 feet ‐ Total of Adjustments, Minimum of zero (0) = | ||||||
| Total Buffer Width required From Centerline of Channel after adjustments (feet) Inner Buffer + Adjusted Outer Buffer = | ||||||
EXAMPLE - Cave Springs Outer Buffer Width Adjustment Worksheet - EXAMPLE
| Note: Buffers apply to losing stream and other sensitive features that directly recharge the Cave Springs aquifer. Most losing streams are included in Zone 1; however, there may be losing stream segments and other sensitive features in Zones 2 and 3. Determination of reductions to outer buffer zone should be based on the section(s) of land that are directly affected by the considered reduction(s), rather than applied to the entire area of development. One or more of the reduction considerations can be applied to different areas of the development. Each side of the channel should be considered separately. | ||||||
|---|---|---|---|---|---|---|
| Buffer Condition | Zone 1 - Extremely High Vulnerability | Zone 2 - High Vulnerability | Zone 3 - Moderate Vulnerability | |||
| Maximum outer buffer width both sides of centerline of channel (feet) | 300 | 200 | 100 | |||
| Minimum inner buffer width both sides of centerline of channel (feet) | 100 | 50 | 50 | |||
| Eligible outer buffer width adjustment both sides of centerline of channel (feet) | 200 | 150 | 50 | |||
| Describe the portion and side of channel being considered (banks identified left to right looking downstream) | Ex. Clear Creek, Right Bank Buffer, 2000 feet through Green Acres Development (see attached map). | |||||
| Adjustment Factors | Buffer Adjustment (feet) | Place "X" if applicable | Buffer Adjustment (feet) | Place "X" if applicable | Buffer Adjustment (feet) | Place "X" if applicable |
| 1 - Land Use | ||||||
1a – Parks and open space | -50 | -40 | -30 | |||
| 1b – Large lot residential (>0.5 acre) or low‐density (<2 units/acre) | -25 | X | -20 | -15 | ||
| 1c – Residential high‐density (>2 units/acre) | 0 | 0 | 0 | X | ||
| 1d – Office land use | 0 | 0 | X | 0 | ||
| 1e – Commercial land use | Not allowed per zoning without variance process | Not allowed per zoning without variance process | 0 | |||
| 1f – Industrial land use | 0 | |||||
| 1g – Agricultural land use | 0 | 0 | 0 | |||
| Total Land Use Width Adjustment (feet) | Sum of X's = | -25 | Sum of X's = | Sum of X's = | ||
| 2 – Average Ground Slope within 50 feet of edge of inner buffer (choose one) | ||||||
| 2a – 0‐3% toward waterway | -10 | -10 | -10 | X | ||
| 2b –Greater than 3% toward waterway | 0 | X | 0 | X | 0 | |
| Total Ground Slope Width Adjustment (feet) | Sum of X's = | Sum of X's = | Sum of X's = | -10 | ||
| 3 – Outer Buffer Zone Vegetation Characteristics within 50 ft of inner buffer (choose one) | ||||||
| 3a –Good dense, healthy vegetative cover (>80%) | -25 | -20 | X | -15 | X | |
| 3b – Existing fair cover (30‐70%) to be restored to good (>80%) | -35 | -30 | -20 | |||
| 3c –Existing poor cover (<30%) to be restored to good (>80%) | -50 | -40 | -30 | |||
| Total Filtration Characteristics Width Adjustment (feet) | Sum of X's = | Sum of X's = | -20 | Sum of X's = | -15 | |
| 4 – Implementing Best Management practices (BMPs) | ||||||
| 4a – No below‐surface disturbance within inner buffer | -20 | -15 | -10 | |||
| 4b – No direct overland or piped discharge to inner buffer or losing stream | -25 | -20 | -15 | |||
| 4c ‐ Minimize directly connected impervious surfaces | -20 | X | -15 | X | -10 | X |
| 4d – Stormwater pond designed in accordance with Karst Provisions of City Drainage Manual with additional media filtration layer | -100 | X | -75 | X | -50 | |
| 4e ‐ Other stormwater quality BMPs from City Drainage Manual that provide the WQCV and media filtration of runoff (raingardens, media filters, and similar) | -100 | -75 | -50 | |||
| Total Best Management Practices Adjustment (feet) | Sum of X's = | -120 | Sum of X's = | -90 | Sum of X's = | -10 |
| 5 – Wastewater Disposal Quantities & Quality | ||||||
| 5a – City Gravity Sewer System | 0 | X | -25 | X | -25 | |
| 5b – Pumped Effluent Sewer System | 0 | 0 | -25 | X | ||
| 5c– Septic Tank & Leaching Fields | Not allowed without variance process | Not allowed without variance process | Not allowed without variance process | |||
| 5d ‐Utility trenches constructed with cutoffs in trench to minimize preferential flow through trench bedding | -25 | -20 | -15 | |||
| Total Wastewater Disposal Width Adjustment (feet) | Sum of X's = | -25 | Sum of X's = | -25 | Sum of X's = | -25 |
| TOTALS | ||||||
| Outer Buffer Adjustment Total (feet) ‐ Total of adjustments for items with "X" = | -170 | -135 | -60 | |||
| Eligible Outer Buffer Width Adjustment from Centerline of Channel | 200 | 150 | 50 | |||
| Adjusted Outer Buffer 200 feet ‐ Total of Adjustments, Minimum of zero (0) = | 30 | 15 | 0 | |||
| Total Buffer Width required From Centerline of Channel after adjustments (feet) Inner Buffer + Adjusted Outer Buffer = | 130 | 65 | 50 | |||
3.1. DISCONNECTED IMPERVIOUS AREA
Disconnection of impervious area is an important BMP for reducing the volume of runoff that must be treated. Methods of disconnecting impervious areas include direction of downspouts from roofs to pervious areas, use of swales and vegetated buffer strips, cross grading to drain driveways to pervious areas and others. Level spreaders, described in BMP EC-13 in Chapter 8 are effective BMPs for diffusing runoff as shallow flow to a vegetated buffer area. Given the extent of buffers that are required in the Direct Recharge Area, level spreaders can provide many benefits to the buffer areas compared to discharges from concentrated outfalls.
For residential development in Zones 1, 2 and 3, final plats and covenants shall require disconnection of at least 50% of the on-lot impervious area (roofs, hardscaping, driveways, etc.) associated with a development. In Zone 3, office, commercial and industrial sites must provide disconnection of at least 25% of impervious surfaces on the lot. Plans for impervious area disconnection must be included as a part of the Land Disturbance Permit Application and Report.
3.2. PONDS, CONSTRUCTED WETLANDS AND FILTERS
BMPs including extended dry detention, constructed wetland basins, bioretention and sand filters provide a high degree of treatment by virtue of multiple unit processes including sedimentation, filtration, adsorption/absorption, and/or biological processes. These BMPs are acceptable for use in Zones 1, 2, and 3 following the criteria in Chapter 9. Wet ponds or wetlands should be designed to prevent or minimize seepage and maintain a permanent pool. In some cases this may require lining of the pond/wetland.
While the BMPs noted above are acceptable for use in the Direct Recharge Area and are capable of achieving desired results using the criteria in Chapter 9, it is far more common for development in the area to use extended dry detention ponds and combine water quality treatment and flood storage in a facility with a multi-stage storage/outlet design. Extended dry detention basins provide treatment primarily via sedimentation and can be effective BMPs. However, in areas with high permeability soils or when excavated through the fragipan, these ponds can actually serve as direct recharge areas when head builds up in the pond during runoff events.
When extended dry detention facilities are used as BMPs in the Direct Recharge Area (Zones 1, 2 and 3), additional filtration of runoff is required. The Captina and Peridge Series soils in the area have good treatment capability because they contain enough fine material that they allow runoff to percolate at a moderate rate, typically in the range of 0.8 to 1.2 inches per hour. To provide additional filtration, a “filter media” layer must be installed beneath extended dry detention ponds in Zones 1, 2 and 3.
3.3. FILTER MEDIA
Captina and/or Peridge soils scraped from the upper soil horizon during construction and stockpiled are appropriate soils as the base of the filter media. These are silt loam soils that are moderately well drained and have low runoff potential. They are desirable for treatment because of the moderate rate of percolation/infiltration. Given the fact that the media will be placed in the bottoms of extended dry detention ponds and will have a much higher hydraulic loading rate in that setting, native soil that will be used as filter media should be amended with additional sand to achieve the following composition:
- Clay 15%
- Sand 65%
- Silt 20%.
The intent of this media composition is to provide infiltration at a rate ranging from 0.8 to 1.5 inches per hour while water is stored in the pond and draining out through the outlet structure. The initial rate is intended to be in the higher end of the range, with decay over time due to accumulation of fine sediments in the filter layer to the point where it must be maintained to restore infiltration. A long-term infiltration rate through the media of approximately 1 inch per hour is desirable.
Native soil that will be used for filter media must be tested to determine composition and amended to achieve the required composition. Samples of native soil that will be used as filtration media should be tested for potential to leach nutrients and metals so that they do not inadvertently become a contaminant source. Provide a copy of this analysis to the city by a geotechnical firm.
It is critical that the native soils are homogenously mixed with the additional sand and the contractor should collect a minimum of one quality control sample per 10,000 ft2 of pond bottom to confirm that the desired mixture has been achieved. A geotechnical company shall test and provide results to the city. Some tolerances are allowable; however, the percentage of sand should be at least 60%, and the clay content should be no more than 20%.
The use of filter media in the bottoms of extended dry detention ponds in Northwest Arkansas is a new practice, and criteria for filter media may be refined based on testing, field observations, and/or feedback from engineers, developers and regulators. The recommended percentages are based on review of nationwide literature on biofiltration media composition, compatibility with native soils in the area, and a desire to balance the need for treatment with the desire to drain runoff from ponds following events.
3.4. FILTER LAYER FOR EXTENDED DRY DETENTION
A layer consisting of 18-inches of the filtration media described above should be installed beneath the top stage floor, low flow channel and micro-pool as shown in Exhibits 10-3 and 10-4, EDB Filtration Media and Low Flow Channel Details. The filtration media is not intended to be the primary outlet for the extended dry detention pond, instead, it is meant to provide a high level of treatment via filtration for water that infiltrates through the pond bottom while the pond is filling and draining. The pond area should be over-excavated by 18-inches and well-mixed filter media placed in the pond bottom. Filter media should not be compacted to more than 80% standard proctor. Sod is placed on top of the filter media for the top stage floor. The filter layer should be installed as one of the final steps in the construction sequence, once disturbed areas of the site have been stabilized and the forebay and pond outlet structure have been completed.
3.5. FILTER LAYER MAINTENANCE
The forebay of an extended dry detention basin, if specified by design engineer, can play a critical role in maintaining the ability of the filter media to infiltrate water by removing coarse sediments that would otherwise deposit on the pond bottom. Even with this pretreatment, periodic maintenance will be required to maintain infiltration capacity. Routine maintenance should include:
- Mowing and weed control (collect and dispose of clippings).
- Replacement/repair of sod.
- Sediment removal – This is most typically required after large events. If there are visible sediment deposits on the top stage floor, low flow channel or micro-pool they should be removed.
- Aeration – Annual aeration of the top stage floor may be required to maintain infiltration capacity through the sod layer and upper media horizon.
- Because the top stage floor and low flow channel are designed to drain out through the outlet structure in 48 hours, standing water beyond that duration may be an indication that the water quality orifice plate is obstructed.
Maintenance criteria for extended dry detention basins in Chapter 9 also apply.
Exhibit 10-3. Extended Dry Detention Basin Filter Media Detail

Exhibit 10-4. Low Flow Channel Filter Media Details
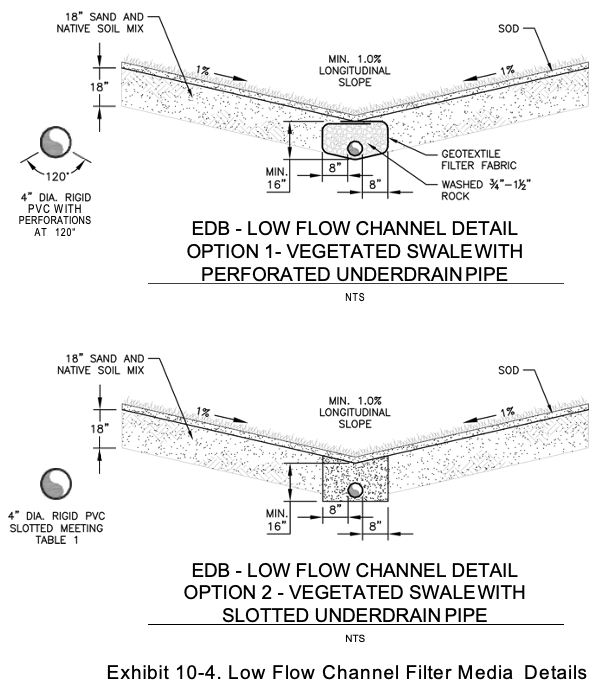
Exhibit 10-5. Trench Dam for Sanitary Sewer Pipeline Trench
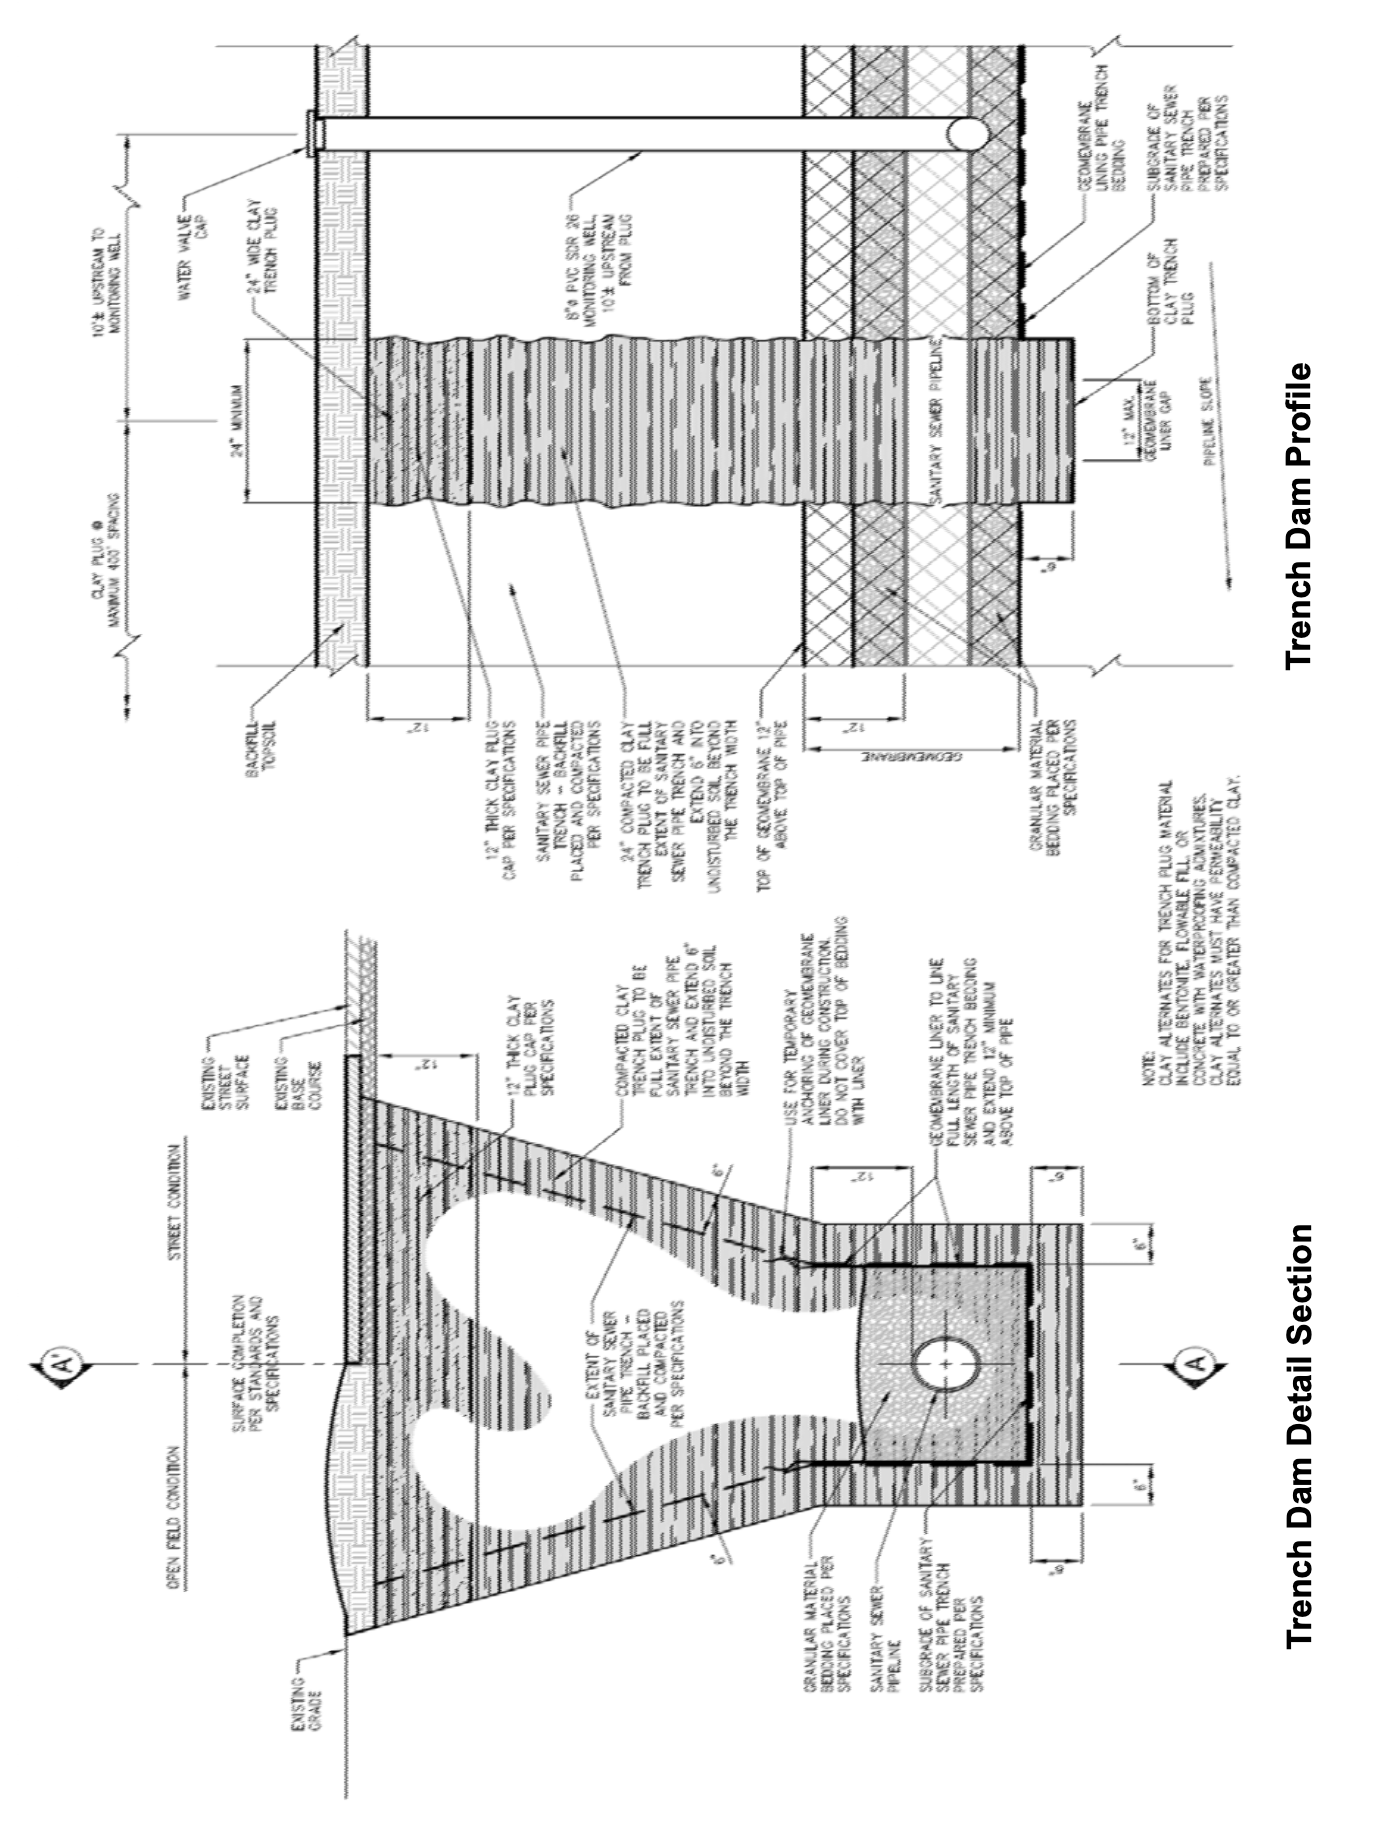
Exhibit 10-6. Bypass Manhole and Quick Connect Detail